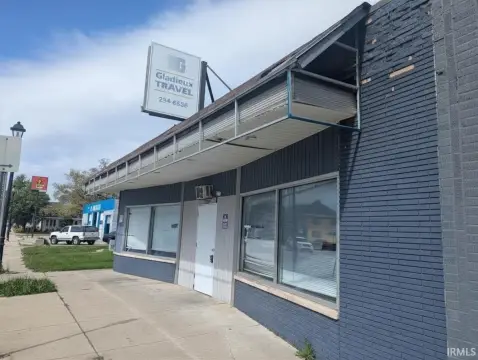
South Bend, IN Live-work Space for Sale
- Mishawaka, IN
- Granger, IN
- Niles, MI
- Osceola, IN
- New Carlisle, IN
- Elkhart, IN
- Lakeville, IN
- Holt, MI

Opportunities in Nearby Cities

Potential Development Sites for Consideration

South Bend, IN Live-Work Space Market Trends and Statistics
Explore 2 live-work space for sale in South Bend, IN on our real estate platform. These investment opportunities span a total of 0 square feet of properties for sale, with an estimated market value of $299,000.
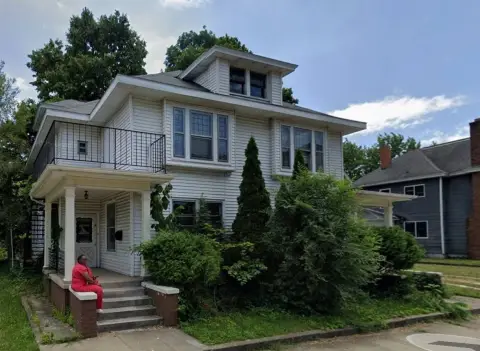
Sale prices for live-work properties in South Bend, IN start at $100,000, averaging $149,500, and reaching up to $199,000 — offering options for a variety of budgets and business needs. Daily updated analytics ensure you stay ahead with the latest data and market trends.
Top Commercial Asset Segments
Commercial property segments ranked by active listings on the market
Demographics Overview
Taxes & Financing
Listings Trend
New vs delisted commercial listings in St. Joseph County
Total CRE Inventory on Market (SF)
Property Size Breakdown
The majority of commercial real estate listings in South Bend fall within the 10,000 to 25,000 square foot range.
Need Help?
Reach out if you need assistance with Realmo tools or have questions about your listings
