How Cap Rates Differ by Asset Class
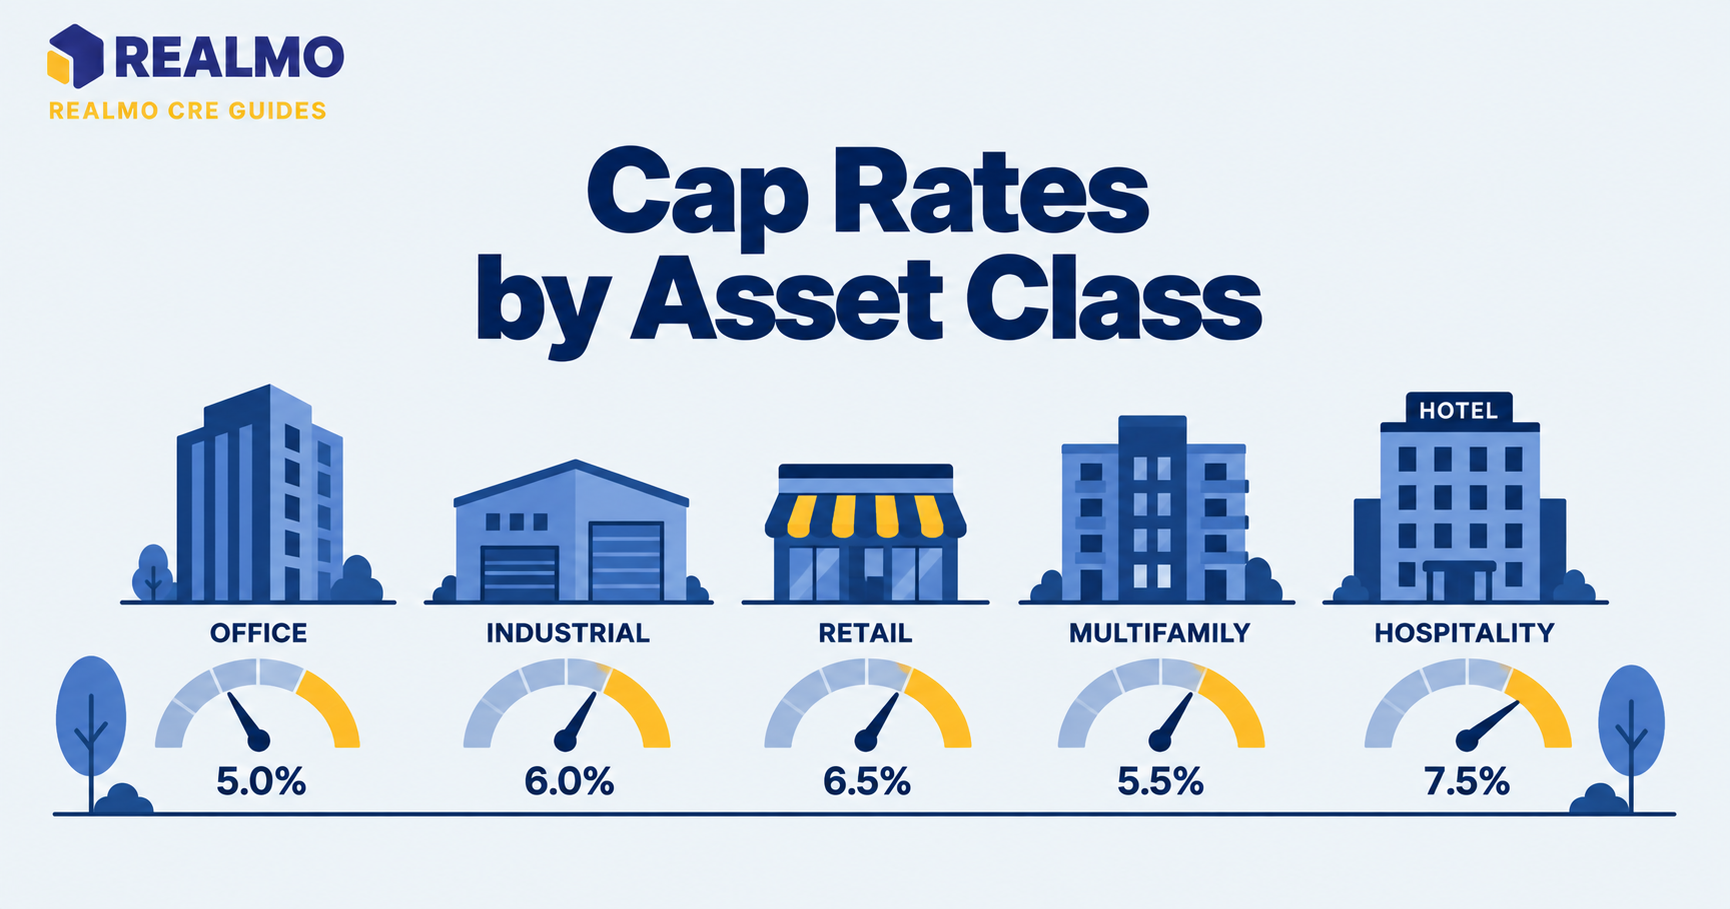
Cap rates by property type vary because each asset class carries a different mix of lease duration, tenant credit, capital expenditure burden, and operational risk. Multifamily and industrial commonly trade at lower cap rates than retail, office, or hotels, since buyers accept lower going-in yield in exchange for more predictable income and easier financing.
Why the Spread Between Asset Classes Matters
An investor comparing two listings priced at identical cap rates is not looking at identical risk. A single-tenant industrial building leased for twelve years to an investment-grade logistics company and a strip center with six local tenants on three-year leases can print the same number on a broker’s flyer. The industrial deal delivers that yield with almost no leasing risk and minimal landlord obligations. The strip center delivers it while the owner absorbs re-tenanting costs, tenant improvement allowances, leasing commissions, and the possibility that a vacancy sits unfilled for two quarters.
That difference is exactly what the cap rate spread is supposed to price. When an investor sees an asset trading well outside the normal band for its type, the first question is not “what a bargain” but “what is the market pricing in that I haven’t found yet.” Understanding where each property type normally sits relative to the others turns a single number into a diagnostic tool.
What Actually Drives the Cap Rate Spread
Five variables explain most of the gap between asset classes.
Lease term. Longer leases push cap rates down. A twenty-year ground lease produces income a buyer can underwrite with near-bond confidence. A hotel effectively re-leases every room every night.
Tenant credit. A lease is only as good as the entity signing it. National investment-grade credit supports lower cap rates than a regional operator, which in turn supports lower rates than a first-time franchisee.
Capital intensity. Some property types consume cash after closing. Office requires tenant improvements and leasing commissions on nearly every rollover. Industrial shells need little beyond roof and parking lot maintenance. Capital that never reaches the owner’s pocket is not really income, and buyers discount for it.
Operational load. Hotels and self-storage are operating businesses attached to real estate. Their revenue depends on daily management execution, not just a signed lease. That business risk shows up as a higher required yield.
Liquidity and lender appetite. Property types that lenders finance readily and buyers compete for trade tighter. Agency financing availability for multifamily is a structural reason that sector prices below most commercial types in the same market.
For the underlying mechanics of the metric itself, see how to calculate cap rate and the difference between going-in and exit cap rates.
Where Each Property Type Sits
The ordering below reflects general industry practice, not any specific market or moment. In any given metro, all of these move together as capital costs shift, but their relative positions are stable enough to underwrite against.
Multifamily trades at the lowest cap rates among major commercial types. Income is diversified across many units, so no single move-out is material. Agency lenders (Fannie Mae, Freddie Mac) provide consistent debt across cycles, which supports pricing even when other sectors lose lender support.
Industrial sits near multifamily, and in some markets below it. Long leases, low landlord capital obligations, and strong tenant credit in the logistics segment explain the compression. The spread widens for smaller, older, or functionally obsolete buildings with low clear heights or poor truck court depth.
Grocery-anchored and necessity retail trades above industrial but below unanchored retail. The anchor’s sales performance and lease term drive the pricing more than the shop space does.
Unanchored and inline retail carries wider cap rates because of tenant turnover, local credit, and co-tenancy exposure.
Office has the widest internal dispersion of any major type. Cap rates for a well-leased medical office building and a partially vacant suburban office tower are not in the same conversation. The capital cost of re-tenanting office space is the central variable.
Hotels trade at the highest cap rates among the core types, because there is no lease at all and revenue reprices nightly. Franchise flag, brand standards, and required property improvement plans are underwriting items, not footnotes.
Self-storage and other operational niches price according to how much of the return depends on management rather than contract.
How Location Changes the Same Property Type
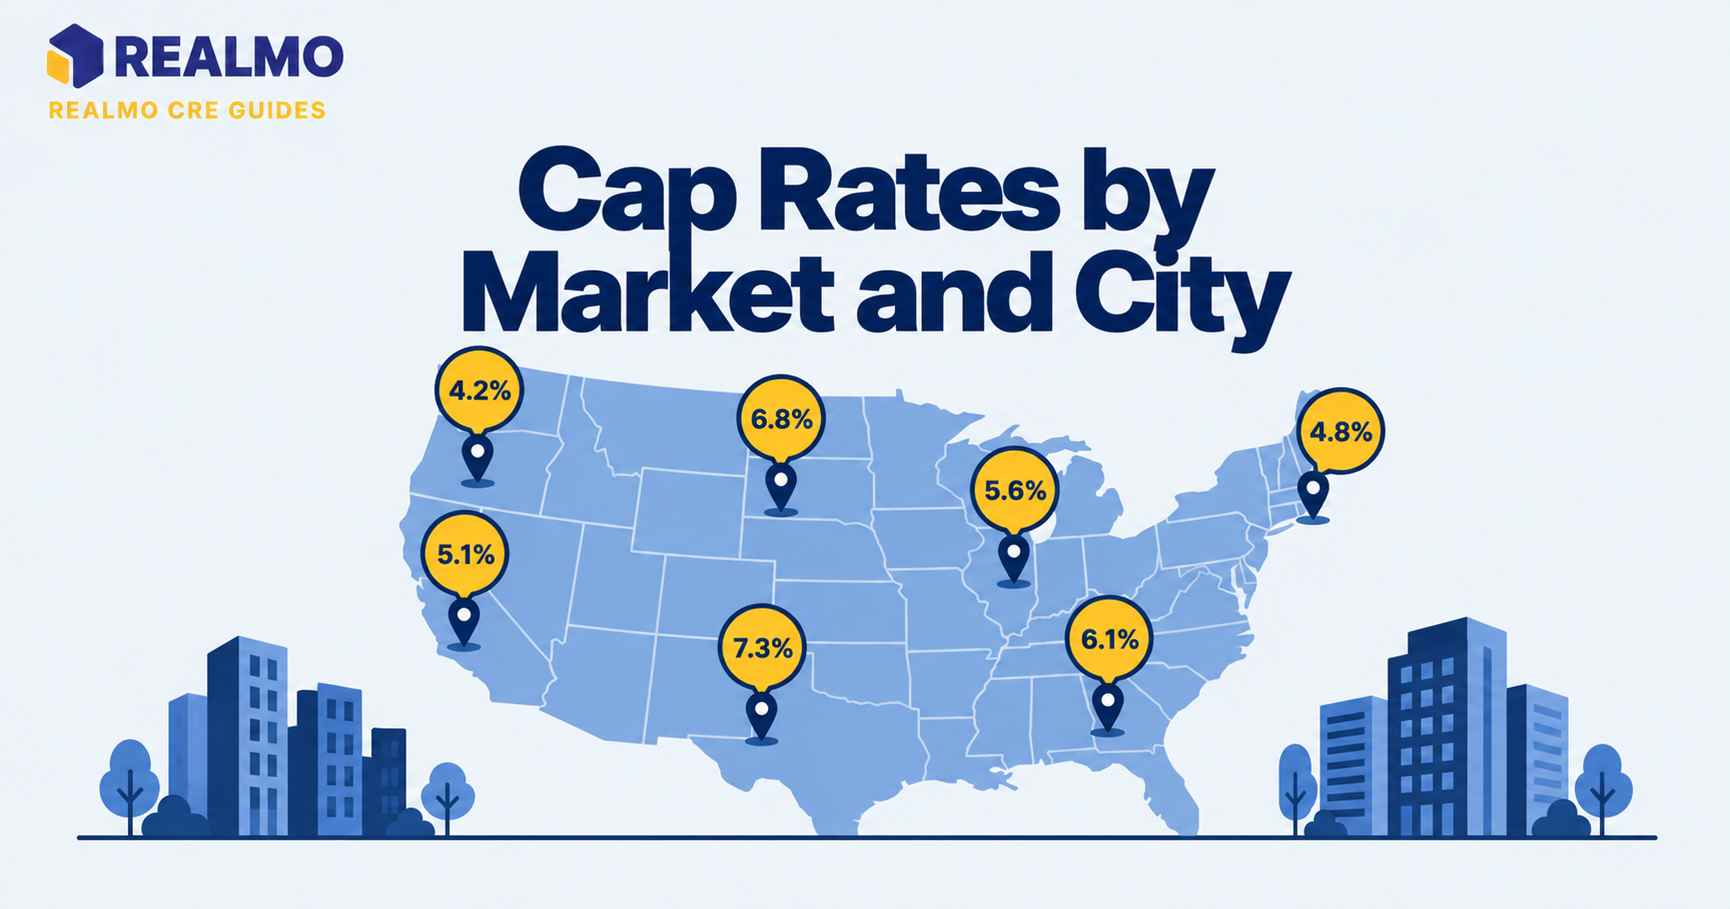
Asset class explains part of the spread; geography explains much of the rest. The same industrial building will price differently in a coastal port market than in a secondary inland market, and the driver is not sentiment but the depth of the tenant pool and the replacement cost of the building.
Three location factors matter most. Population and employment trends determine whether demand is growing or shrinking against a fixed supply. Supply constraints , zoning, land availability, entitlement difficulty , determine whether rent growth can be competed away by new construction. And market liquidity determines how many qualified buyers exist when the owner sells, which affects exit pricing as much as going-in pricing.
Practically, this means an investor should compare cap rates within a property type and within a market before drawing conclusions. A national average for a sector is useful for direction, not for underwriting a specific building. Realmo’s property analytics show cap rate estimates and ownership records for individual assets, which is a more useful comparison set than a sector-wide figure.
How to Read a Cap Rate That Looks Wrong
When a listed cap rate sits far outside the band for its type and market, one of five things is usually happening.
The NOI may be overstated , built on gross potential rent rather than in-place collections, or excluding a management fee, or capitalizing what should be an expense. The lease may be short, so the buyer is really buying a vacancy in eighteen months. The tenant may be paying above-market rent, meaning the income steps down at renewal. The building may need capital the seller has deferred. Or the location may be structurally weak in a way the current lease temporarily masks.
None of these makes a deal bad. All of them make the headline cap rate the wrong number to underwrite from. The reconstruction of NOI is covered in more depth in what counts as net operating income.
Worked Example: Comparing Two Assets at the Same Cap Rate
All figures below are illustrative and rounded for clarity.
Two properties are offered at a 7.0% cap rate on $4,000,000 of value, each showing $280,000 of NOI.
Property A, single-tenant industrial. Twelve years remaining on a triple-net lease to a national distributor with annual 2.5% rent escalations. Landlord obligations: roof and structure. Estimated annual capital reserve: $10,000.
Property B, six-unit inline retail strip. Weighted average lease term of 2.4 years, all local tenants, landlord responsible for common area maintenance recovery shortfalls. Historical turnover: roughly two units per year. Estimated cost per re-tenanting: $25,000 in tenant improvements plus $8,000 in leasing commissions.
Step 1, adjust NOI for real capital load. Property A: $280,000 − $10,000 = $270,000 Property B: $280,000 − (2 × $33,000) = $214,000
Step 2, recalculate the effective cap rate at the same price. Property A: $270,000 ÷ $4,000,000 = 6.75% Property B: $214,000 ÷ $4,000,000 = 5.35%
Step 3, interpret. At an identical asking cap rate, Property B delivers roughly 140 basis points less economic yield once recurring leasing capital is recognized. For Property B to produce the same 6.75% economic return. The price would need to fall to approximately $3,170,000 ($214,000 ÷ 0.0675), a discount of about 21%.
Common mistake in this example: treating tenant improvements and leasing commissions as one-time acquisition costs rather than recurring operating reality. In a multi-tenant asset with short leases, they recur on a schedule as predictable as property taxes.
Common Mistakes When Comparing Cap Rates Across Types
Comparing sector averages to a specific building. A national office cap rate blends trophy towers and half-empty suburban product. Applying it to one asset produces a valuation error large enough to sink a deal.
Ignoring lease rollover schedules. Two retail centers with identical NOI and identical cap rates can have completely different risk if one has 60% of its income expiring within thirty-six months.
Treating a low cap rate as expensive and a high cap rate as cheap. The cap rate is a risk price. A high number means the market has identified a problem the buyer has not.
Underwriting exit cap rate equal to going-in cap rate. Buildings age. A ten-year hold ends with a property that is ten years older and, absent capital investment, further from the top of its market.
Skipping the NOI audit. Every cap rate comparison is only as reliable as the denominator’s integrity. Verify in-place rents, actual expenses, and whether a management fee is included.
Related Terms
Cap rate · Net operating income · Going-in vs. exit cap rate · Triple net lease ·. Weighted average lease term · Tenant improvement allowance · Debt service coverage ratio · Replacement cost
FAQ
Which property type has the lowest cap rates?
Multifamily and industrial trade at the lowest cap rates among major commercial types. Both benefit from stable income, strong lender support, and relatively low recurring capital requirements. In some markets, well-located modern industrial prices below multifamily when logistics tenant demand is especially strong.
Why do hotels have higher cap rates than office buildings?
Hotels have no leases. Revenue reprices every night and depends on daily operating performance, brand standards, and travel demand. Office income is contractually fixed for years at a time, even when re-leasing costs are high. Buyers require more yield to accept business risk instead of contract risk.
Is a higher cap rate always better for an investor?
No. A higher cap rate signals higher perceived risk, not better value. It may reflect short lease terms, weak tenant credit, deferred capital needs, or a declining submarket. The relevant question is whether the yield compensates for the specific risks in that asset.
Do cap rates differ within the same property type?
Substantially. Class, age, location, lease structure, and tenant credit all move pricing within a sector. Office shows the widest internal dispersion, from stabilized medical office to vacancy-exposed commodity space.
How should I compare cap rates across markets?
Compare within property type first, then adjust for market fundamentals, employment growth, supply constraints, and buyer depth. National sector figures indicate direction; they are not substitutes for local comparable sales.