Going-In vs Exit Cap Rate: What the Spread Tells You
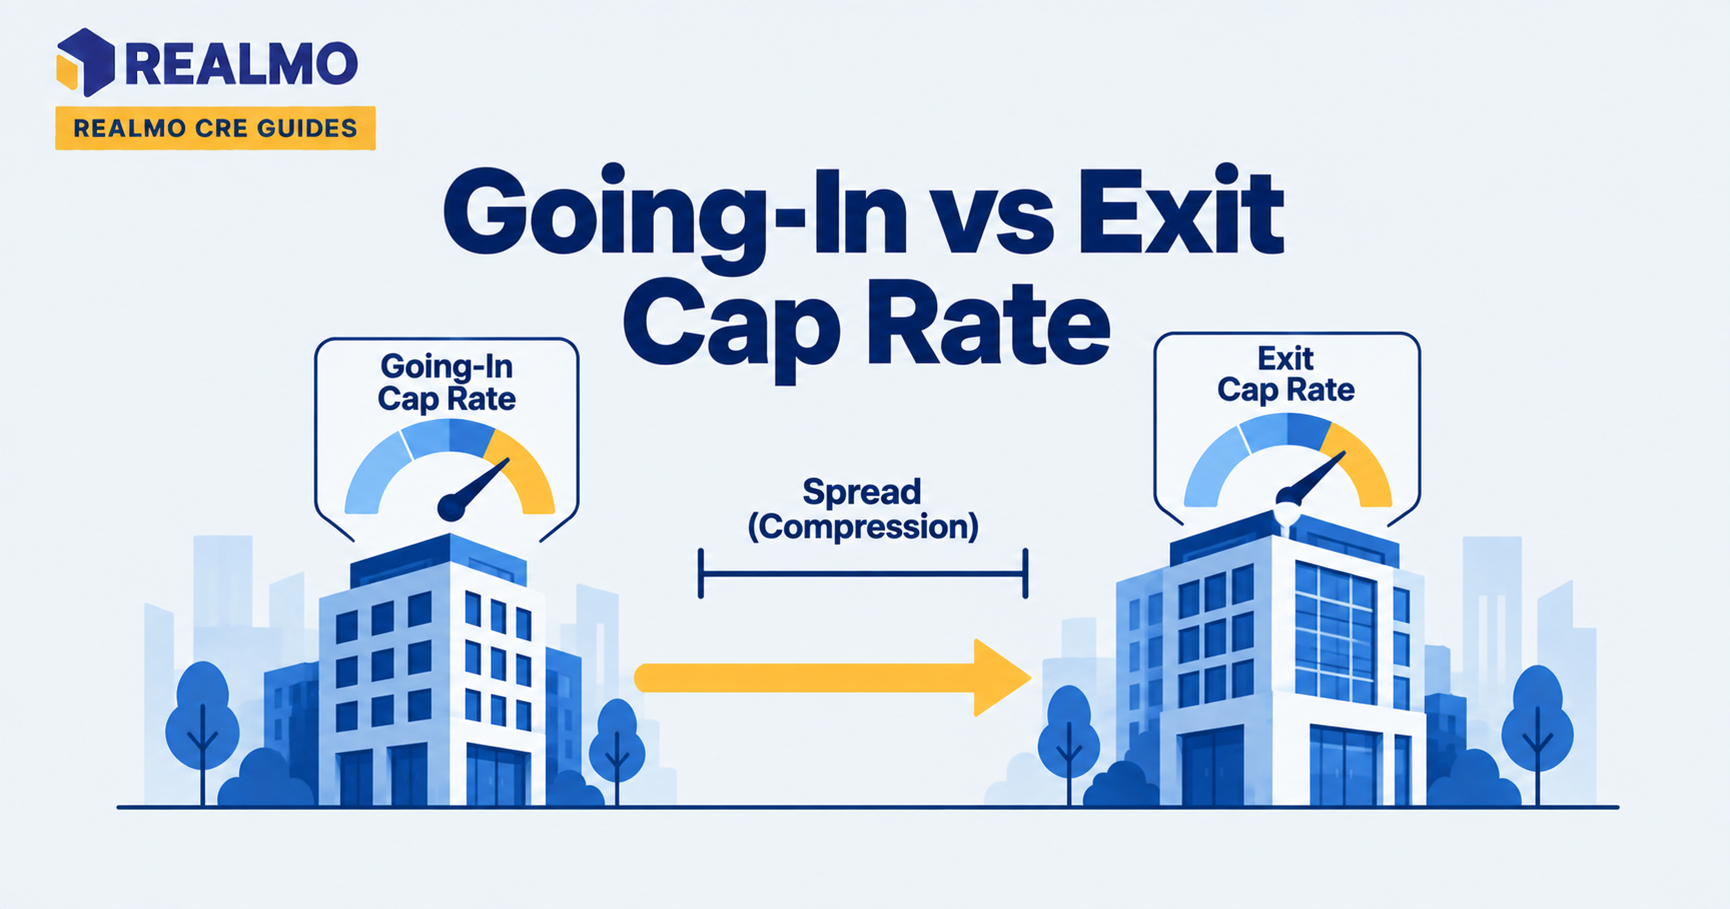
The going-in cap rate is first-year NOI divided by the purchase price. The exit cap rate is projected NOI at sale divided by the assumed sale price at the end of the hold. The going-in figure prices the asset you are buying today; the exit cap rate prices the asset the next buyer inherits.
Why the Spread Between Them Decides Your Return
You underwrite a suburban flex building at a 6.0% going-in cap rate, five-year hold, modest rent growth. The model returns a 15% IRR and you sign the LOI (letter of intent). Two-thirds of that return sits in the reversion , the sale price at year five , and the reversion is nothing more than your terminal NOI divided by a cap rate you chose. Move that exit cap rate 50 basis points and the deal is a 12% IRR. Move it 100 and you are close to breakeven on equity.
Nothing else in the model carries that much weight per keystroke. Rent growth compounds slowly, expense assumptions are bounded by the operating history, and debt terms are contractual. The exit cap rate is a single, unverifiable input applied to the largest cash flow in the deal, and it is the assumption most frequently set by habit rather than analysis.
How the Going-In Cap Rate Prices Today’s Asset
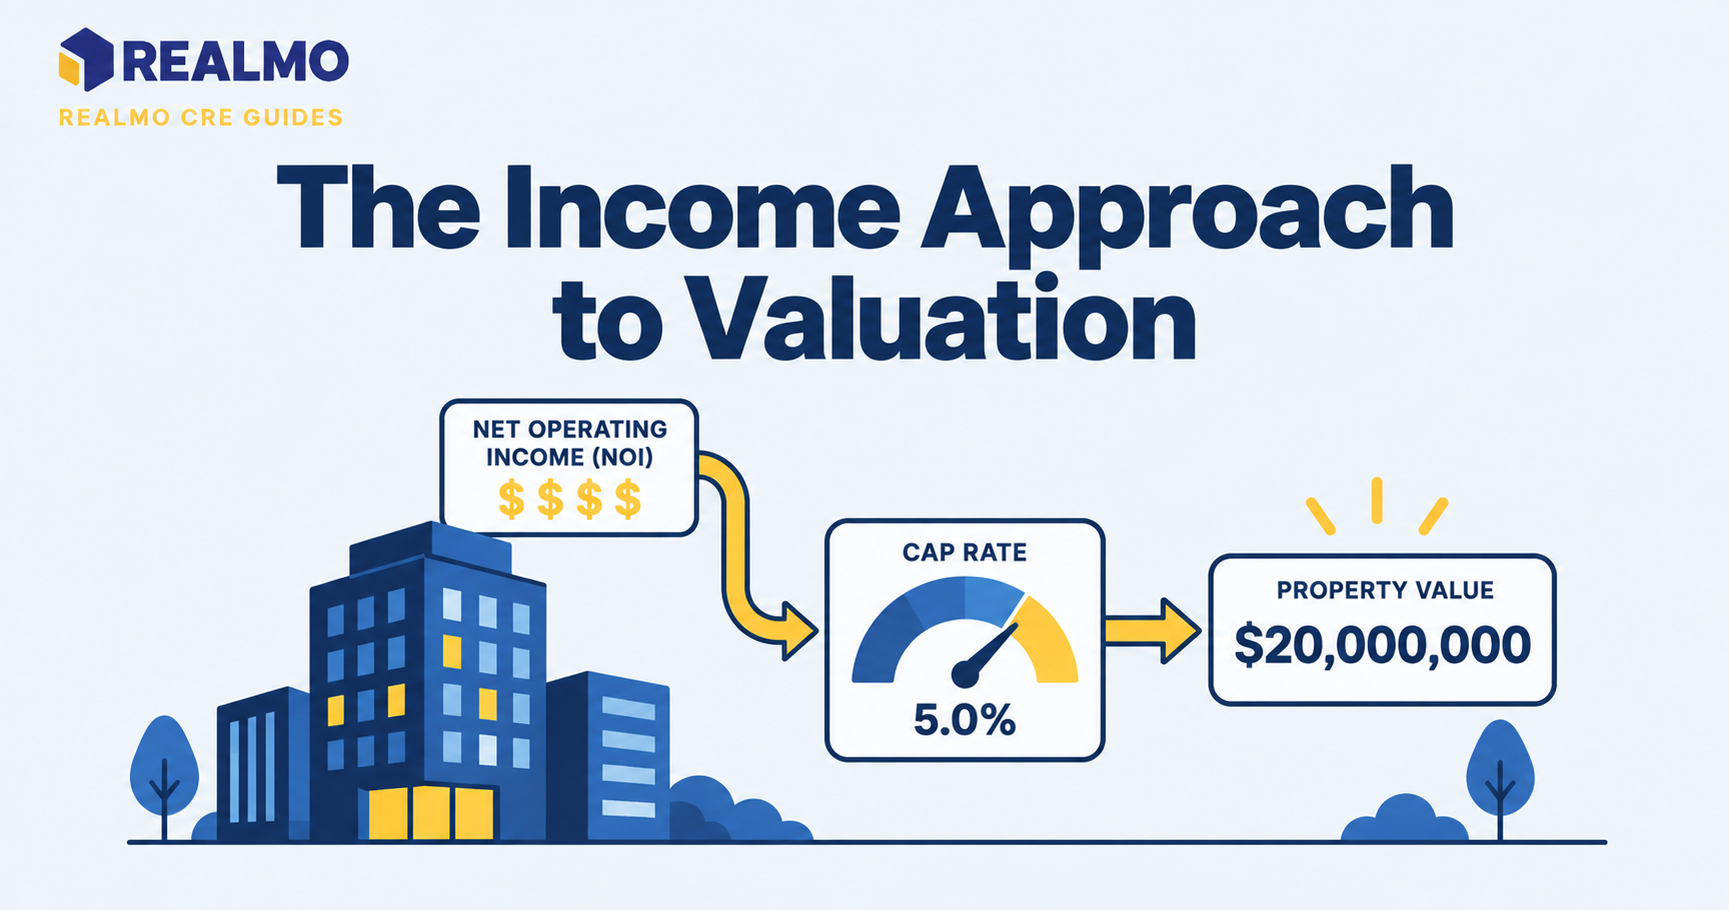
The going-in cap rate, also called the entry or acquisition cap rate, is calculated as Year 1 net operating income ÷ purchase price. It describes the unlevered yield the property produces on day one, before any debt service, capital expenditure, or value-add work.
Its usefulness depends entirely on how the NOI is built. A broker’s offering memorandum may show a pro forma NOI with market rents, no vacancy allowance, and no management fee, producing a headline cap rate the buyer will never actually collect. Underwriting the same building on in-place income with a market vacancy factor and a real replacement reserve can move the cap rate a full point. Compare how to calculate cap rate on a consistent NOI definition before comparing two deals at all.
Going-In vs Exit Cap Rate Calculator
Compare the cap rate you buy at with the cap rate you assume at sale, and see how the spread changes the property’s exit value and equity proceeds.
Acquisition Assumptions
Exit Assumptions
Going-In vs Exit Comparison
| Exit Cap Rate | Spread vs Going-In | Exit Value | Loan Payoff | Equity Proceeds | Value vs Base |
|---|
Disclaimer: This calculator is provided for informational and educational purposes only. The results are estimates based on the assumptions and inputs provided and should not be considered financial, investment, tax, legal, or real estate advice. Actual returns may vary due to changes in property income, financing terms, operating expenses, capital expenditures, taxes, market conditions, transaction costs, and sale proceeds. Users should independently verify all assumptions and consult qualified financial, tax, legal, and real estate professionals before making investment decisions.
What the Exit Cap Rate Assumes About a Future Buyer
The exit cap rate is the yield a hypothetical buyer will demand at your disposition date. It is not a market observation, because that market does not exist yet. It is a judgment about three things: where the asset sits in its physical life, what the tenancy looks like at sale, and what rate environment the next buyer will underwrite in.
The most useful way to hold it: your exit cap rate is a price for the risk you are handing off. If you sell a building with two years of weighted average lease term remaining in a submarket with new supply delivering. The buyer prices that lease rollover into their yield requirement. The exit cap rate is where that pricing shows up.
Why Underwriters Set the Exit Above the Entry
Standard institutional practice is to spread the exit cap rate above the going-in cap rate. Commonly in a 25 to 50 basis point range for a five-year hold, with wider spreads for longer holds or shorter-lived assets. Three arguments support it.
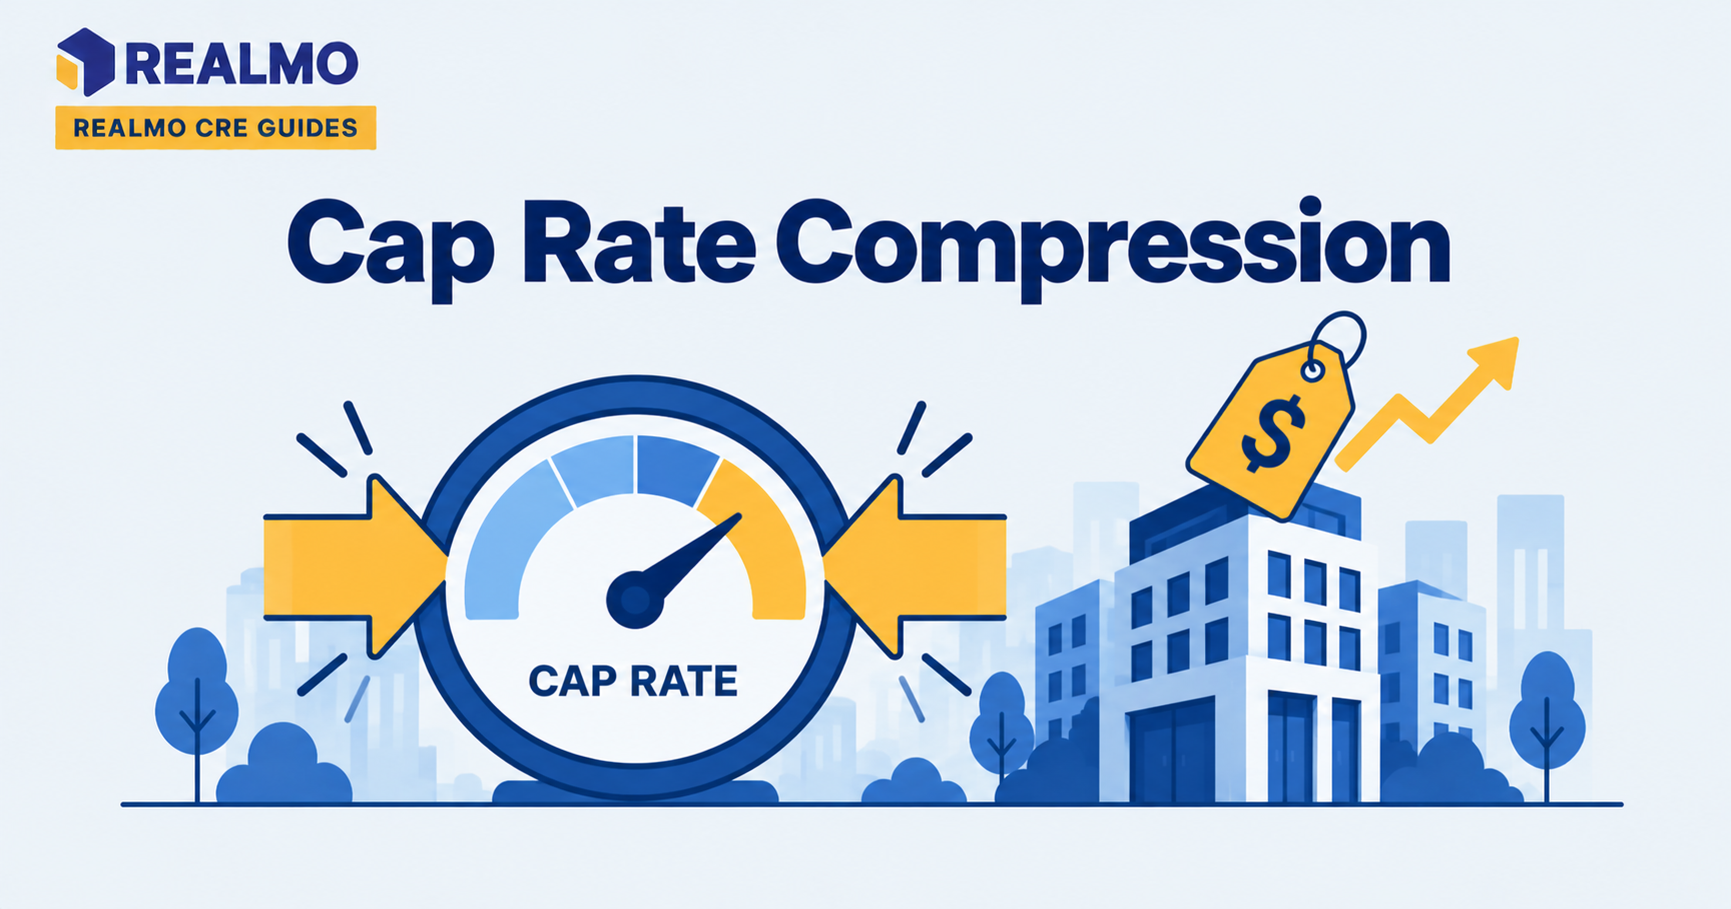
The building is older at sale. A five-year hold means the next buyer is facing a roof, a chiller, or a parking lot five years closer to replacement, and pays for that in yield. Second, the lease structure is usually less attractive at exit than at entry unless you have actively re-tenanted , a fifteen-year net lease sold at year five is a ten-year lease. Third, an exit cap equal to or below the going-in cap embeds a forecast of cap rate compression, which means part of your projected return comes from the market repricing rather than from anything you did to the asset.
Not everyone agrees this should be mechanical. Value-add sponsors argue that a stabilized asset genuinely deserves a lower cap rate than the distressed one they bought, and a flat or tighter exit can be defensible when the exit and entry describe different products , a 60% leased building sold at 95% leased is not the same asset. The distinction worth holding onto: repricing the property because you changed it is underwriting, while repricing it because you expect the market to be friendlier is speculation. Institutional commercial real estate underwriting standards in prevailing market practice require the second to be disclosed and stress-tested.
How a 50 Basis Point Shift Moves Equity Proceeds
Illustrative figures, rounded for clarity.
You buy at $10,000,000 with Year 1 NOI of $600,000, a 6.0% going-in cap rate. You finance with a $6,000,000 interest-only loan and $4,000,000 of equity. Over a five-year hold, NOI grows to $700,000.
At a flat 6.0% exit cap, the sale price is $700,000 ÷ 0.060 = $11,666,667. At 6.5%, it is $700,000 ÷ 0.065 = $10,769,231. At 5.5%, it is $12,727,273.
The 50 basis point spread costs $897,436 of gross value , about 9% of the purchase price. Against $4,000,000 of equity, after repaying the $6,000,000 loan, net sale proceeds fall from $5,666,667 to $4,769,231. That is a 16% reduction in equity proceeds from a half-point assumption, and the debt is what magnifies it.
Interpretation: the percentage change in value from a cap rate shift is roughly the shift divided by the exit cap rate. Then amplified by your leverage ratio at the equity level. The higher the loan-to-value and the lower the cap rate, the more violent the swing. The common error here is testing the exit cap rate in isolation while holding terminal NOI flat. Cap rate expansion and NOI softness usually arrive together, so the honest downside case moves both.
How Lenders and LPs Test Your Exit Assumption
Expect the assumption to be challenged directly. Credit committees commonly run a sensitivity grid across exit cap rates and terminal NOI, and look for the combination at which equity is impaired. LP (limited partner) investment committees ask a narrower question: what does the deal return if the exit cap equals the going-in cap plus 50, and what does it return at the highest cap rate observed for this asset class in this market during the last downturn.
Prepare the defense before you are asked. Support the exit with the actual sale comparables you can pull for similar vintage and tenancy, note where your asset sits relative to those trades, and show the sensitivity analysis rather than a single number. Ownership and transaction records on Realmo let you check what comparable buildings in the submarket actually traded at and who currently holds them, which is a firmer starting point than a spread applied by convention.
Common Mistakes With Exit Cap Rate Assumptions
- Setting the exit equal to the going-in by default. The model quietly assumes a five-years-older building sells at today’s pricing, and the return you show investors includes a market call you never disclosed.
- Spreading the exit but leaving terminal NOI aggressive. Padding the cap rate while projecting uninterrupted rent growth and full occupancy at sale cancels out the conservatism you claimed to add.
- Applying one spread convention across asset types. A short-lived, single-tenant asset with a lease expiring near your sale date needs a wider spread than a multi-tenant building with staggered rollover.
- Pricing the exit off the pro forma cap rate. If your going-in cap came from an inflated pro forma NOI, every spread built on it inherits the error and the deal looks cheap when it is not.
- Ignoring the interaction with debt maturity. A forced sale at loan maturity removes your ability to wait out a soft bid environment. This means the downside exit cap rate becomes the realistic one.
Related terms
Cap rate · Net operating income (NOI) · Reversion value · Internal rate of return (IRR) · Terminal value · Discounted cash flow analysis · Cash-on-cash return
FAQ
Should the exit cap rate always be higher than the going-in cap rate?
Not always, but the burden of proof runs the other way. A higher exit is the conservative default because the asset ages and leases shorten during the hold. A flat or lower exit needs a specific justification tied to what you changed, stabilized occupancy. Extended lease term, improved tenant credit, not to an expectation that pricing improves.
How much should I spread the exit cap rate above the entry?
Institutional models commonly apply 25 to 50 basis points over a five-year hold, scaling wider for longer holds, older buildings, and short remaining lease term. Treat the convention as a starting point and adjust for the specific rollover and capital needs the next buyer will face at your sale date.
Does the exit cap rate affect IRR more than rent growth?
Usually yes, on holds of three to seven years. The reversion is the single largest cash flow in the model. So the divisor applied to terminal NOI carries more weight than incremental rent assumptions. Sensitivity tables show IRR moving further per basis point of exit cap than per point of annual rent growth.
What terminal NOI should I use with the exit cap rate?
Convention is the forward-looking NOI for the twelve months after the sale date, since that is what a buyer would capitalize. Using trailing NOI instead understates the reversion. Whichever you choose, apply it consistently, and confirm which basis your comparable sale cap rates were calculated on before benchmarking.