Cap Rate in Commercial Real Estate: A Complete Guide
The capitalization rate, or cap rate, is a property’s net operating income divided by its price or market value, expressed as a percentage. It measures the unlevered annual return a commercial property produces at a given price. This makes it the standard shorthand for comparing income-producing assets across buildings, markets, and property types.
Everything else in this guide follows from that one ratio. How to build the numerator honestly, why the same building trades at different cap rates in different cities, and where the metric stops being useful.
Why cap rate decides what a building is worth
An investor with roughly $1.5 million of equity is looking at two listings in the same metro: a single-tenant flex building leased to a regional distributor with eight years remaining, and a multi-tenant retail strip with five tenants on short leases and one vacancy. Both are asking similar prices. Both generate similar income today.
The cap rate is where the difference shows up. The flex building will price at a lower cap rate because its income is more predictable. This means the buyer pays more per dollar of income. The strip center prices higher because the buyer is absorbing rollover risk, leasing costs, and a vacancy they have to fill.
That same ratio then decides three other things: what a lender believes the collateral is worth, what the property will sell for in five years, and how much value gets created by every dollar of net operating income added through better leasing or expense control. Misjudge the cap rate and every downstream number in the model is wrong.
How to calculate cap rate step by step
The formula is short:
Cap Rate = Net Operating Income ÷ Property Value
Net operating income is the property’s annual income after operating expenses but before debt service, income taxes, depreciation, and capital expenditures. Property value is either the purchase price under contract or an estimated market value for a property you already own.
Three decisions determine whether the output means anything.
Which NOI. Trailing twelve months, forward twelve months, and stabilized NOI produce three different cap rates on the same building. Brokers usually market the most flattering version. Underwrite all three and know which one you are quoting.
Which value. Purchase price is a fact; market value is an opinion. A cap rate calculated on the asking price tells you what the seller wants, not what the asset is worth.
Whose expense assumptions. A seller who self-manages and carries no reserve will show a higher NOI than a buyer who budgets third-party management and replacement reserves. The gap between those two NOIs, divided by the cap rate, is real money.
Cap rate also inverts into a valuation tool. Rearranged, Value = NOI ÷ Cap Rate. This is direct capitalization, and it is how most stabilized income property gets priced. The inverse relationship matters: cap rates and values move in opposite directions. When cap rates rise, values fall even if income is flat.
What belongs in NOI and what never does
The denominator is usually straightforward. The numerator is where deals get mispriced.
Start with gross potential rent. Subtract vacancy and credit loss to reach effective gross income. Add parking, storage, expense reimbursements, and other income supported by the property. Then subtract operating expenses.
Four items never belong in NOI. Debt service is excluded because cap rate is unlevered and should not depend on a buyer’s financing. Income taxes depend on the owner’s entity structure and basis. Depreciation is an accounting entry, not a cash expense. Capital expenditures, including roof or parking lot replacement, also sit outside NOI.
Three items have no industry consensus, and you should know both positions.
Replacement reserves. Institutional underwriting deducts an annual reserve per square foot or unit. The reserve reflects recurring capital needs. Private sellers and smaller brokers can exclude reserves, treating them as capital rather than operating cost. Both approaches exist. Apply the same convention to the property and comparable sales, because a reserve deduction lowers NOI and the reported cap rate.
Management fee. An owner-operator who manages the building personally may report no management expense. Institutional buyers underwrite a market-rate fee regardless, because the next owner will have to pay one. Excluding it inflates NOI.
Tenant improvements and leasing commissions. These are usually treated as capital items below the NOI line, but in properties with short leases and constant rollover they are a recurring cost of doing business. Analysts who exclude them entirely tend to overvalue multi-tenant assets with high turnover.
The related metric worth tracking alongside is the operating expense ratio, which shows what share of effective gross income the property consumes before debt. An expense ratio far below market for the property type is usually a sign that something has been left out of the seller’s numbers.
What pushes cap rates up or down in a market
Cap rate is a price for risk. Anything that makes future income less certain pushes the cap rate up and the price down.
Lease duration and tenant credit. A twenty-year lease to an investment-grade credit tenant produces bond-like income and trades near the low end of the range. A building full of local tenants on one-year leases trades well above it. This is because the buyer is underwriting the leasing effort, not just the rent roll.
Property type. Industrial cap rates sit below retail in the same market. This is because leases run longer, tenant credit tends to be stronger, and the physical box is easier to re-tenant. Hospitality trades at the widest cap rates of the major food groups, because revenue reprices nightly and operating leverage is severe. These are relationships, not fixed numbers, and the ordering can invert when a sector falls out of favor.
Market depth and location. A larger, more liquid market with more buyers and more lenders supports lower cap rates than a secondary or tertiary market with the same asset. Within a metro, the same spread appears between core submarkets and outlying ones.
The cost of capital. Cap rates do not track the 10-year Treasury mechanically, but they are anchored to it over time. When the risk-free rate and borrowing costs rise, buyers require a wider spread over their debt cost, and cap rates tend to follow with a lag. The lag is why cap rates and interest rates can move apart for several quarters before reconnecting. Historical Treasury and rate data are published by the Federal Reserve through the FRED database if you want to study the relationship yourself.
Growth expectations. A market where rents are expected to grow faster justifies a lower going-in cap rate, because the buyer is paying today for tomorrow’s income. This is the single largest source of disagreement between buyers and sellers in negotiation.
Physical and functional condition. Clear height, column spacing, floor plate depth, power capacity, and deferred maintenance all show up in the cap rate. A building that cannot serve modern tenant requirements carries functional obsolescence, and the market prices that as risk.
Finding credible comparable cap rates is the practical bottleneck for most investors, particularly outside their home market. Public records, broker relationships, and platforms that publish property-level analytics all help; Realmo makes cap rate estimates, ownership records, and location insights available across its property database without a paywall, which is useful when you are underwriting a market where you have no broker relationship yet.
Going-in, exit, and stabilized cap rates
Three variants appear in almost every offering memorandum, and conflating them is a common source of modeling error.
Going-in cap rate uses the first year’s projected NOI over the purchase price. It answers the question: what unlevered yield am I buying on day one?
Stabilized cap rate uses NOI after the business plan is complete: vacancy leased up, below-market rents rolled to market, expenses normalized. On a value-add deal the stabilized cap rate is materially higher than the going-in cap rate, and the spread between them is the return the sponsor is being paid to create.
Exit cap rate, sometimes called the terminal or reversion cap rate, is the assumed cap rate at sale, applied to the year-of-sale NOI to estimate resale price. This is the most consequential assumption in a discounted cash flow model and the easiest to abuse. Conservative underwriting expands the exit cap rate above the going-in rate to account for the building being older at sale and for the possibility that capital markets are less friendly. An exit cap rate tighter than the going-in rate is a bet that the market will be stronger at sale than at purchase, and it should be labeled as such rather than buried in an assumptions tab.
Yield on cost applies related math to development or heavy value-add projects. Divide stabilized NOI by total project cost rather than purchase price. The spread to the finished property’s market cap rate is the development margin.
Cap rate vs. cash-on-cash, IRR, and yield on cost
Cap rate answers one question well and several questions badly.
Cash-on-cash return divides annual pre-tax cash flow after debt service by the equity invested. It reflects financing, which cap rate deliberately ignores. Two buyers purchasing the same building at the same cap rate will report different cash-on-cash returns if their loan terms differ. Use cap rate to compare assets; use cash-on-cash to compare what the deal does for your equity.
Internal rate of return accounts for the full holding period, including rent growth, capital spending, refinancing, and sale proceeds, and it weights cash flows by when they arrive. Cap rate is a snapshot at a single moment and says nothing about the path. A deal can have an attractive going-in cap rate and a poor IRR if income declines, and a low going-in cap rate with a strong IRR if income grows sharply.
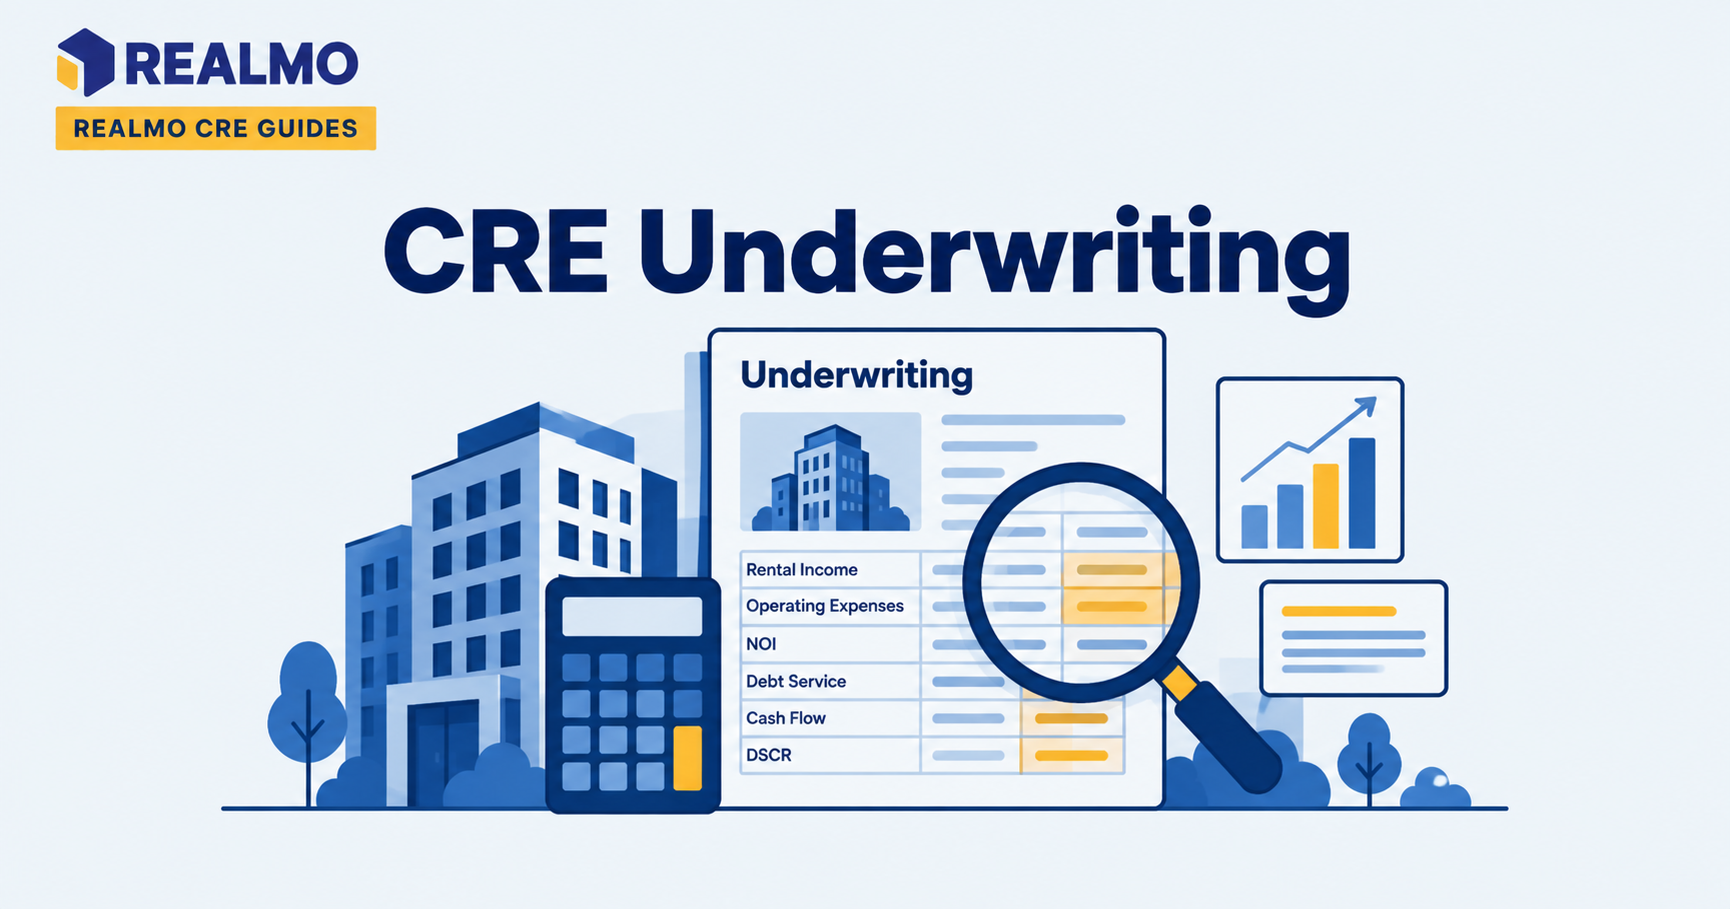
Debt service coverage ratio is the lender’s version of the same NOI, measured against the loan payment rather than the price. A property can clear your target cap rate and still fail to size to the loan you assumed. This kills more deals in the last two weeks of due diligence than most first-time buyers expect.
Gross rent multiplier skips operating expenses entirely and divides price by gross rent. It is faster and cruder, useful for a first screen on similar properties in the same market, and misleading anywhere expense structures vary, such as between a triple net lease asset and a gross-leased one.
Use cap rate first to screen and price the asset. Then use DSCR to confirm the debt works. Cash-on-cash tests current-year equity yield. IRR evaluates the full hold.
Worked example: pricing a small industrial asset
All figures below are illustrative and rounded for clarity. They are not market data.
Step 1, Build effective gross income. A 25,000-square-foot industrial building is fully leased at $16.00 per square foot, producing gross potential rent of $400,000. Apply a 5% vacancy and credit loss allowance, or $20,000, for effective gross income of $380,000.
Step 2, Subtract operating expenses. The property operates on modified gross leases. Landlord-paid expenses total $95,000: property taxes, insurance, common area maintenance, a 3% management fee, and repairs.
Step 3, Calculate NOI. $380,000 − $95,000 = $305,000.
Step 4, Apply the purchase price. The building is under contract at $4,000,000.
Step 5, Calculate the cap rate. $305,000 ÷ $4,000,000 = 7.6%.
Step 6 , Test against the market. If comparable industrial buildings in the submarket have traded around a 7.0% cap rate, direct capitalization implies a value of $305,000 ÷ 0.070 = $4,357,000, suggesting the contract price is below the implied market value. If comparables sit at 8.0%, implied value is $3,813,000 and the buyer is paying above market.
How to interpret it. The 60-basis-point difference between a 7.6% and a 7.0% cap rate on this asset is roughly $357,000 of value. This is nearly 9% of the purchase price. Small movements in the cap rate overwhelm large movements in operating detail, which is why the comparable analysis deserves more time than the expense schedule.
Sensitivity to NOI. Suppose the buyer signs a new lease that raises NOI by $20,000. At a 7.0% cap rate, that adds $20,000 ÷ 0.070 = $286,000 of value on a $4 million asset. This is the value-add arithmetic in a single line: capitalized income creates value at a multiple of the income itself.
The mistake to avoid here. If the seller’s $95,000 expense figure excludes a management fee because the owner self-manages, and the buyer will pay a third-party manager roughly 3% of EGI, real NOI is closer to $293,600. At a 7.0% cap rate, that single omission overstates value by about $163,000. Rebuild the expense schedule from the buyer’s operating reality, not the seller’s.
Common cap rate mistakes that cost real money
- Quoting a cap rate on pro forma NOI as though it were current. A stabilized cap rate presented as going-in makes a value-add deal look like a stabilized one, and the buyer ends up funding the lease-up they thought they were buying past.
- Comparing cap rates across markets or property types without adjusting for risk. A 9% cap rate in a shrinking tertiary market is not a better deal than a 6.5% cap rate in a deep one. It is a different risk, and the spread is the market pricing that difference.
- A triple net asset and a gross-leased asset do not carry the same expense responsibility. Normalize that difference before comparing cap rates. Otherwise the landlord cost bases are not comparable.
- Assuming an exit cap rate equal to or tighter than the going-in rate. This quietly imports market appreciation into the return, and a modest expansion at exit can erase most of a projected profit on a leveraged deal.
- Treating cap rate as a return you receive. Cap rate is an unlevered yield on the asset at a moment in time. It is not cash in your pocket, it does not account for debt service or capital spending, and it does not compound.
- Using national average cap rates to price a specific building. Averages blend property types, vintages, and markets. The relevant comparison set is buildings that a buyer would genuinely trade against yours.
Cap rate analysis touches depreciation schedules, entity structure, and tax basis downstream. Consult a licensed CPA or tax attorney before making decisions that depend on those items.
Related terms
- Net operating income (NOI)
- Cash-on-cash return
- Internal rate of return (IRR)
- Debt service coverage ratio (DSCR)
- Gross rent multiplier
- Operating expense ratio
- Triple net lease (NNN)
- Loan-to-value ratio (LTV)
Frequently asked questions about cap rates
What is a good cap rate for commercial real estate?
There is no universal “good” cap rate. Compare the subject rate with recent trades for buildings that match lease term, tenant credit, location, and property type. A wide spread needs an identified reason before you bid.
Is a higher cap rate better?
A higher cap rate means a lower price per dollar of income. It also signals that the market sees more risk. Buy that spread only when you can identify the priced risk and support a different view with specific evidence.
Does cap rate include mortgage payments?
No. Cap rate is deliberately unlevered, so debt service is excluded from net operating income. This is what allows two buyers with different loan terms to compare the same asset on identical footing. To measure returns after financing, use cash-on-cash return or internal rate of return instead.
How do interest rates affect cap rates?
Rising borrowing costs can push cap rates upward when buyers demand a wider spread over debt costs. The move is not mechanical. Cap rates can lag benchmark rates for several quarters while sellers resist repricing. Federal Reserve and FRED data provide the benchmark-rate series used for this comparison.
What is the difference between cap rate and ROI?
Cap rate measures unlevered annual income against price at a single point in time. Return on investment is a broader term that usually incorporates financing, appreciation, and the full holding period. Cap rate is a pricing and comparison tool; ROI and IRR measure what the investment actually earned an individual investor.