How the Commercial Real Estate Market Cycle Works
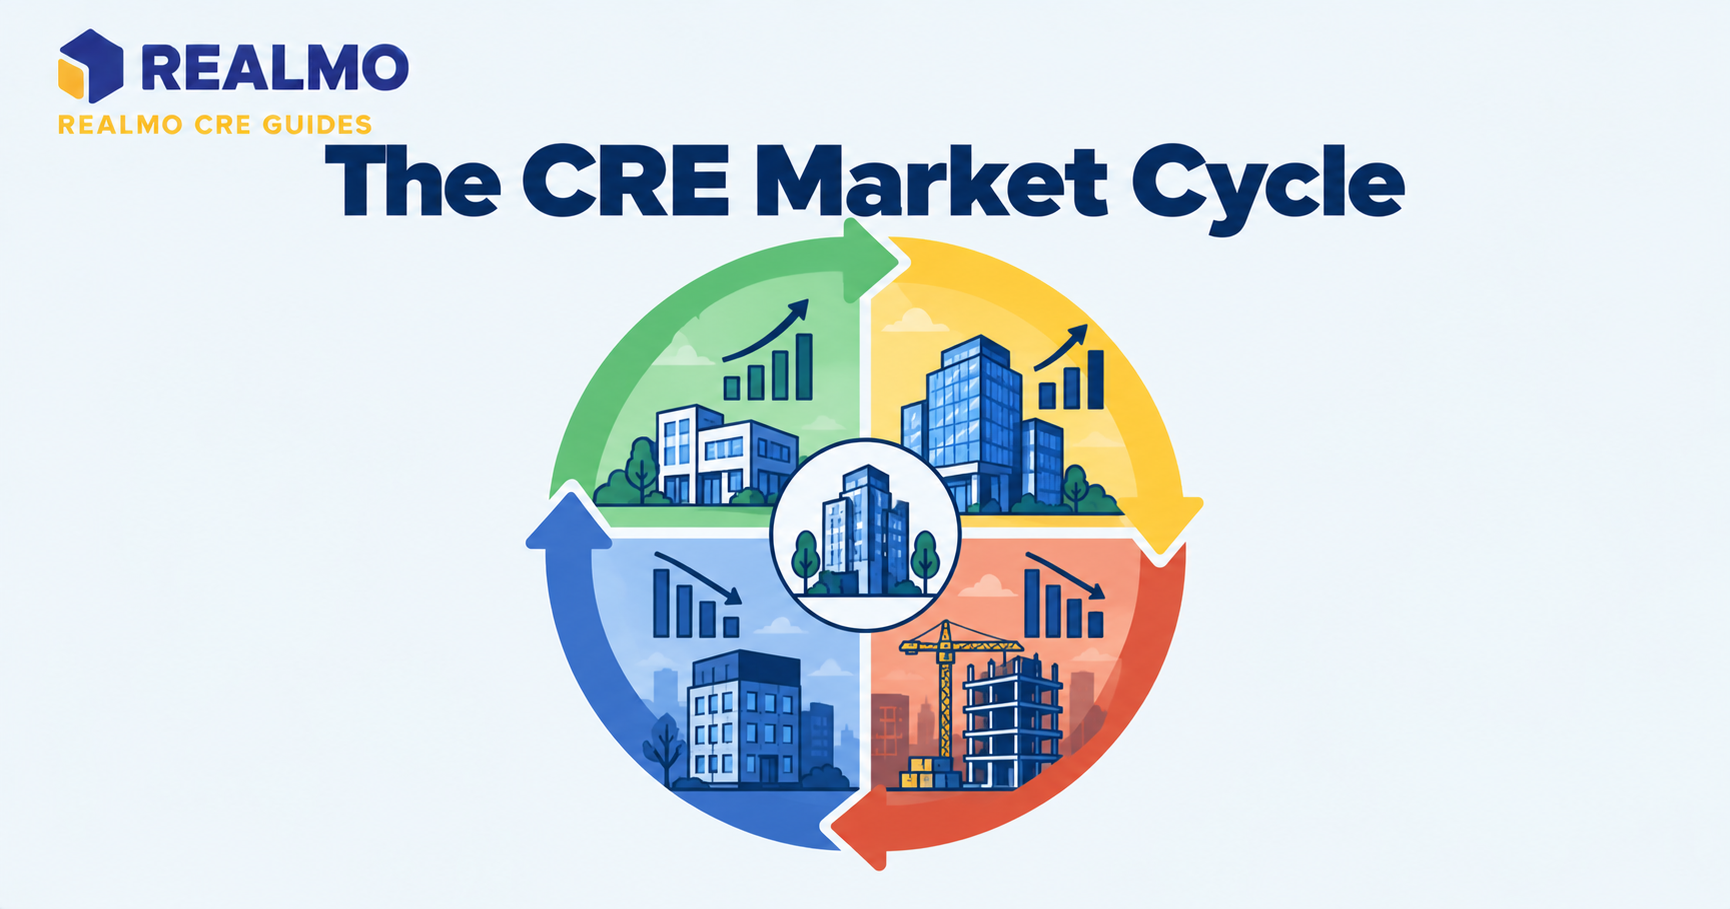
A real estate market cycle is the recurring movement of occupancy, rent, construction, and pricing through four phases: recovery, expansion, hypersupply, and recession. It repeats because buildings take years to deliver while demand shifts in months. New supply routinely arrives after the demand that justified it has already changed.
Why cycle position changes your underwriting
Two investors can buy the same suburban office building at the same price and produce opposite outcomes. One bought when vacancy was falling toward its long-run average. The other bought when three competing projects were topping out two blocks away.
The first investor signs renewals at rising rents and refinances into a larger loan. The second offers free rent and higher tenant improvement allowances to hold occupancy, then watches net operating income fall short of the pro forma. The refinance comes up short at maturity.
Nothing separated them except cycle position, which is knowable before closing and is not a forecast. You are not predicting the next turn. You are reading where the submarket sits today on occupancy, rent direction, and construction pipeline, then underwriting to match.
The four phases of a real estate market cycle
Recovery starts at the bottom of occupancy. Demand returns, vacant space absorbs, and rents stay flat because landlords are still competing for the tenants that exist. Almost nothing new is under construction, since lenders are still repairing balance sheets. Basis is lowest here and conviction is hardest.
Expansion begins once occupancy passes the submarket’s long-run average. Rent growth accelerates, concessions shrink, and construction restarts. Both physical fundamentals and capital availability improve at once, which is why values move fastest in this phase.
Hypersupply starts when completions outrun net absorption. Occupancy is still high and headlines are still good, but the direction has flipped. Rent growth decelerates before it turns negative, so the phase is usually identified in hindsight.
Recession arrives when vacancy exceeds the long-run average and pricing power moves to tenants. Deliveries continue anyway, because projects financed two years earlier cannot stop. Distress surfaces at loan maturities rather than at the moment values fall.
The phases are sequential in structure, not in duration. A market can spend years in expansion and months in recession, or stall in recovery for a decade after a demand shock.
Why supply reacts late and overshoots demand
Commercial development has a long lag between the decision to build and the delivery of space. Entitlement, design, financing, and construction can consume several years, and the rent assumptions that justified the project were set at the beginning of that period.
Every developer sees the same rent growth and the same low vacancy at the same time. Each underwrites a project that works if it is the only one delivering. Collectively they deliver into the same quarter.
Nothing corrects this quickly. A project that becomes uneconomic mid-construction still finishes, because a half-built asset produces no income and the lender’s best outcome is completion. Supply cannot be recalled the way an order book can.
This is why the construction pipeline is the most useful forward indicator available to an investor. It is publicly observable, and it tells you what the competitive set will look like when your business plan is halfway done.
How interest rates and credit move values separately
There are two cycles running at once, and they do not have to agree. The physical cycle governs occupancy and rent. The capital cycle governs the price paid per dollar of income and the debt available to pay it.
Values can fall while fundamentals improve, if debt gets more expensive faster than NOI grows. Values can rise while fundamentals weaken, if capital floods in ahead of the data. Underwriting only one cycle explains why deals that looked conservative on rent still lost money.
Debt drives the capital side more than equity does. When credit tightens, lenders lower proceeds by raising debt service coverage ratio requirements and cutting loan-to-value. That reduces what leveraged buyers can pay, regardless of how the property performs. Refinancing risk concentrates at maturity, which is why loan maturity schedules matter as much as lease expiration schedules.
Why property types and metros cycle at different speeds
Lease duration sets how quickly a property type feels the cycle. Hotels reprice nightly and turn first. Apartments reprice annually. Industrial and retail run multi-year leases. Single-tenant net lease assets with long terms and credit tenants may not reflect the physical cycle at all during a holding period. Instead, they track the capital cycle almost entirely.
That difference shows up in pricing. Industrial cap rates usually sit below retail in the same market, because leases run longer and tenant credit is stronger. The buyer accepts less current yield for more certainty. The gap widens when investors fear the cycle and narrows when they chase yield.
Geography matters just as much. Barriers to entry, whether physical or regulatory, slow the supply response and dampen the hypersupply phase. Markets where land is available and approvals are fast recover faster and overbuild harder. A national headline about a property type tells you little about a specific submarket’s position.
Which indicators tell you where the cycle stands
Compare current occupancy to the submarket’s long-run average rather than to last year, since the average is what rent growth is measured against. Occupancy above average with falling construction is expansion; above average with rising completions is hypersupply.
Watch net absorption against deliveries over the trailing four quarters. Watch rent growth in the second derivative: deceleration is the signal, not decline. Watch concessions, because effective rent falls before face rent does and vacancy rate data alone will miss it.
On the capital side, track the spread between cap rates and long-term Treasury yields rather than cap rates in isolation. Track lender behavior on proceeds and structure too. Platforms such as Realmo make the property-level side of this easier. Ownership records, current and suggested use, and valuation estimates across a submarket show you the competitive set and recent trades, without stitching together separate sources.
Worked example: NOI growth vs. cap rate expansion
All figures below are illustrative round numbers, not market data.
An investor buys a property producing $1,000,000 of NOI at a 6.0% going-in cap rate, using the standard relationship: Value = NOI ÷ Cap Rate. Purchase price is $16,666,667, financed with a $10,000,000 loan and $6,666,667 of equity.
The business plan works. Over five years, NOI grows 15% to $1,150,000. But the buyer at exit prices the asset at a 7.0% cap rate, because credit is tighter than it was at acquisition. Exit value is $1,150,000 ÷ 0.07 = $16,428,571.
Fifteen percent NOI growth produced a small decline in value. The reason is arithmetic. Value change tracks NOI growth divided by cap rate change, so a 100-basis-point expansion off a 6.0% basis is roughly a 14% headwind. On equity, the loss is amplified. With the loan unchanged, equity value falls from $6,666,667 to $6,428,571, a decline of about 3.6% before any principal paydown or cash flow.
Interpret this as a sensitivity test, not a prediction. The useful output is knowing how much NOI growth your plan needs simply to hold value flat against a given cap rate move.
The frequent error is setting the exit cap rate equal to the going-in cap rate. That assumes the capital cycle stands still for the entire hold, which it has never done.
Common mistakes investors make reading the cycle
- Treating national data as local. Property type and metro cycles diverge, so a national vacancy figure can be improving while your submarket absorbs four new deliveries. The result is a business plan built on the wrong competitive set.
- Confusing high occupancy with a strong position. Occupancy peaks in hypersupply, right before pricing power shifts. Buying at the peak means underwriting rent growth that is already decelerating.
- Ignoring the construction pipeline because current fundamentals look good. Permitted projects deliver whether or not conditions hold, and they compete with you during the exact years your plan requires rent growth.
- Matching a short loan term to a long business plan. A three-year loan on a five-year value-add plan forces a refinance at a moment you do not control. That converts a fundamentals problem into a liquidity problem.
- Assuming the cycle sets timing. Phases vary in length, so treating “we are late-cycle” as a deadline produces rushed acquisitions and premature sales rather than better underwriting.
Related terms
Cap Rate · Net Operating Income (NOI) Cap Rate · Net Operating Income (NOI) Net Absorption · Vacancy Rate · Exit Cap Rate · Debt Service Coverage Ratio (DSCR) Weighted Average Lease Term (WALT)
FAQs
How long is a commercial real estate market cycle?
There is no fixed length. Cycles are defined by sequence rather than duration. Individual phases have run from under a year to more than a decade, depending on the demand shock, the supply response, and credit conditions. Treat phase identification as descriptive of current conditions, not as a countdown to the next turn.
What are the four phases of the real estate cycle?
Recovery, expansion, hypersupply, and recession. Recovery is rising occupancy with flat rents and little construction. Expansion is occupancy above the long-run average with accelerating rents and restarting construction. Hypersupply is deliveries outpacing absorption while occupancy is still high. Recession is vacancy above average with pricing power held by tenants.
How do interest rates affect commercial real estate values?
Mainly through debt. Higher borrowing costs reduce loan proceeds and the price leveraged buyers can pay. They also raise the return investors demand, which pushes cap rates up and values down at any level of NOI. This can happen while occupancy and rents are still improving.
Do all property types follow the same cycle?
No. Lease duration determines how fast a property type reflects changing conditions. Hotels reprice nightly and move first; apartments reprice annually; industrial, office, and retail run multi-year leases and lag. Long-term net lease assets may track capital market conditions more closely than local fundamentals.
Can you time the real estate market cycle?
Identifying the current phase from occupancy, absorption, and pipeline data is achievable. Predicting the timing of the next transition is not. That is why underwriting stress-tests exit assumptions and matches loan terms to the business plan, rather than relying on a forecast.