Gross Rent Multiplier: Uses and Limits
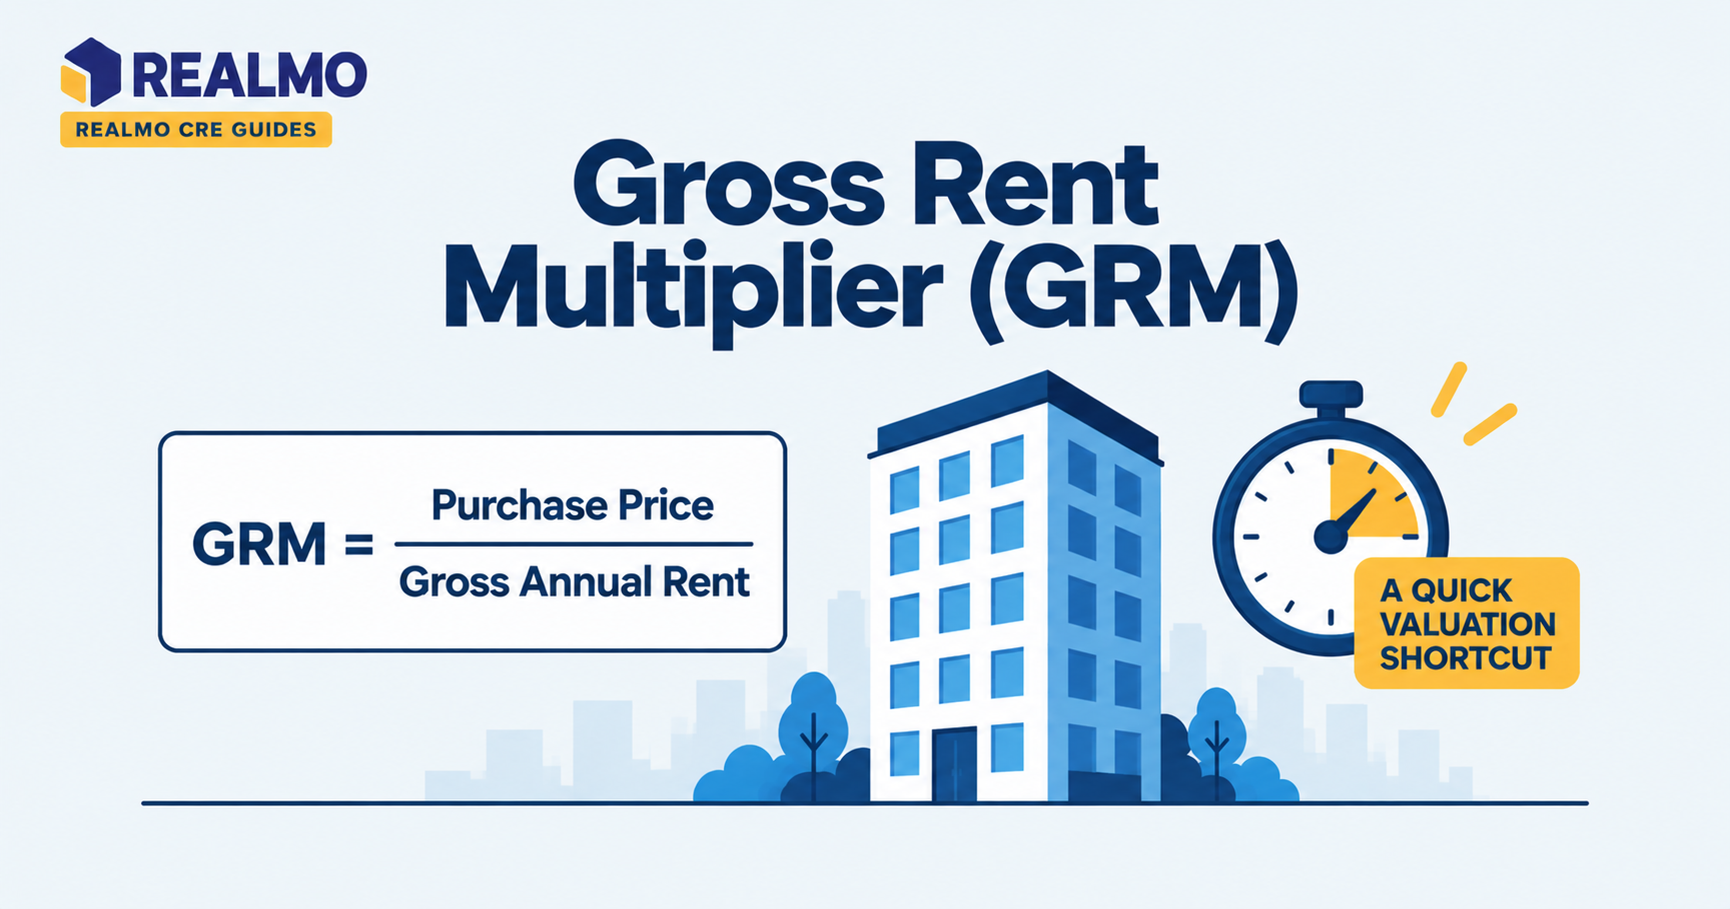
The gross rent multiplier (GRM) is a screening ratio that divides a property’s price by its gross annual rental income. A GRM of 10 means the price equals ten years of gross rent. Because the ratio ignores operating expenses, vacancy, and financing, it ranks candidates quickly but does not value them.
Why investors still run GRM before anything else
You pull twelve small multifamily and mixed-use listings on a Saturday. None of them come with a trailing-twelve operating statement, and half the brokers won’t send one until you sign a confidentiality agreement. What every listing does show is an asking price and a rent roll total.
GRM = Property Price ÷ Gross Annual Rental Income
Monthly GRM Formula:
Monthly GRM = Property Price ÷ Gross Monthly Rental Income
Property Price = Gross Annual Rental Income × Target GRM
GRM converts those two public numbers into one figure you can sort by. That is its entire job: deciding which three files you request, not which one you buy. The ratio also gives you a fast credibility check on the ask. If a seller prices a building at twice the gross rent multiplier that similar buildings in the same submarket trade at, either the rents are far below market and the seller is pricing in upside, or the price is aspirational. Both cases are worth a call. Neither is worth an offer based on GRM alone.
How the gross rent multiplier formula works
The calculation uses two inputs:
GRM = Property Price ÷ Gross Annual Rental Income
Price is the purchase price or asking price. Gross annual rental income is scheduled base rent for twelve months, before any deduction. A property priced at $1.8 million with $180,000 of annual scheduled rent carries a GRM of 10.0 (illustrative figures).
Two decisions shape the result more than the arithmetic does. First, whether you use scheduled rent (every unit leased at current contract rent) or effective rent (scheduled rent minus vacancy and collection loss). Scheduled rent is the convention, which is why GRM flatters buildings with real vacancy problems. Second, whether reimbursements, parking, storage, and other income belong in the numerator's denominator. Most practitioners exclude them, since including them turns the ratio into something closer to a gross income multiplier and breaks comparability with quoted GRMs.
Annual vs. monthly GRM, and why it matters
Residential brokers and some small-asset sellers quote GRM on monthly rent. The monthly version of the same $1.8 million property with $15,000 of monthly rent produces a GRM of 120. Both numbers describe the identical deal, and they differ by a factor of twelve.
Confusing the two is the single most common error in listing copy. Before you compare any two multipliers, confirm both use the same period. If a quoted GRM sits in the single digits, it is annual. If it runs into the hundreds, it is monthly.
What GRM hides: expenses, vacancy, and lease type
GRM stops at the top line, so everything that separates gross rent from money in your pocket is invisible to it. Two buildings with identical rents and identical prices produce identical multipliers even when one is a triple net lease asset where tenants pay taxes. Insurance, and maintenance, and the other is a gross-lease building where the owner pays all three.
The gap compounds. A building with older mechanical systems, a master-metered utility setup, or a property tax assessment that resets on sale will carry a far heavier operating expense ratio than a comparable across the street. GRM sees none of it. It also ignores capital expenditures, tenant improvement and leasing commission obligations, remaining lease term, and tenant credit. A single-tenant building with eight months left on its lease and a strong-credit building with twelve years of term can post the same multiplier.
GRM vs. cap rate: which question each one answers
Cap rate divides net operating income by value, so it accounts for the entire expense stack. GRM divides price by gross rent, so it accounts for none of it. The two connect through a simple identity:
Cap Rate ≈ (1 − Expense and Vacancy Load) ÷ GRM
That relationship explains why GRM comparisons only hold within a narrow band of similar assets. Hold the expense load constant and a lower GRM does mean a higher cap rate. Change the lease structure, the age of the building, or the tax jurisdiction, and the ranking can flip entirely.
Use GRM to sort a long list of comparable assets in one submarket. Use cap rate once you have verified income and expenses, and use cash-on-cash return once you know your debt terms.
Worked example: two strip centers, opposite conclusions
All figures below are illustrative.
Inputs. Property A is priced at $2,000,000 with $200,000 in gross annual rent under modified gross leases. Property B is priced at $2,400,000 with the same $200,000 in gross annual rent under NNN leases.
Step 1, GRM. A: $2,000,000 ÷ $200,000 = 10.0. B: $2,400,000 ÷ $200,000 = 12.0. On the multiplier, A looks 20% cheaper.
Step 2, apply the expense load. Assume A's operating expenses plus vacancy consume 45% of gross rent, and B's consume 15% because tenants reimburse taxes, insurance, and common area maintenance. NOI for A is $110,000. NOI for B is $170,000.
Step 3, cap rate. A: $110,000 ÷ $2,000,000 = 5.5%. B: $170,000 ÷ $2,400,000 = 7.1%.
Interpretation. The higher multiplier is the better buy on current income. B costs more per dollar of gross rent and delivers more per dollar of price, because the lease structure moves the expense burden to tenants. GRM ranked the deals backwards.
The common mistake this exposes. Investors screen a mixed list, gross leases, modified gross, and NNN together, and assume the lowest GRM wins. The multiplier is only comparable across assets that share a lease structure, a rough building vintage, and a tax jurisdiction.
Common mistakes with gross rent multiplier
- Comparing annual GRM to monthly GRM. A factor-of-twelve error that makes a fairly priced building look like a giveaway, or the reverse. Confirm the period before comparing anything.
- Using scheduled rent on a building with real vacancy. A property half-empty at above-market asking rents posts an attractive multiplier and delivers a fraction of the income. Check the rent roll against actual collections.
- Treating GRM as a valuation. Lenders and appraisers underwrite to NOI. A multiplier-based offer that ignores the expense stack tends to fall apart at the appraisal or in the debt sizing.
- Ignoring below-market rents. A building with legacy leases signed years below market shows a high GRM and may still be the strongest deal on the list, because the income resets as leases roll.
- Mixing property types. Industrial, retail, and multifamily carry structurally different expense loads and lease terms, so their multipliers do not translate across sectors.
Screening at scale is where the ratio earns its keep. Realmo's listing analytics publish price and income data across the national inventory, so you can build a GRM comparison set for a submarket before requesting a single offering memorandum.
Related terms
Cap rate · Net operating income (NOI) · Operating expense ratio · Triple net lease (NNN) · Rent roll · Cash-on-cash return · Effective gross income · Debt service coverage ratio
FAQs
What is a good gross rent multiplier?
There is no universal threshold. A defensible GRM is one that sits at or below what similar assets, same property type, lease structure, vintage, and submarket, have recently traded at. A multiplier that looks attractive in one market can be expensive in another with heavier property taxes or higher owner-paid expenses.
Is a higher or lower GRM better?
Lower is better only when the properties being compared carry similar expense loads. A lower multiplier means fewer years of gross rent to cover the price. Once lease structures differ, a higher GRM asset can produce more net income per dollar invested, as the worked example above shows.
How do you convert GRM to a cap rate?
Multiply the reciprocal of GRM by the share of gross rent that survives operating expenses and vacancy. At a GRM of 10 with a 40% expense and vacancy load, the implied cap rate is 0.60 ÷ 10 = 6.0%. The conversion is only as reliable as your expense estimate.
Do appraisers use gross rent multiplier?
Appraisers may reference GRM as a secondary check within the sales comparison approach, one of the valuation methods under USPAP, particularly for small residential income properties. For commercial assets, the income approach built on NOI and cap rate carries the weight, and lenders size debt from NOI rather than gross rent.
Can GRM be used for owner-occupied commercial property?
Only with an estimated market rent standing in for actual rent, since there is no rent roll. That makes the result a rough indication of pricing relative to leased comparables, not a measure of the property's performance for the occupying business.