Operating Expense Ratio Benchmarks: How Owners Read the Number
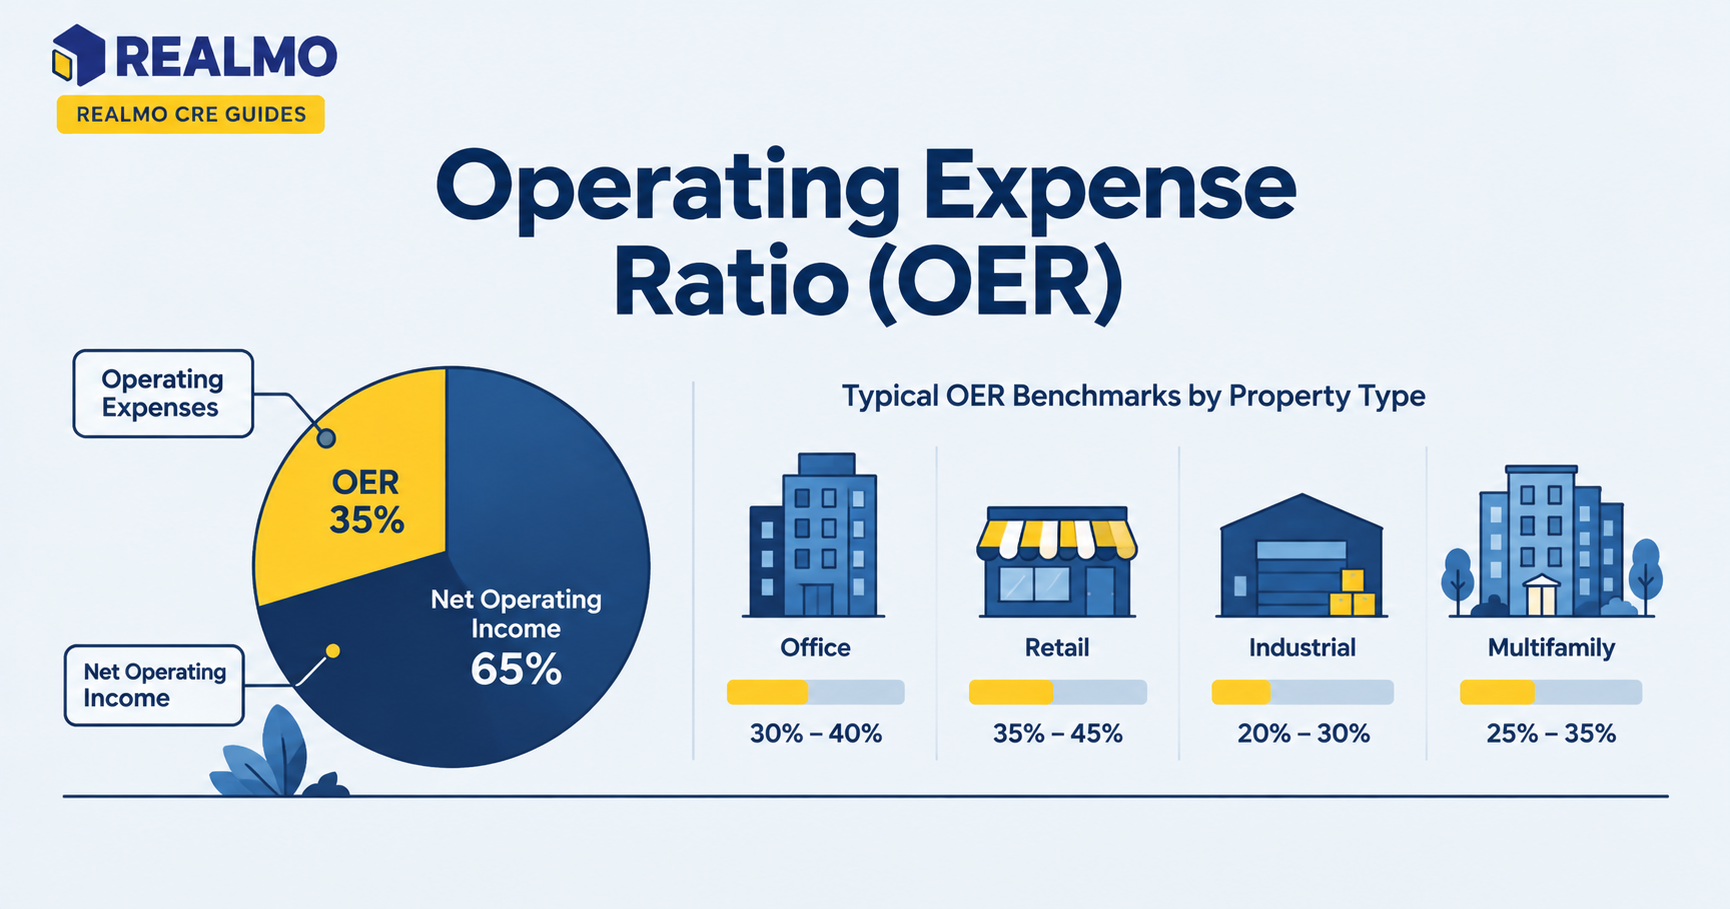
The operating expense ratio measures what share of a property’s income is consumed by the cost of running it. Divide total operating expenses by effective gross income. A ratio of 40% means forty cents of every dollar collected goes to operations. Leaving sixty cents as net operating income before debt service and capital spending.
Why the ratio matters more to owners than to buyers
An owner watches rents rise across two renewal cycles and expects net income to follow. It doesn’t. Collections are up, occupancy is stable, and NOI has barely moved. The expense ratio is where that story becomes legible: it shows that operating costs absorbed the entire rent gain, and it points at which line item did the absorbing once you break the ratio into components.
Buyers look at the ratio once, during underwriting. Owners live inside it. Every insurance renewal, tax appeal, service contract, and lease structure decision moves it, and the ratio is the fastest way to see whether a decision that felt small at signing is quietly compounding. Because lenders and appraisers apply their own expense assumptions at refinance and at sale, a property whose ratio drifts above its peer group gets underwritten conservatively , which shows up as a lower supportable loan amount or a lower value conclusion.
How to calculate the operating expense ratio
The formula is straightforward:
OER = Total Operating Expenses ÷ Effective Gross Income
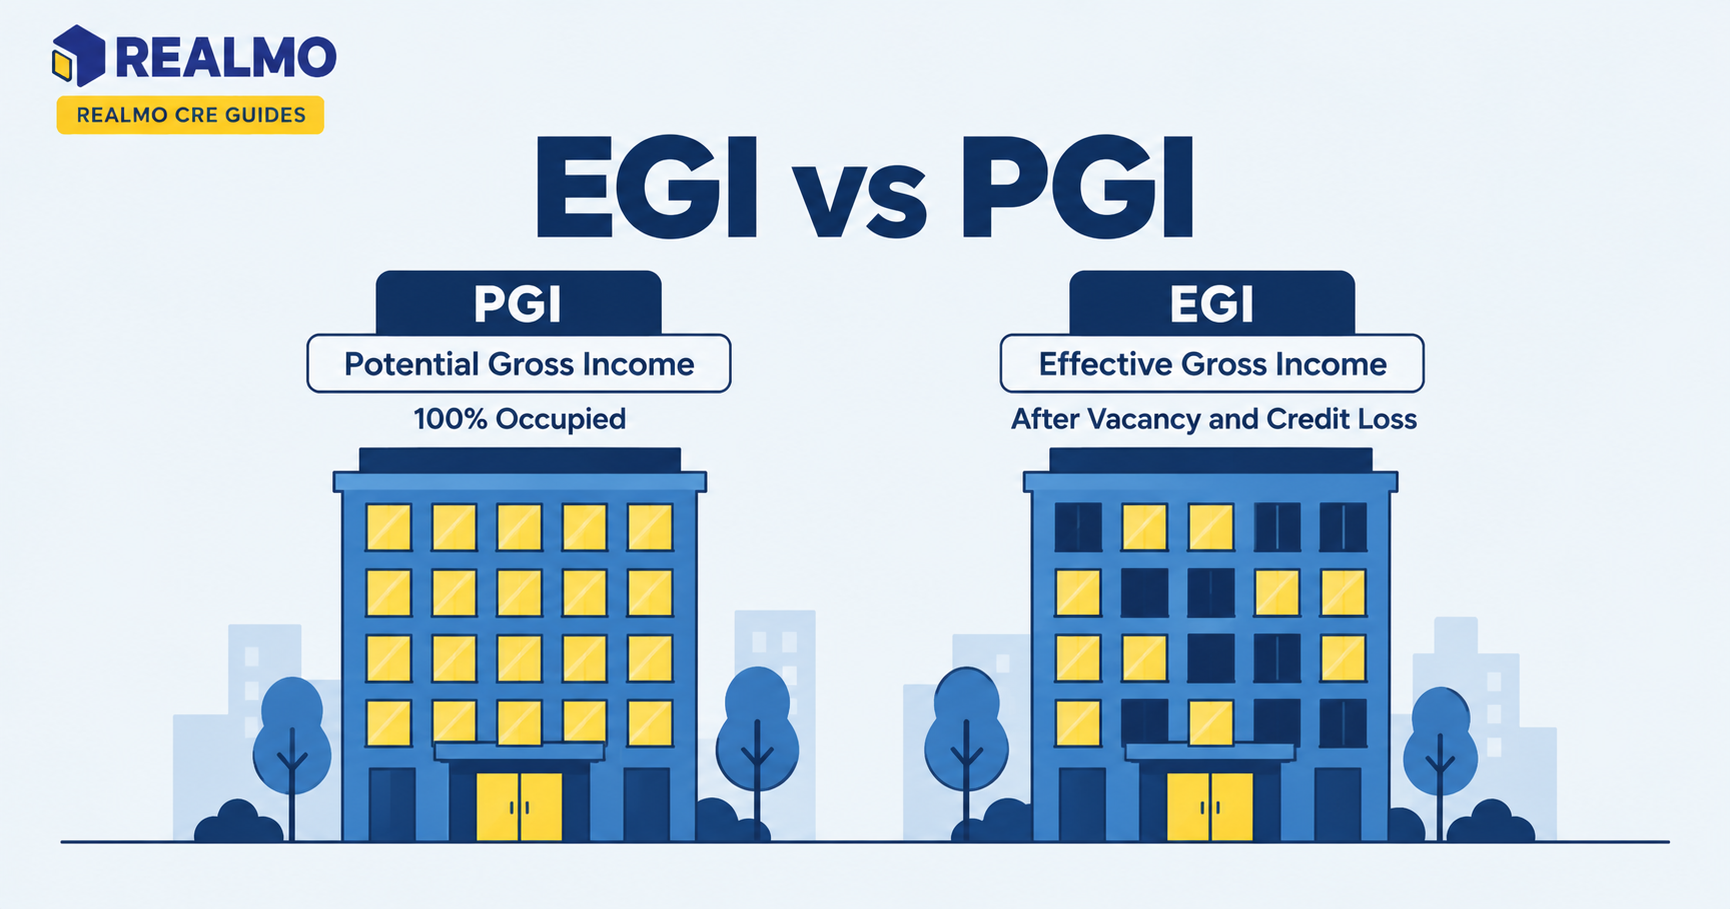
Effective gross income is gross potential rent plus other income and expense reimbursements, minus vacancy and credit loss. Some owners use gross operating income or actual collections instead; the choice is defensible, but it must stay consistent across periods or the trend line becomes meaningless.
Which costs belong in the numerator
Operating expenses are the recurring costs of keeping the property open and leased: property taxes, insurance, utilities, repairs, and maintenance, janitorial and landscaping, security, on-site payroll, management fees, and general administrative costs. Three categories are excluded by convention: debt service, capital expenditures, and depreciation and income taxes. Debt structure belongs to the owner, not the building. Capital items are lumpy and would distort any year they land in.
Two items sit in a gray zone. Replacement reserves are excluded by most owners and included by most lenders. Leasing commissions and tenant improvements are capital in nearly all owner reporting but get amortized into expense assumptions by some appraisers. Neither treatment is wrong. Comparing a reserve-inclusive ratio to a reserve-free one is.
Why lease structure moves the ratio most
Before you compare any two ratios, check how the leases allocate costs. A single-tenant building on a triple net lease can show a ratio near zero. This is because the tenant pays taxes, insurance, and maintenance directly and those dollars never touch the owner’s income statement. A full-service office building where the owner pays everything and recovers costs only through base rent will show a ratio several times higher. Neither building is better run.
Reimbursement accounting creates the same distortion inside a single property type. If CAM reimbursements are reported as income and the underlying costs as expenses, both sides of the fraction grow and the ratio rises. If reimbursements are netted against the costs they offset, both sides shrink and the ratio falls. Same building, same cash flow, two very different numbers. The grossed-up presentation is more common in institutional reporting and is the one lenders expect.
How expense ratios differ across property types
Property type sets the range, and the driver is always the same. How much of the operating burden the owner carries and how labor-intensive the asset is.
Multifamily sits at the high end. The owner pays taxes, insurance, and most maintenance, turnover is frequent, and on-site staffing is a fixed cost. Full-service office runs high for parallel reasons, building staff, common area utilities, and janitorial scale with occupancy. Self-storage and hospitality carry heavy operating loads relative to revenue, though hotels are usually measured with different metrics entirely. Net-leased industrial and single-tenant retail sit at the low end, because long leases push cost responsibility to a credit tenant, and the owner’s remaining obligations are structural.
Within a type, older assets run higher than newer ones, coastal and catastrophe-exposed markets run higher on insurance, and properties in jurisdictions that reassess on transfer frequently see the ratio jump in the first full year of ownership. That last one catches new owners regularly: the seller’s trailing expenses were assessed on a decades-old basis. Property tax treatment varies widely by state and county , confirm reassessment mechanics with a licensed tax professional before relying on a seller’s historical figures.
How to build a benchmark for your own asset
Published expense ratio benchmarks are broad by necessity. They blend lease structures, vintages, and tax regimes into a single average, which makes them useful for a sanity check and unreliable for a decision.
A better benchmark is a peer set you assemble: same property type, comparable size and vintage, same tax jurisdiction, similar lease structure. Normalize everything to expense per square foot or per unit before converting back to a ratio. This is because per-unit costs are comparable across buildings while ratios are hostage to rent levels. A well-run building in a low-rent submarket will always show a worse ratio than a mediocre building in a high-rent one. On Realmo, ownership records and property-level data across 9M+ assets let you identify comparable buildings in your. Submarket before you start assembling the expense side from tax rolls and your own vendor bids.
Then benchmark against yourself. Trailing twelve months against the prior twelve, budget against actual, and each line item separately. Most expense problems live in one or two categories, and a blended ratio hides them.
What a rising expense ratio actually signals
A ratio that climbs while rents hold flat means margin erosion, and the cause is usually insurance, taxes, or payroll. A ratio that climbs while rents rise means costs are growing faster than income, a sign that a gross-lease rent roll has no mechanism to pass through inflation.
The reverse deserves equal suspicion. A falling ratio can mean genuine efficiency, or it can mean deferred maintenance being converted into a future capital event. Since capital spending sits outside the ratio entirely, an owner can improve the number for two years by simply not fixing anything. Read the ratio alongside net operating income in dollars, expense per square foot, and the capital plan.
Worked example: multi-tenant retail center
Illustrative figures only; round numbers chosen to show the mechanics.
A 20,000 SF neighborhood center reports gross potential rent of $600,000, expense reimbursements of $120,000, and vacancy and credit loss of $60,000. Effective gross income is $660,000.
Operating expenses: property taxes $90,000, insurance $25,000, CAM, and repairs $60,000, common area utilities $15,000, management fee at 4% of EGI ($26,400), and administrative and professional costs $12,000. Total: $228,400.
OER = $228,400 ÷ $660,000 = 34.6%
Now net the reimbursements against expenses instead of grossing them up. Expenses fall to $108,400 and EGI falls to $540,000, producing a ratio of 20.1%. The building generated identical cash either way. If you benchmarked the second presentation against a peer group reported on the first basis. You would conclude this center runs at half the cost of its competitors, and you would be wrong.
The common error here is comparing a ratio to a benchmark without confirming both were built the same way. Ask how reimbursements were handled before you ask whether the number is good.
Common mistakes with operating expense ratios
- Including debt service or capital items in expenses. It inflates the ratio, understates NOI, and makes the property look like an operational problem when it’s a financing or reinvestment decision.
- Mixing reimbursement treatments across a portfolio. Properties become non-comparable, and portfolio-level averages become noise.
- Benchmarking against national averages for a locally driven cost. Taxes and insurance are jurisdictional. A national ratio tells you nothing about whether your assessment is contestable.
- Using a seller’s trailing expenses without adjusting for reassessment. The tax line resets after a transfer, and the acquisition-year ratio comes in materially above underwriting.
- Excluding a management fee because the owner self-manages. It understates true operating cost and produces a ratio that collapses the moment the property is sold or third-party managed.
Related terms
Net operating income · Effective gross income · Cap rate · Triple net lease · CAM charges · Replacement reserves · Expense recovery and gross-up · Capital expenditures
Frequently asked questions
What is a good operating expense ratio?
There is no universal target. The defensible answer depends on property type, lease structure, building age, and tax jurisdiction. A net-leased industrial building and a full-service office tower can both be well managed with ratios far apart. Compare against a peer set built on the same accounting basis rather than against a published average.
Does the operating expense ratio include debt service?
No. Mortgage principal and interest are financing costs tied to the owner, not to the property’s operations. Excluding them keeps the ratio comparable between a debt-free building and a leveraged one. Debt is measured separately through the debt service coverage ratio.
Are capital expenditures part of operating expenses?
No. Roof replacements, HVAC units, and tenant improvements are capitalized, not expensed, because they are irregular and would distort any period they land in. This is why a falling expense ratio should always be checked against the capital plan, deferring capital work improves the ratio temporarily.
How does the operating expense ratio relate to cap rate?
Indirectly, through NOI. The ratio determines how much of collected income survives as NOI, and NOI divided by price produces the cap rate. Two buildings with identical gross income and different expense ratios will support different valuations at the same cap rate.
Should I include a management fee if I manage the property myself?
Standard practice includes a market-rate management fee regardless of who performs the work. Lenders and appraisers will add one during underwriting. Omitting it produces a ratio that looks strong today, and misleads you about what the asset is worth to a buyer who will hire a manager.