Break-Even Occupancy Explained
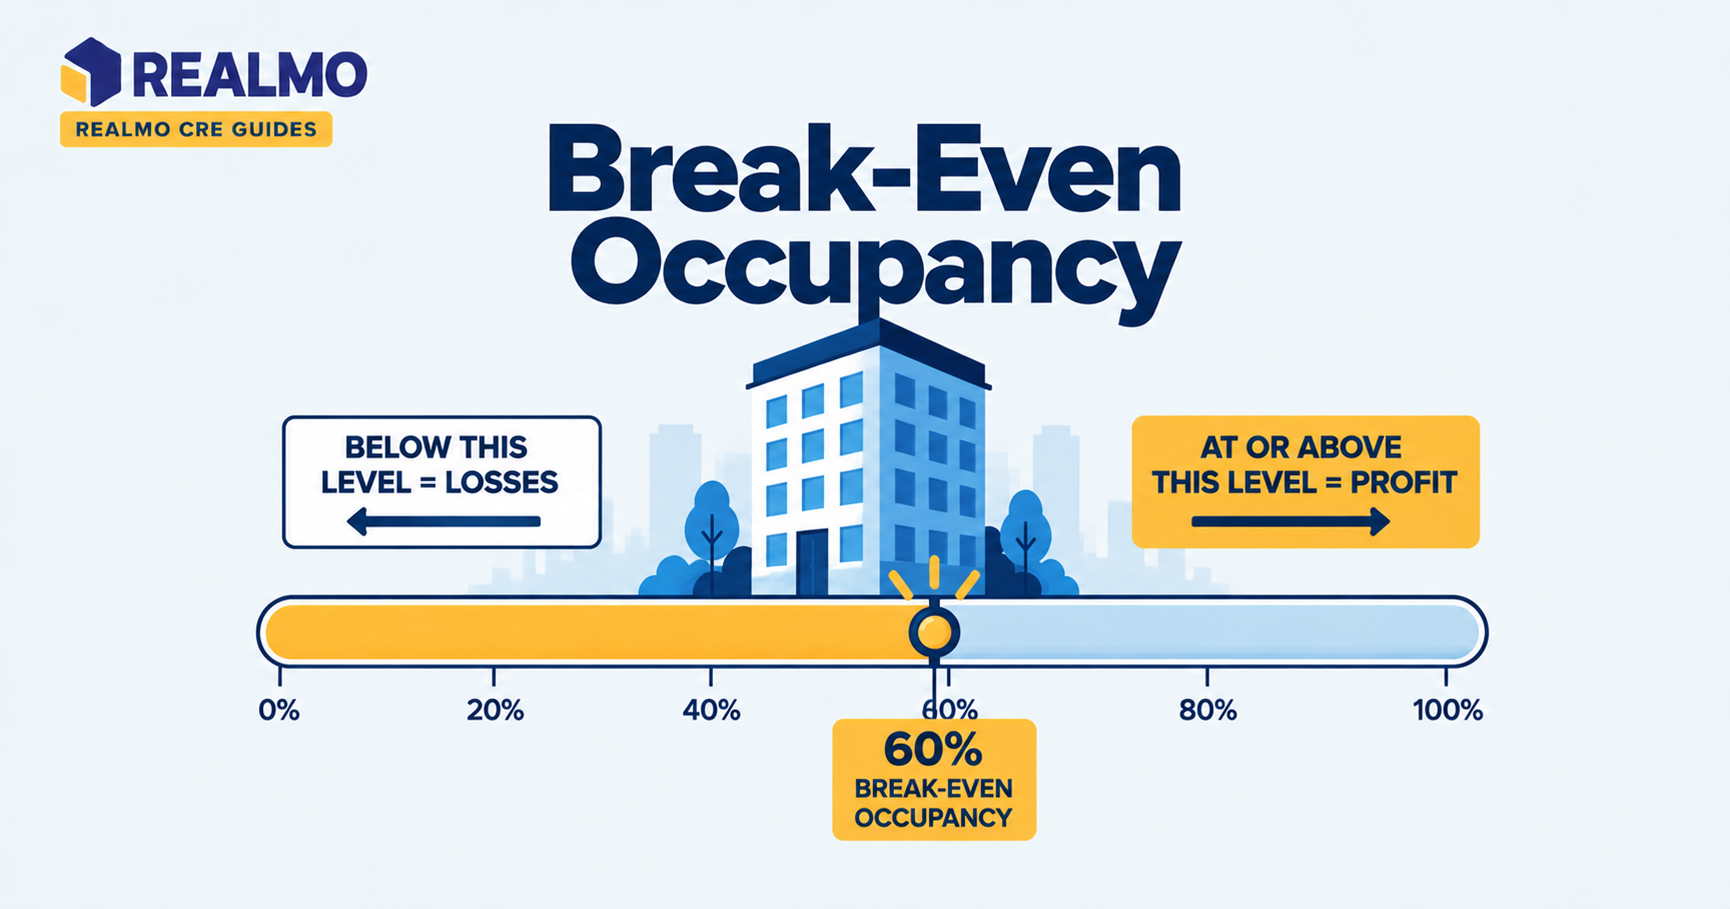
Break-even occupancy is the share of a property’s gross potential income that must be collected to cover operating expenses and debt service with nothing left over. Below that line the asset burns cash; above it, each additional rent dollar becomes owner cash flow. Lenders treat it as the occupancy at which DSCR equals 1.00.
Why break-even occupancy decides your leasing strategy
Picture a 50,000-square-foot multi-tenant flex building you own free of partners but not free of debt. Your largest tenant holds 22% of the space and its lease expires in fourteen months. The question you actually have to answer is not “will they renew” but “how much rent can I lose before the building stops paying its own mortgage.”
Break-even occupancy answers that in one number. If the building breaks even at 82% and sits at 94%, losing that tenant drops you below the line, and you start funding the shortfall from your own pocket while you re-lease. Knowing the gap tells you how aggressively to negotiate renewal, whether to pre-market the space, and how large a reserve to hold before the lease rolls. Owners who calculate it after the tenant leaves are negotiating from a weaker position than owners who calculated it a year earlier.
How to calculate break even occupancy
The formula divides fixed obligations by the income the property could produce at full occupancy:
Break-even occupancy = (Operating expenses + Annual debt service) ÷ Gross potential income
Gross potential income is the rent the property would collect if every square foot were leased at market rate. Plus recurring other income such as parking or storage. It is a full-occupancy figure, not your current collections. Operating expenses cover taxes, insurance, utilities, management, maintenance, and administrative costs. Annual debt service is principal plus interest for twelve months, taken from the amortization schedule rather than the interest line alone.
The result is expressed as a percentage. Anything you can do to lower expenses, lower debt service, or raise achievable rents pushes that percentage down and widens your margin for error. This ratio sits alongside net operating income and debt service coverage ratio as the three numbers most owners check before a lease decision.
Which expenses belong above the line
Operating expenses in this calculation should reflect a stabilized year, not a quiet one. Deferred roof work, a management fee you waived because you self-manage, and insurance that renews on a different cycle all distort the numerator downward and make the building look safer than it is.
Two items cause most disagreement. Capital reserves are excluded from NOI under standard practice but many owners include them here, on the logic that a roof replacement is as unavoidable as a tax bill. Tenant improvements and leasing commissions are usually excluded because they are episodic, though in a building with heavy annual rollover they behave like a recurring cost. Neither treatment is wrong; what matters is that you apply the same definition every time you run the number, and that you know which definition your lender used when it underwrote the loan. Check the loan documents, since some cash management provisions are triggered by a lender-defined ratio rather than yours.
Physical occupancy versus economic occupancy
The formula produces an economic threshold, not a physical one. A building can be 100% leased and still sit below break-even if a tenant is in free rent, another is paying below-market holdover rent, and a third stopped paying three months ago.
Physical occupancy counts leased square feet. Economic occupancy counts collected dollars against gross potential income, and it is the figure that matters for solvency. The two diverge most sharply during lease-up, when concessions are heaviest, and during tenant distress, when the rent roll looks intact but collections do not. Compare your break-even percentage against economic occupancy. Then look at physical occupancy separately to understand whether a gap comes from vacancy or from what the leases are actually producing.
Worked example: a 50,000-square-foot flex building
All figures below are illustrative and rounded for clarity.
Assume gross potential income of $1,100,000, from 50,000 square feet at $22.00 per square foot on gross leases. Stabilized operating expenses run $440,000. The loan carries annual debt service of $462,000. Adding expenses and debt service gives $902,000 in obligations. Dividing by $1,100,000 in gross potential income produces a break-even occupancy of 82%.
Interpreting the result: the building must collect 82% of full-occupancy income to cover everything. At 94% economic occupancy it generates roughly $132,000 of annual cash flow before capital items, and it can absorb about 12 points of occupancy loss , about 6,000 square feet , before cash flow reaches zero.
Now add a capital reserve of $0.25 per square foot, or $12,500. Obligations rise to $914,500 and break-even occupancy moves to 83.1%. That one point is the difference between a roof fund and a capital call, which is why the reserve question deserves a decision rather than a default.
What raises and lowers the break-even point
Debt is the strongest lever. A higher loan balance, a shorter amortization period, or a refinancing into costlier debt raises annual debt service and lifts break-even occupancy directly, which is why highly leveraged assets fail faster in soft leasing markets. Interest-only periods lower the ratio temporarily and raise it sharply when amortization begins , a scheduled shift many owners forget to model.
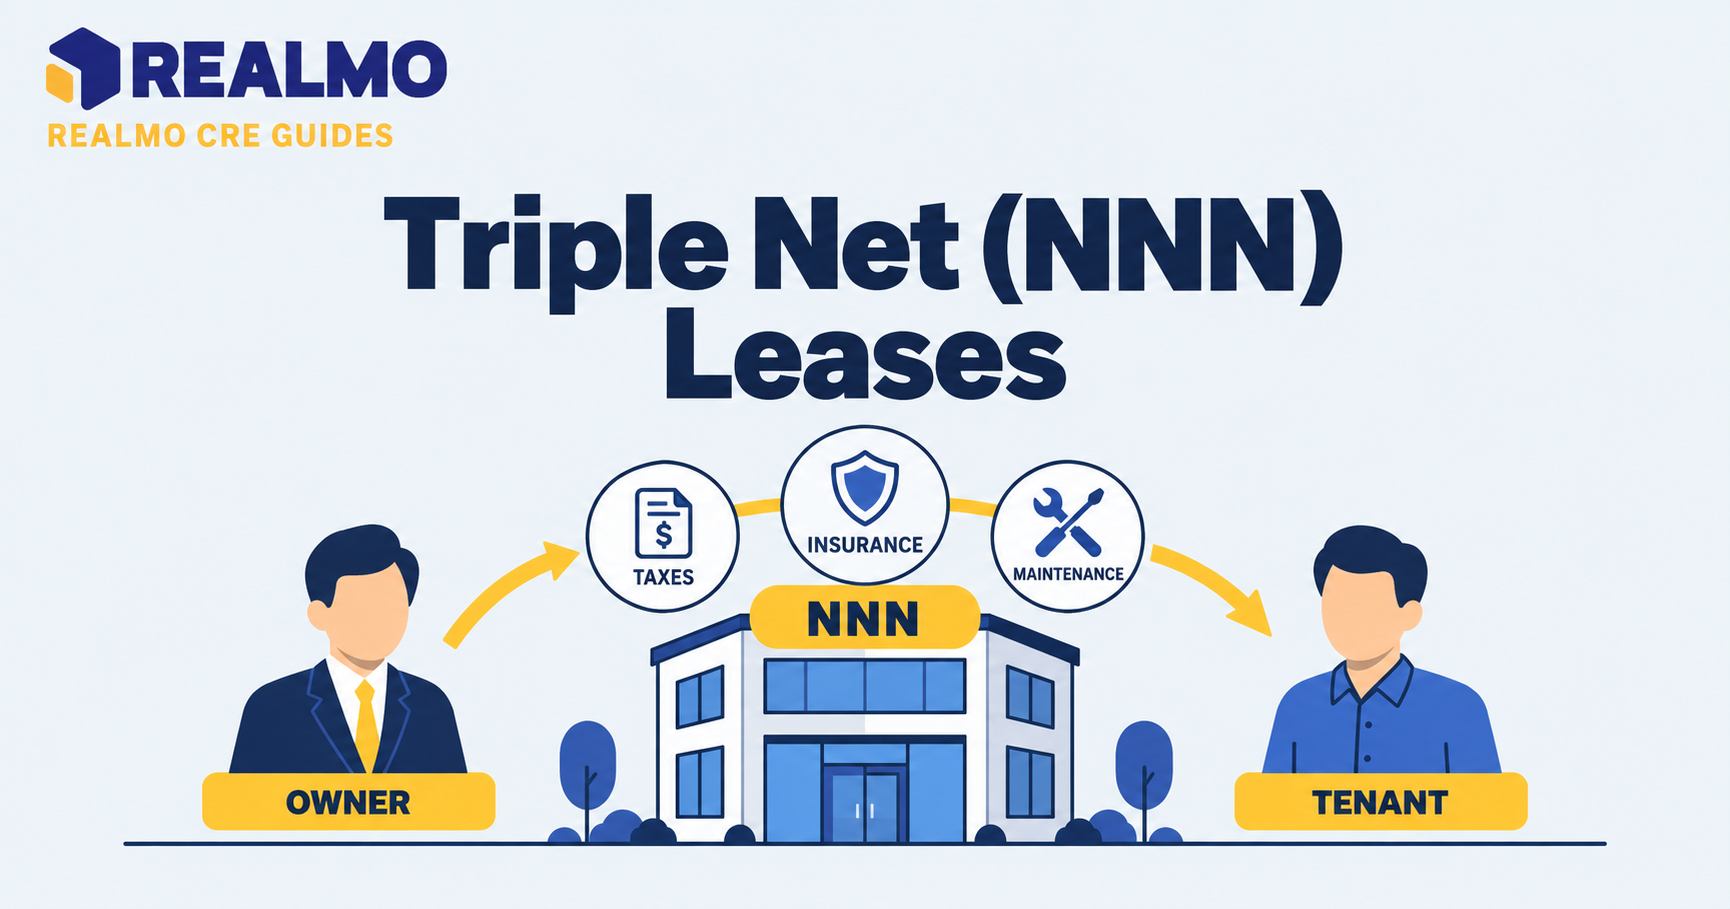
Lease structure matters nearly as much. Triple-net leases push recoverable expenses onto tenants and lower the owner’s numerator, so NNN-leased properties in prevailing market practice break even at lower occupancy than comparable gross-leased ones. Property tax reassessment after a sale, insurance renewals in catastrophe-exposed markets, and utility costs in older buildings all move the ratio the other way.
Rent assumptions drive the denominator. Setting gross potential income from aspirational rents rather than achievable ones understates break-even occupancy and hides risk. Realmo’s property analytics and comparable listing data give you a market-grounded rent basis for that denominator instead. Of a number carried forward from an old pro forma.
Common mistakes owners make with this ratio
- Using current collections as the denominator. Gross potential income assumes full occupancy at market rent. Substituting actual income produces a meaninglessly low percentage and a false sense of safety.
- Counting interest only. Principal is a cash obligation. Omitting it understates debt service and can hide the fact that a building is already below break-even.
- Running it once at acquisition. Taxes reassess, insurance reprices, and loans exit interest-only periods. A ratio calculated three years ago describes a building that no longer exists.
- Ignoring rollover concentration. A building at 78% break-even with one tenant occupying 40% of the space is riskier than one. At 85% with twenty tenants staggered across five years.
- Treating the threshold as a target. Break-even is the floor, not the goal. Operating near it leaves nothing for capital expenditures or re-tenanting costs when a space goes dark.
Related terms
Debt service coverage ratio · Net operating income · Economic occupancy · Operating expense ratio · Cash-on-cash return · Gross potential rent · Loan-to-value ratio
FAQ
What is a good break-even occupancy?
Lower is safer, but the useful test is the gap between break-even and current economic occupancy. A building breaking even at 85% while running at 88% has almost no cushion. The acceptable spread depends on lease rollover concentration, tenant credit, and how quickly comparable space leases in that submarket.
Is break-even occupancy the same as DSCR of 1.00?
They describe the same point from different angles. Break-even occupancy is the occupancy level at which debt service coverage ratio reaches exactly 1.00. Break-even occupancy answers a leasing question, DSCR answers a lending question, and both go to zero cash flow after debt service.
Should capital reserves be included in the calculation?
Industry practice splits. Excluding them matches the standard NOI definition and produces a lower ratio. Including them reflects that capital costs are genuinely unavoidable in older assets. Pick one treatment, apply it consistently, and confirm which convention your lender used when underwriting the loan.
How does break-even occupancy differ for NNN properties?
Under triple-net leases, tenants reimburse taxes, insurance, and maintenance, so those costs largely drop out of the owner’s numerator. Debt service then dominates the calculation, and break-even occupancy lands lower than for a comparable gross-leased building, though single-tenant NNN assets carry binary vacancy risk.
Can a fully leased building be below break-even?
Yes. Free rent periods, below-market holdover rents, and delinquent tenants all reduce collections while physical occupancy stays at 100%. This is why the ratio should be compared against economic occupancy. A rent roll that looks full can still produce collections beneath the break-even threshold.