How to Calculate Cash-on-Cash Return
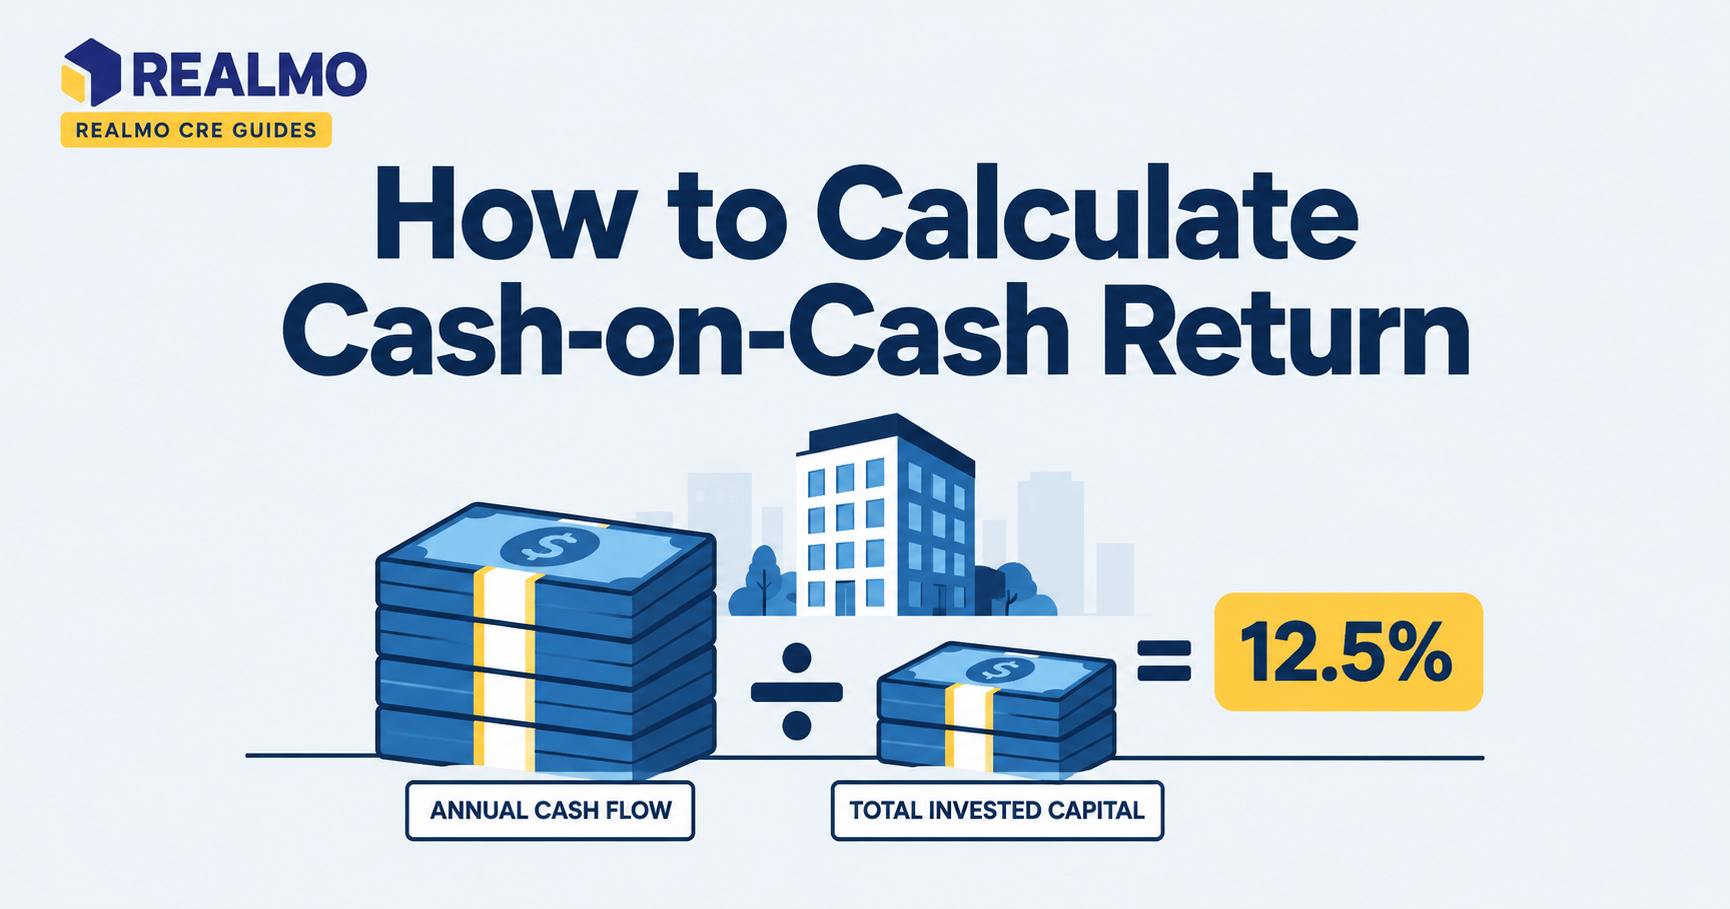
Cash-on-cash return measures the annual pre-tax cash flow a property produces divided by the cash an investor actually put into the deal. Expressed as a percentage, it answers one narrow question. What did the dollars that left your bank account earn this year, before appreciation, principal paydown, or taxes?
Cash-on-Cash Return Calculator
Calculate annual pre-tax cash flow and cash-on-cash return on your invested equity
Cash-on-Cash Return
Cash-on-Cash Return = Annual Pre-Tax Cash Flow ÷ Total Cash Invested × 100
Why cash-on-cash return decides whether a deal works
An investor comparing two small industrial buildings will usually find that the higher-priced one looks better on paper, newer roof, longer lease, stronger tenant. Cash-on-cash return is where that comparison becomes concrete, because it converts price, financing, and closing costs into a single number tied to the equity check.
The metric matters most in the first three years of ownership. When an investor still has the option to walk away from the deal at the letter-of-intent stage. A property can carry a healthy net operating income and still produce weak cash-on-cash return once debt service and upfront capital are counted. Lenders, partners, and syndication investors all ask the same question in different words: how much cash does this equity throw off per year? A deal that clears a required return unlevered can fail once a loan is layered on, and cash-on-cash is the first metric that exposes it.
The cash-on-cash formula and what belongs in it
The formula has two inputs:
Cash-on-Cash Return = Annual Pre-Tax Cash Flow ÷ Total Cash Invested
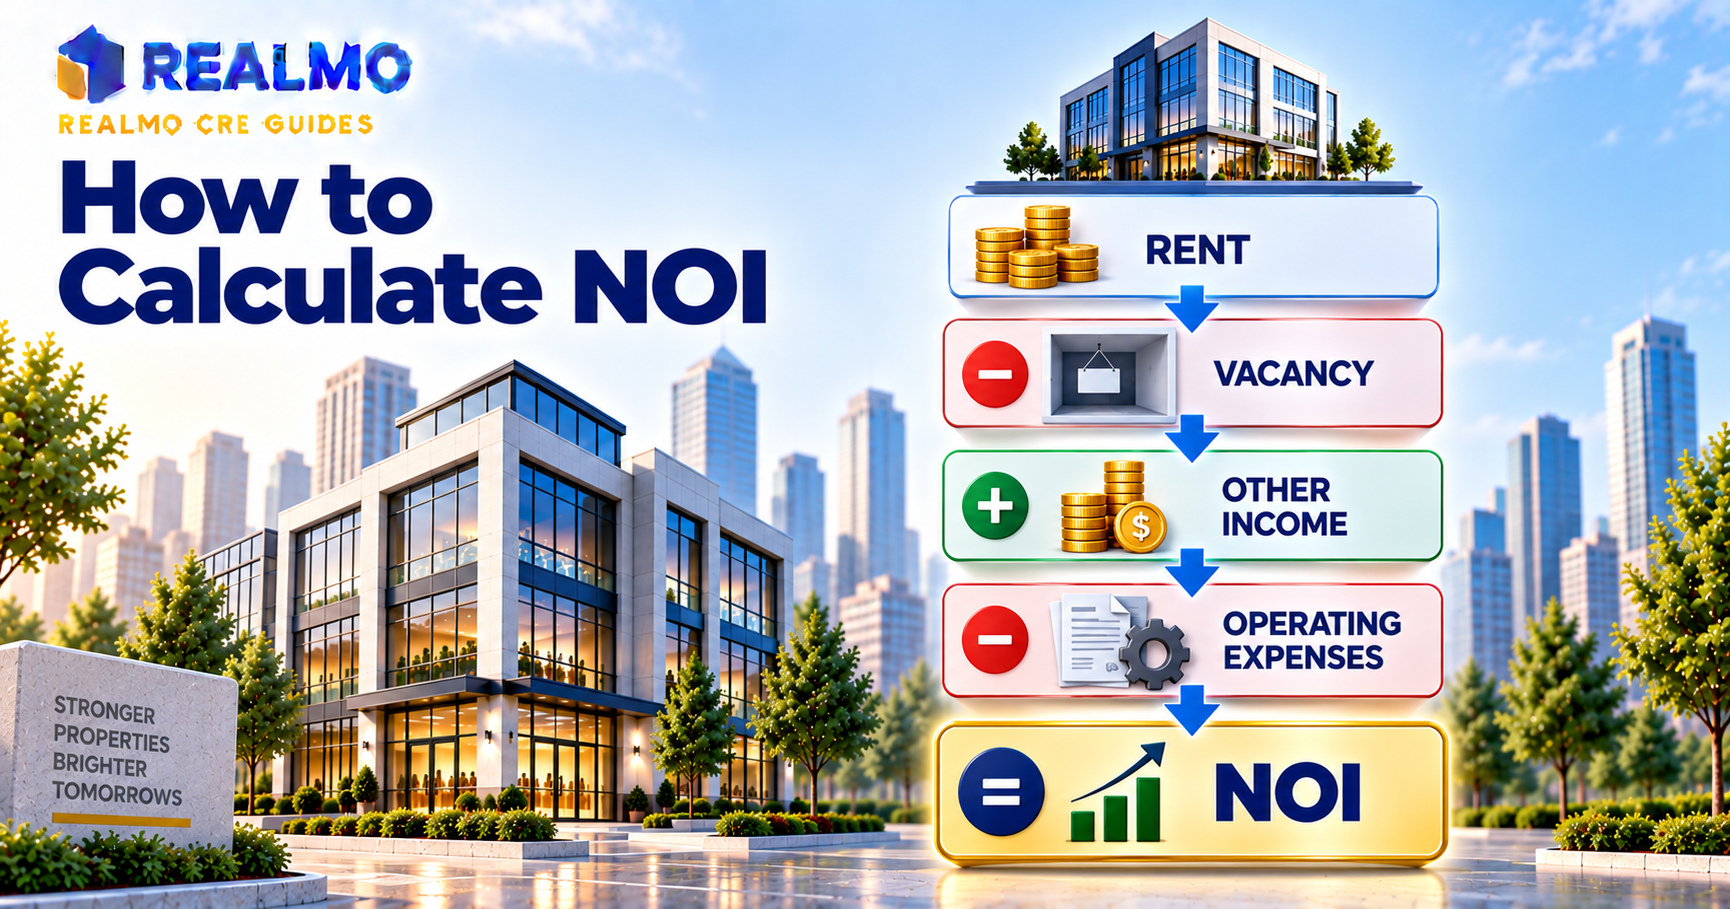
Annual pre-tax cash flow starts with net operating income and subtracts annual debt service, principal plus interest on all loans secured by the property. NOI itself already excludes debt service, depreciation (under the Modified Accelerated Cost Recovery System, MACRS), and income taxes, which is why it works as a clean starting point.
Practice splits on one item: capital reserves. Some underwriters subtract an annual reserve for roof, HVAC, parking lot, and tenant improvements before calculating the return, arguing that a building consumes capital every year whether or not it is spent that year. Others treat reserves as a capital item outside the operating calculation and report cash-on-cash before them. Neither is wrong, but the two conventions produce different numbers on the same building, so state which one you used whenever you present the figure to a partner or a lender.
What counts as total cash invested
Total cash invested is every dollar out of pocket to acquire and stabilize the asset, not just the down payment. That includes the equity portion of the purchase price, closing costs, lender fees and points, legal and due diligence expenses, and any capital spent before the property reaches its assumed operating condition , deferred maintenance, tenant improvements, leasing commissions, and initial working capital.
Investors who count only the down payment overstate their return. Sometimes by a full percentage point or more on a value-add deal where upfront capital runs high relative to equity. The denominator should match the check the investor would actually write.
How cash-on-cash return differs from cap rate and IRR
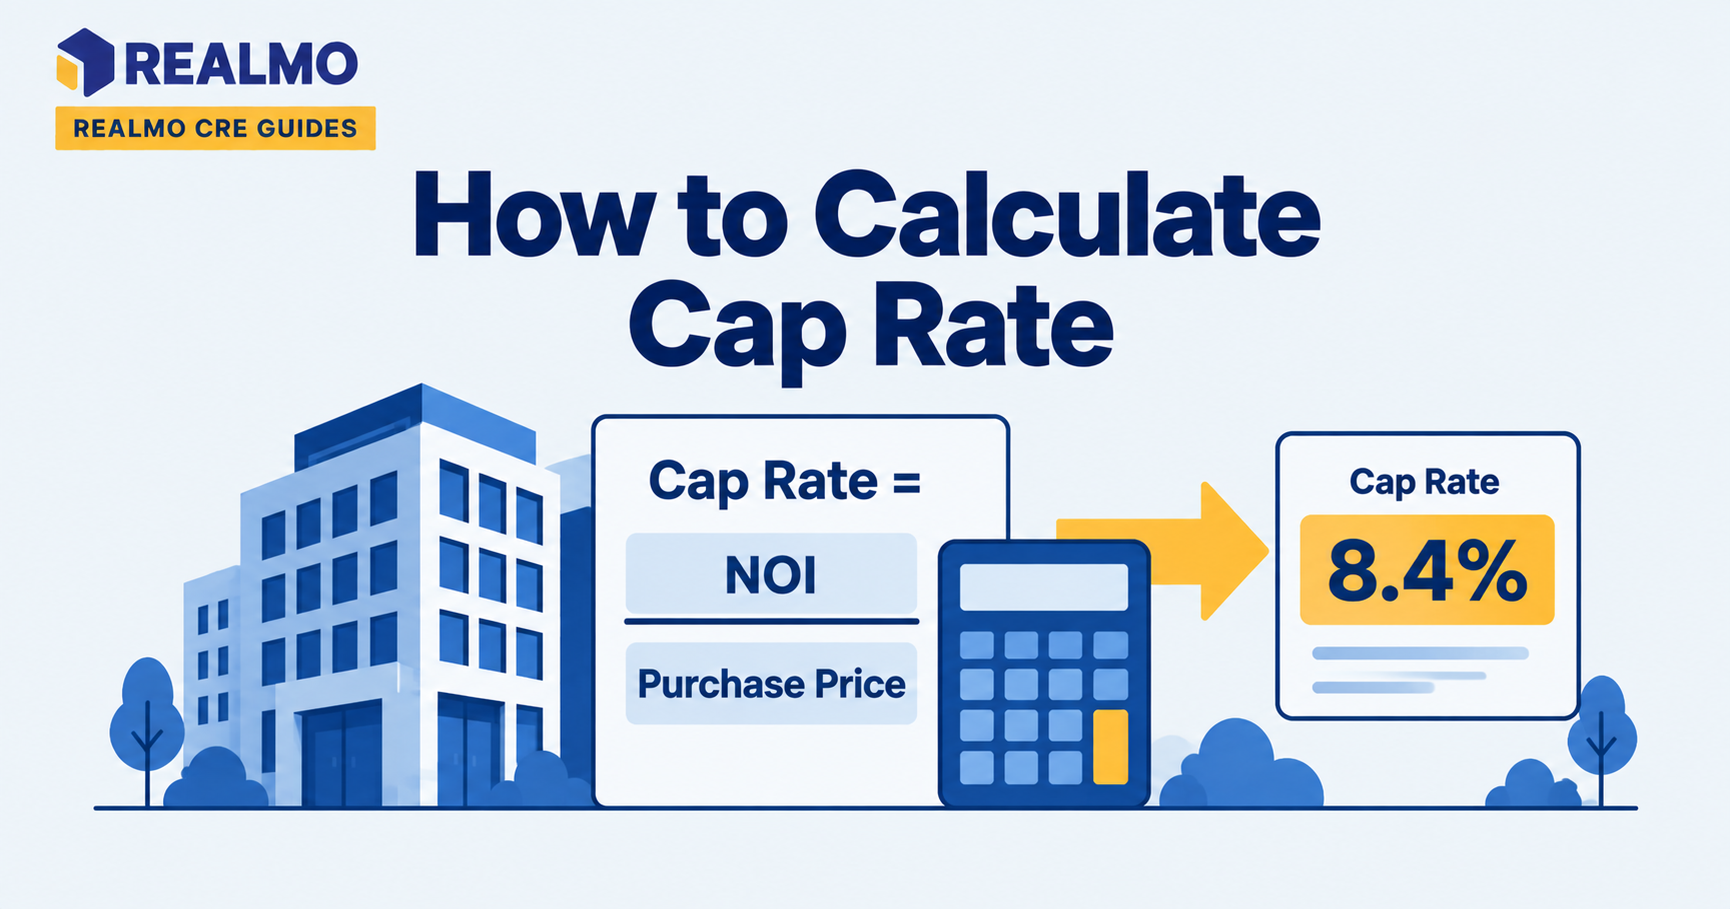
Cap rate ignores financing entirely: it divides NOI by purchase price and describes the asset. Cash-on-cash describes the investment structure, the same building bought with different loans produces different cash-on-cash returns and the same cap rate.
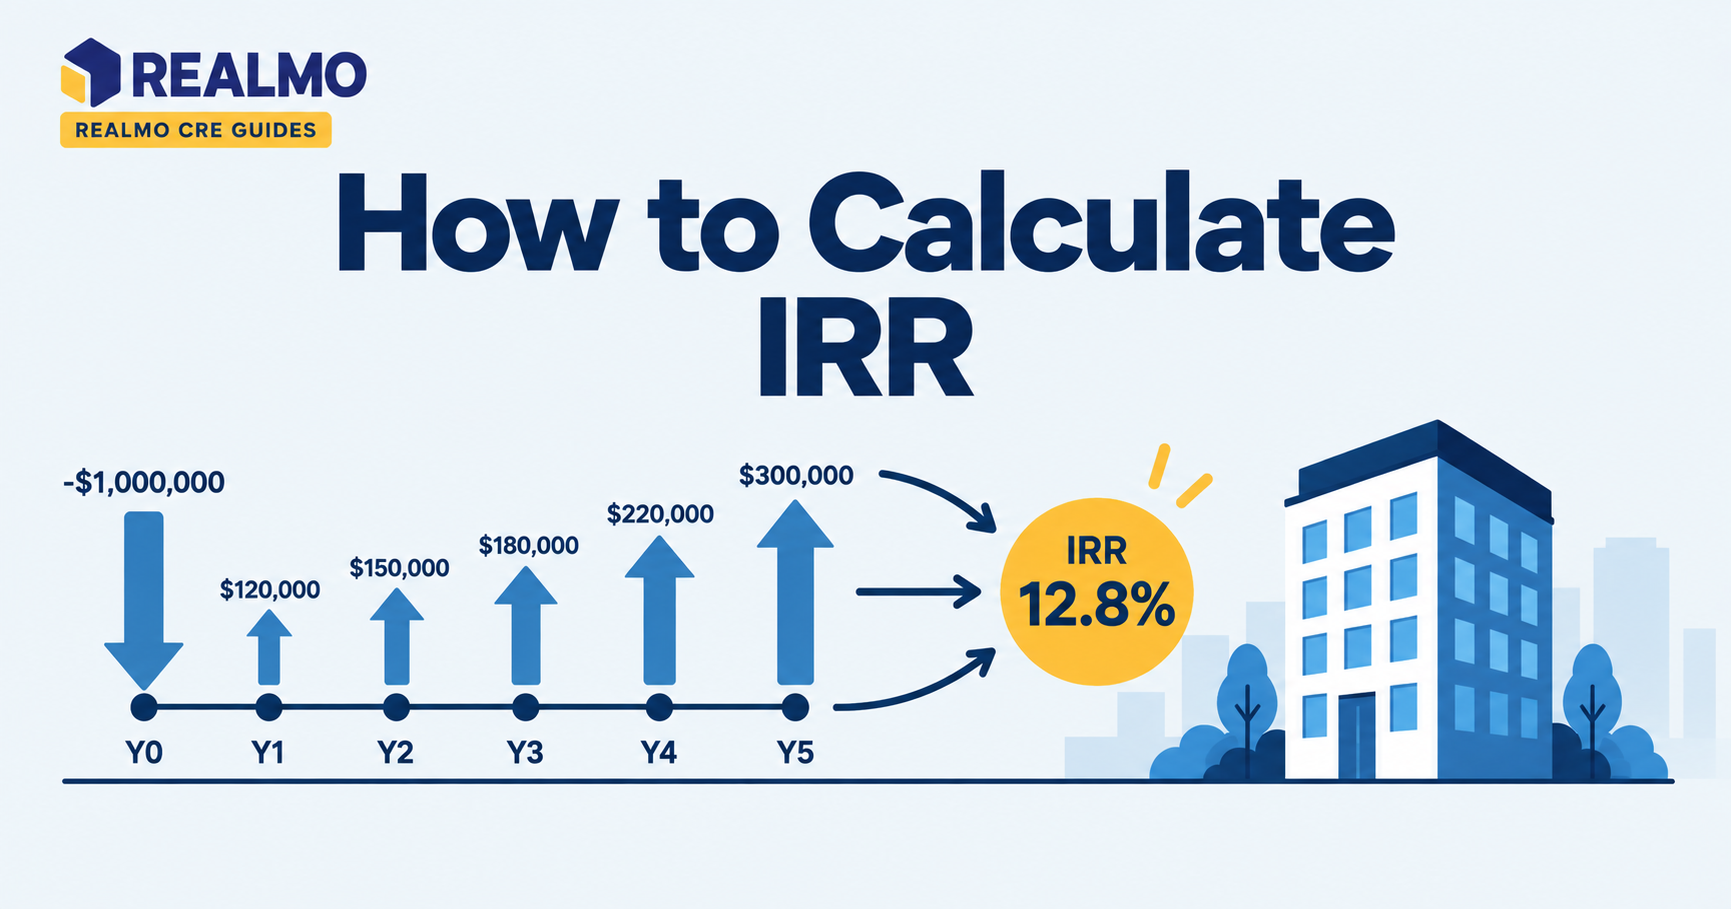
Internal rate of return accounts for the full hold period, the timing of every dollar, and the sale proceeds. Cash-on-cash covers one year and ignores time value of money, appreciation, and loan amortization. That narrowness is the point: it is quick, hard to manipulate, and directly comparable to the yield on any other place the investor could park cash. Use cap rate to price the asset, cash-on-cash to size the annual return on equity, and IRR to judge the whole hold.
Worked example: a leveraged small retail purchase
All figures below are illustrative and rounded for clarity, they are not market quotes.
Inputs
- Purchase price: $2,000,000
- Closing costs and lender fees: $60,000
- Upfront repairs and tenant improvements: $90,000
- Loan: $1,300,000 (65% LTV), 25-year amortization, illustrative fixed rate producing annual debt service of $100,500
- Year-one NOI: $150,000
Step 1, Total cash invested. Equity portion of price ($2,000,000 − $1,300,000 = $700,000) plus $60,000 closing costs plus $90,000 upfront capital = $850,000.
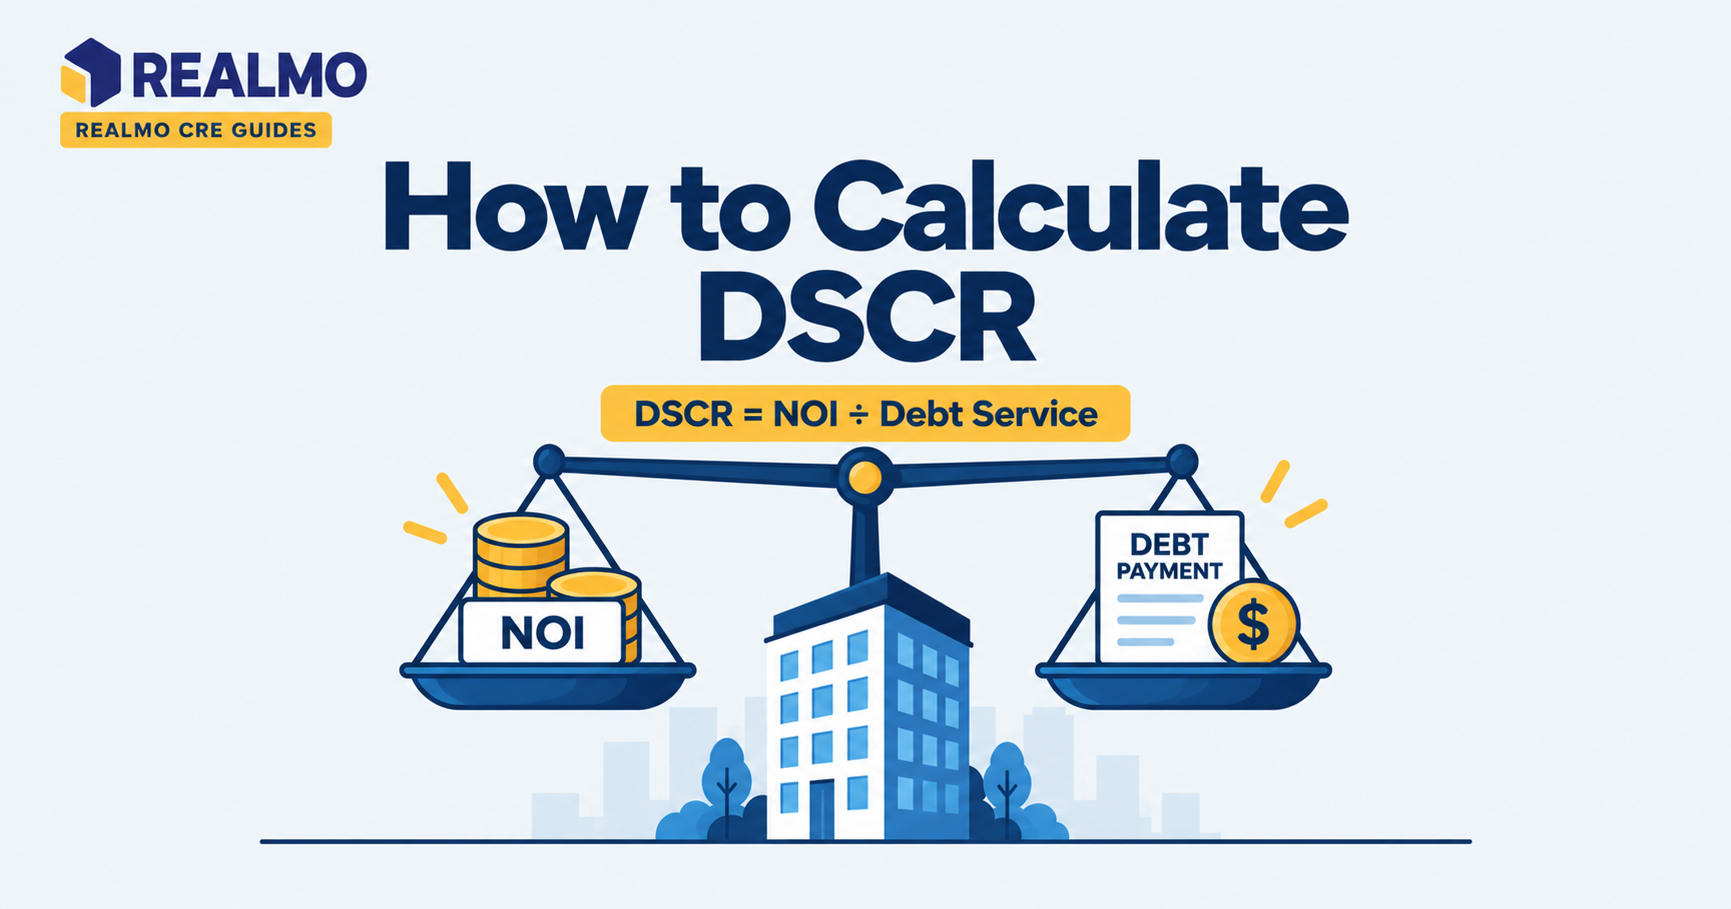
Step 2, Annual pre-tax cash flow. $150,000 NOI − $100,500 debt service = $49,500.
Step 3, Divide. $49,500 ÷ $850,000 = 5.8% cash-on-cash return.
How to read it. The unlevered yield on total cost is $150,000 ÷ $2,150,000, or about 7.0%. The loan constant , annual debt service divided by loan balance , is $100,500 ÷ $1,300,000, or about 7.7%. Because the loan constant exceeds the unlevered yield, the debt is costing more each year than the asset earns, and leverage pulls the cash-on-cash return below the unlevered figure. Reverse that relationship and leverage lifts the return instead. Comparing the loan constant to the unlevered yield tells you the direction of leverage before you run any numbers.
The common error here. Investors add the year-one principal paydown to cash flow and report a higher figure. Principal reduction builds equity but never appears in the bank account, so it belongs in an equity multiple or IRR calculation, not in cash-on-cash.
How leverage and the year measured move the number
Cash-on-cash return is a snapshot, and the snapshot changes. Year one usually looks worst on a value-add deal: upfront capital is in the denominator, rents have not been repositioned, and free rent periods may still be running. By year three, the same property with the same loan can show a materially different return without anything unusual happening.
Interest-only periods create the opposite distortion. Debt service during an interest-only period is lower than after amortization begins, so the return drops on the first fully amortizing year even though the asset performed identically. When comparing deals, compare the same year under the same debt structure, and label the year on every figure you circulate. Underwriting a pro forma over a five-year hold and reporting cash-on-cash for each year separately is more useful than a single headline number.
Verifying the inputs matters as much as the arithmetic. Ownership records, rent roll detail, and expense history for a target property are the raw material for NOI. Realmo's property analytics cover ownership and use data on 9M+ properties, which shortens the gap between a listing and a defensible operating assumption.
Common mistakes that inflate cash-on-cash return
- Counting only the down payment as cash invested. Omitting closing costs and upfront capital shrinks the denominator and inflates the return, by a percentage point on capital-intensive deals.
- Using pro forma NOI instead of in-place NOI. A stabilized projection assumes leasing that has not happened. Report the in-place figure first, then the projection, clearly labeled.
- Adding principal paydown to cash flow. It is a real return but not a cash return, and mixing the two makes the metric non-comparable to any other yield.
- Ignoring capital reserves entirely. A building with an aging roof and short-term leases will consume capital, and a return calculated as if it will not is a return the owner never receives.
- Comparing a year-one figure to a stabilized figure. Two deals shown at different points in their lifecycle are not comparable, no matter how precise the math.
Cash-on-cash return is a pre-tax measure. Depreciation, passive activity rules, and entity structure change what an investor keeps, so confirm after-tax outcomes with a licensed CPA or tax advisor.
Related terms
- Net operating income (NOI)
- Cap rate
- Debt service coverage ratio (DSCR)
- Internal rate of return (IRR)
- Equity multiple
- Loan-to-value ratio (LTV)
FAQs
What is a good cash-on-cash return?
There is no universal threshold. The relevant comparison is the return available on alternative uses of the same equity at similar risk. Adjusted for the property's lease term, tenant credit, and capital needs. A stabilized net-leased asset and a vacant value-add building should not be judged against the same target.
Does cash-on-cash return include appreciation?
No. It captures only annual cash distributions relative to cash invested. Appreciation and principal paydown are realized at sale or refinance and appear in equity multiple and IRR calculations instead.
Is cash-on-cash return calculated before or after taxes?
Before. The standard calculation uses pre-tax cash flow, since tax outcomes depend on the investor's entity structure, basis. And depreciation position rather than on the property itself.
How is cash-on-cash return different from ROI?
Return on investment is a general term that can include appreciation, principal reduction, and sale proceeds over any period. Cash-on-cash is narrower: one year, cash only, measured against cash actually invested.
Can cash-on-cash return be negative?
Yes. When debt service exceeds NOI, annual cash flow is negative and the return is negative. This is common during lease-up or repositioning periods funded by reserves.