How to Calculate IRR in Real Estate for a Property Deal
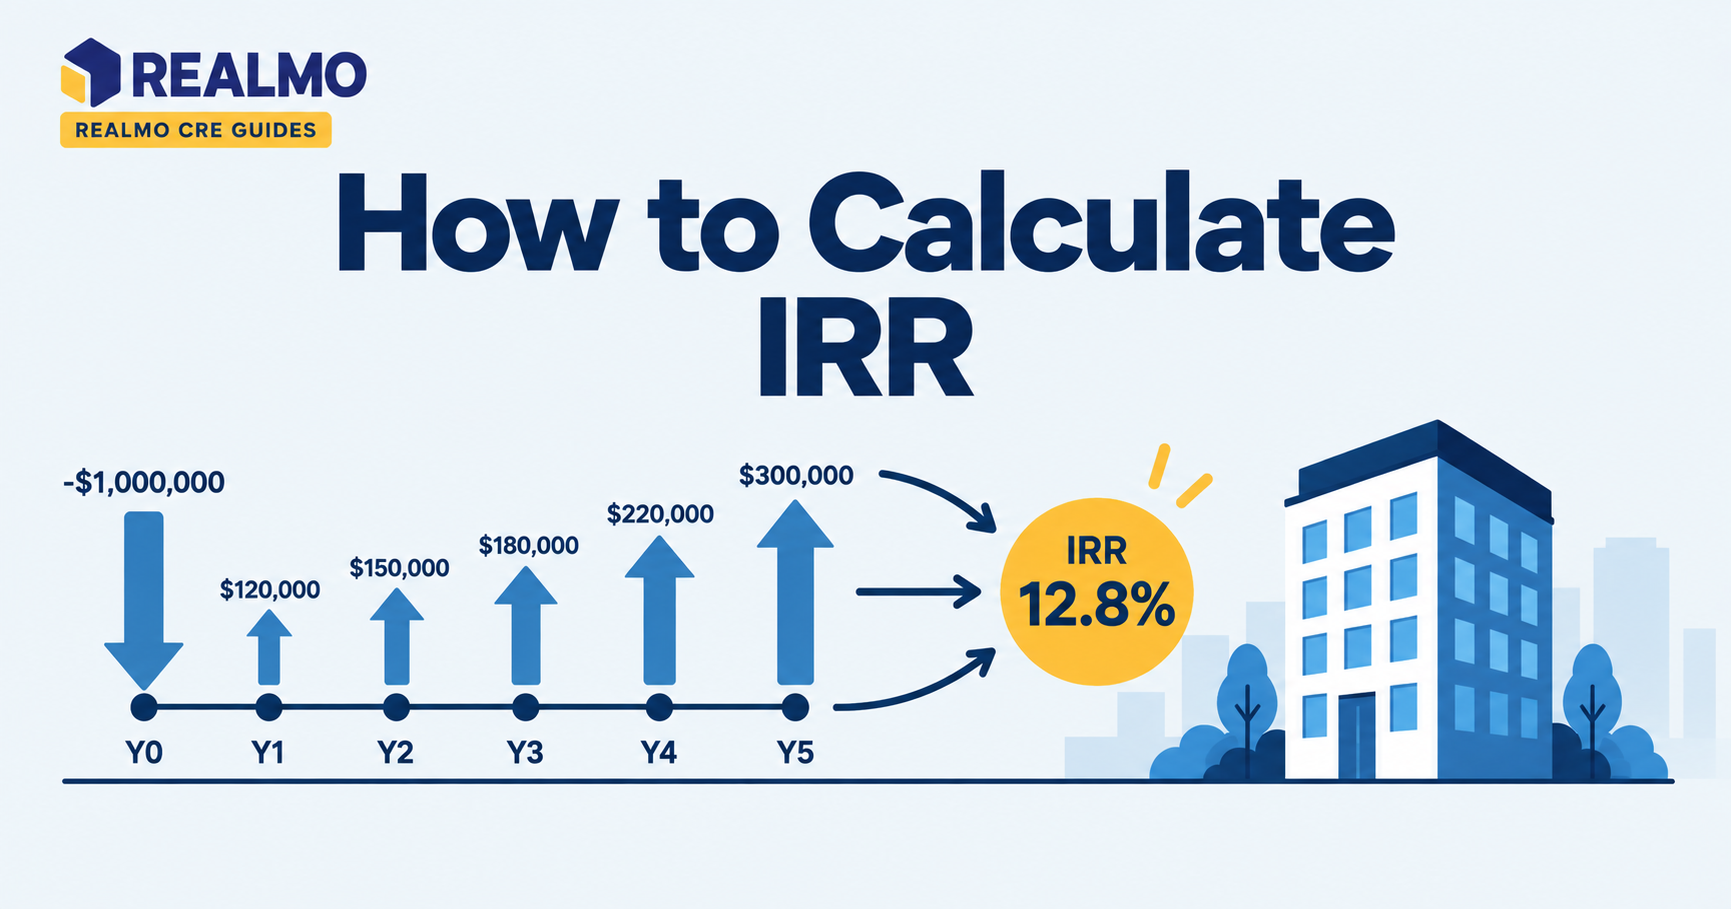
IRR (internal rate of return) is the annualized discount rate at which a property’s projected cash flows , equity invested, operating distributions, and net sale proceeds , sum to zero present value. Learning how to calculate IRR in real estate starts with building a dated cash flow series, then solving for the rate that balances it.
Real Estate IRR Calculator
Calculate Internal Rate of Return based on your initial investment and annual property cash flows
Internal Rate of Return
IRR is the annualized rate that makes the net present value of all investment cash flows equal to zero.
Why IRR drives most investor go/no-go calls
An investor comparing two acquisitions faces a problem simple return math cannot solve. Deal A is a stabilized net-lease building throwing off steady distributions with modest appreciation at exit. Deal B is a half-empty flex property that pays almost nothing for two years, then produces a large sale proceed after lease-up. Both might return the same total dollars on the same equity check. They are not the same investment.
IRR resolves that by pricing time. A dollar returned in year one can be redeployed; a dollar returned in year six cannot. Because IRR converts every deal , different hold periods, different distribution patterns, different exit assumptions , into one annualized figure, it has become the default screening metric in limited partner reporting, fund-level return targets, and promote structures. If you plan to read a private placement memorandum or negotiate a waterfall, you need to understand the number the waterfall is built on.
The IRR formula and what each variable represents
IRR is the rate r that satisfies:
0 = Σ [ CFt / (1 + r)^t ], for t = 0 through n
- CFt, the net cash flow in period t. CF₀ is your initial equity outlay, entered as a negative number.
- t, the period index, most years in real estate underwriting, though monthly models are common on short-hold development.
- n, the final period, which carries both that year's operating cash flow and net sale proceeds.
- r, the unknown you are solving for.
No closed-form algebra solves this equation for more than a few periods. Spreadsheets find r by iteration: guess a rate, calculate net present value, adjust, repeat until NPV lands near zero. That is exactly what Excel's IRR and XIRR do, and it is why an IRR calculation is only as credible as the assumptions behind the pro forma feeding it.
How to calculate IRR in real estate, step by step
- Set period zero as your total equity outlay. Include down payment, closing costs, loan fees, and any capital reserve funded at closing, not the full purchase price if the deal is financed.
- Project net operating income for each year. Build it from rent roll, market rent on rollover, vacancy and credit loss, and operating expenses. This is where net operating income discipline matters most.
- Subtract debt service and capital items. Annual distributions equal NOI minus debt service, tenant improvements, leasing commissions, and capital expenditures.
- Model the exit. Apply an exit cap rate to forward-year NOI, subtract selling costs and outstanding loan balance, and add the result to the final year's cash flow.
- Solve. Use XIRR with actual dates if flows are irregular, or IRR if flows are annual and evenly spaced.
Two inputs move IRR more than all others combined: the exit assumption and the rent growth path. Pull comparable sale and lease data from a source you can defend rather than a rounded guess. Realmo's property analytics cover ownership records, valuation estimates, and cap rate context on 9M+ U.S. properties without a paywall. This is a reasonable starting point for exit sanity checks.
Worked example: a five-year value-add hold
All figures below are illustrative and rounded for clarity.
An investor buys a small multi-tenant industrial building for $2,000,000 with $600,000 of equity, including closing costs. Cash flow after debt service grows as below-market leases roll to market. In year five, the property sells and net proceeds after loan payoff and selling costs are $900,000.
| Period | Cash flow |
|---|---|
| Year 0 | –$600,000 |
| Year 1 | $42,000 |
| Year 2 | $48,000 |
| Year 3 | $54,000 |
| Year 4 | $58,000 |
| Year 5 | $62,000 + $900,000 = $962,000 |
Discounting at 15% produces a positive NPV of roughly $19,800; discounting at 16% produces a negative NPV of roughly $3,500. The rate that zeroes the series sits between them, near 15.9%.
Interpreting it. The deal returns about 15.9% annualized on equity over five years. Total distributions of $1,164,000 against $600,000 invested give a 1.94x equity multiple. Note how the two metrics tell different stories: 87% of the return arrives in year five as sale proceeds, so the IRR is really an exit-price forecast wearing a percentage sign.
The frequent error here. Investors run the equity IRR but enter the full $2,000,000 purchase price at period zero while keeping levered, after-debt-service cash flows in years one through five. That mismatch understates return badly and produces a number that describes no actual investment.
Levered vs. unlevered IRR, and when each applies
Unlevered IRR uses the full purchase price as the period-zero outflow and NOI (less capital items) as the annual inflow, ignoring the loan entirely. It measures the property's performance as an asset. Levered IRR uses equity in and after-debt-service cash flow out, measuring the performance of your position in that asset.
Financing raises levered IRR whenever the property's unlevered return exceeds the loan constant (annual debt service divided by loan amount), and depresses it when the reverse is true. Because that relationship is arithmetic rather than skill, a high levered IRR can reflect an aggressive loan-to-value ratio more than a good building. Acquisitions teams commonly underwrite both figures and compare the spread to judge how much of the projected return is real estate and how much is debt.
Why IRR breaks down on some deal structures
IRR carries a reinvestment assumption: interim distributions are presumed to earn the same rate through the end of the hold. On a deal projecting a high return, that assumption is rarely realistic, and the reported figure overstates what an investor actually compounds. Modified IRR (MIRR) addresses this by letting you set separate finance and reinvestment rates.
IRR is also blind to scale and to duration. A quick flip returning modest dollars can show a higher IRR than a decade-long hold returning many times more capital, which is why institutional committees read IRR alongside equity multiple rather than in place of it. And when a cash flow series changes sign more than once , common on development deals with a mid-hold capital call , the equation can produce multiple mathematically valid IRRs, or none. In those cases, NPV at a stated discount rate is the more reliable comparison tool.
Common mistakes when calculating IRR
- Mixing levered and unlevered inputs. Full purchase price paired with after-debt cash flows, or equity paired with NOI. The output looks plausible and is meaningless.
- Using IRR on irregular dates. Excel's IRR assumes evenly spaced periods. A deal that closes in March and sells in September needs XIRR, or the result drifts by a meaningful margin.
- Omitting capital expenditures and leasing costs. Tenant improvements and commissions on rollover years are real cash out the door. Leaving them in a footnote instead of the cash flow line inflates IRR and hides refinancing risk.
- Treating the exit cap rate as a rounding decision. Small changes in exit cap swing IRR far more than small changes in year-two rent. Run the model at a cap rate above your entry assumption and see whether the deal still clears your hurdle.
- Reporting IRR without the hold period. A stated percentage means little detached from duration, distribution timing, and equity multiple.
Related terms
Net operating income · Cap rate · Cash-on-cash return · Equity multiple · Net present value · Discounted cash flow analysis · Waterfall and promote structures
FAQ
What is a good IRR for a real estate deal?
There is no universal threshold. Target returns rise with risk: stabilized core assets carry the lowest hurdles, while ground-up development carries the highest. This is because the capital is exposed longer and the exit is less certain. Compare any projected IRR against deals of similar risk, hold period, and leverage rather than against an absolute benchmark.
What is the difference between IRR and cash-on-cash return?
Cash-on-cash return divides one year's pre-tax cash flow by equity invested, a single-period snapshot that ignores the sale. IRR spans the whole hold and incorporates exit proceeds and the timing of every distribution. A deal can show weak early cash-on-cash and strong IRR if most value is realized at sale.
Can you calculate IRR without a spreadsheet?
Only by trial and error. You can bracket the answer by computing NPV at two rates and interpolating between them, which is what the worked example above does. For anything past a few periods, a spreadsheet or financial calculator is the practical tool.
Should IRR be calculated before or after tax?
Both are used. Sponsors report pre-tax IRR at the deal level because tax outcomes vary by investor. While individuals model after-tax IRR to reflect MACRS depreciation, recapture, and their own bracket. Confirm which basis a projection uses before comparing it to another offering.