Cash-on-Cash vs IRR: When to Use Each
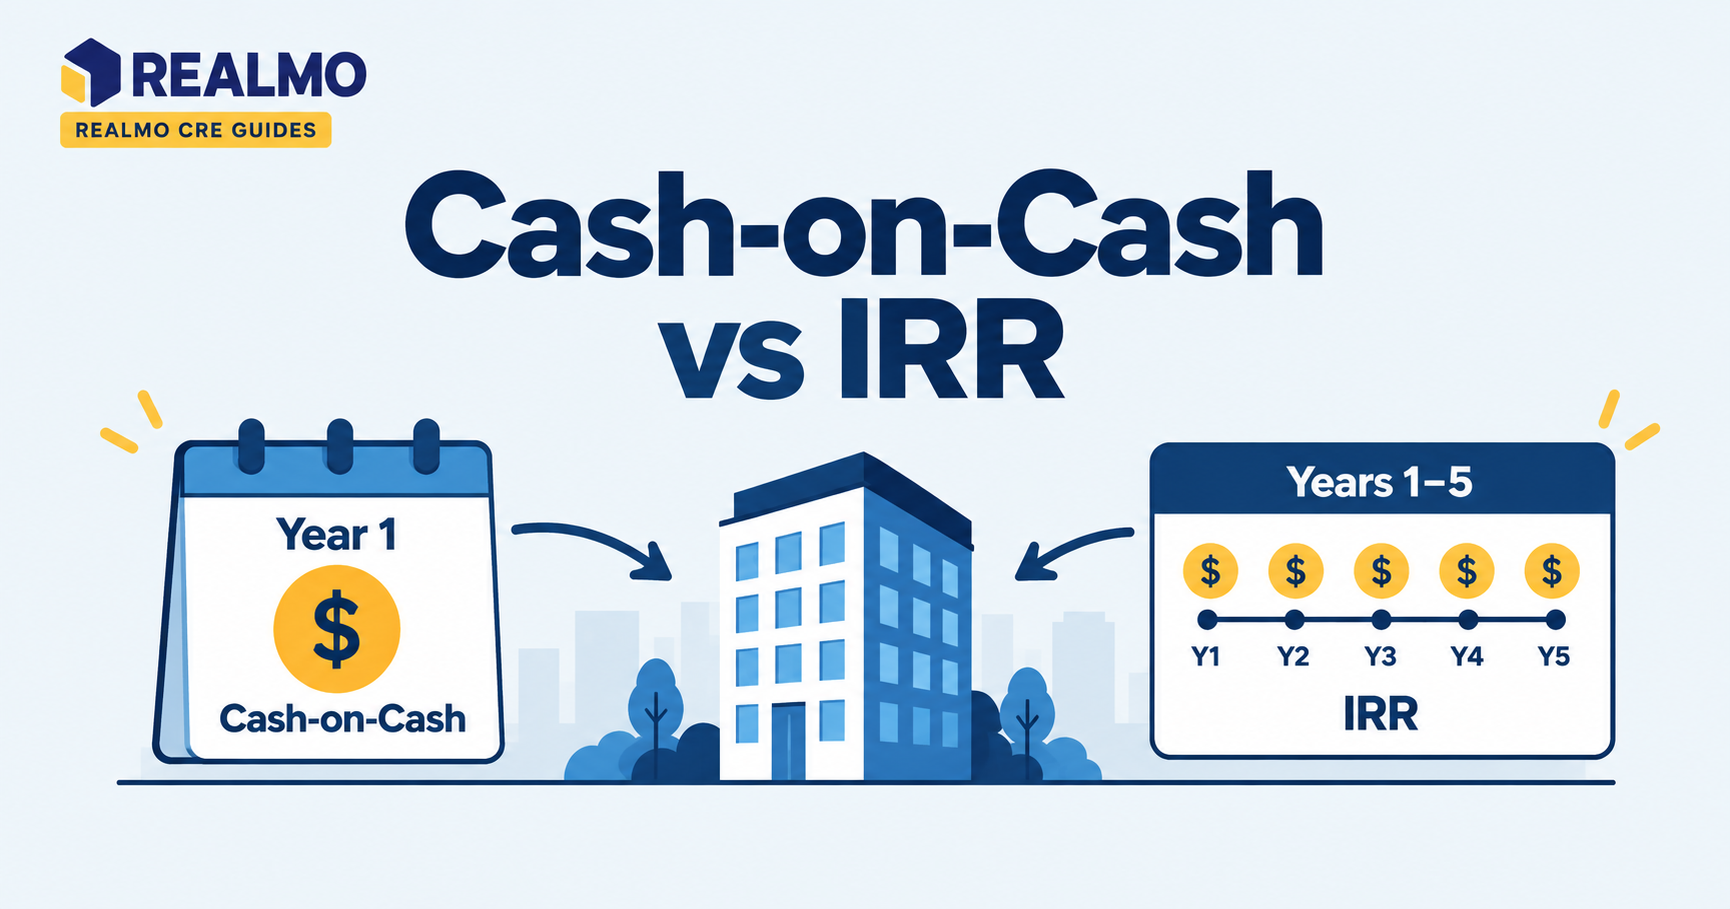
Cash-on-cash return measures annual pre-tax cash flow divided by cash invested in a single year. IRR measures the annualized return across the full hold, including sale proceeds and the timing of every dollar. The cash on cash vs IRR choice comes down to whether you are testing near-term income or total lifetime performance.
Why the difference decides how you underwrite
Two deals can carry identical purchase prices and identical projected profits and still belong to different investors. A stabilized single-tenant net lease building throws off steady distributions from month one but appreciates slowly. A half-vacant flex property produces almost nothing for two years, then jumps once the leasing plan works.
Cash-on-cash ranks the first deal higher. IRR frequently ranks the second higher, because it credits the large exit payment and penalizes only the delay. Neither metric is lying. They answer different questions.
If you need distributions to cover living expenses or to service a personal obligation, the timing of cash matters more than the total. If you are compounding capital across a portfolio and can wait, the total matters more than its shape. Investors who quote only one number in a partnership discussion usually end up arguing about the wrong deal.
How cash-on-cash return is calculated
Cash-on-cash return divides annual before-tax cash flow by total cash invested:
Cash-on-Cash Return = Annual Before-Tax Cash Flow ÷ Total Cash Invested
Annual before-tax cash flow is net operating income minus annual debt service. Total cash invested is the down payment plus closing costs, loan fees, and any capital contributed at acquisition, not the purchase price.
The metric is a snapshot. It describes one year and says nothing about what happens before or after that year. Underwriters calculate it for year one, then again for a stabilized year once lease-up or renovation is complete. This is because those two figures diverge sharply.
Two structural quirks matter. Cash-on-cash ignores principal paydown, so an amortizing loan builds equity the metric never records. And because the denominator is equity rather than total price, more leverage raises cash-on-cash as long as the loan constant (annual debt service divided by loan amount) stays below the property’s unlevered yield. That relationship is why cash-on-cash comparisons only work between deals with similar capital structures. See how leverage affects returns for the mechanics of positive and negative leverage.
Cash-on-Cash vs IRR Calculator
Compare annual cash yield with the total annualized return of a real estate investment, including the timing of cash flows and sale proceeds.
Investment Assumptions
Return Comparison
| Period | Operating Cash Flow | Sale Proceeds | Total Cash Flow |
|---|
Disclaimer: This calculator is provided for informational and educational purposes only. The results are estimates based on the assumptions and inputs provided and should not be considered financial, investment, tax, legal, or real estate advice. Actual returns may vary due to changes in property income, financing terms, operating expenses, capital expenditures, taxes, market conditions, transaction costs, and sale proceeds. Users should independently verify all assumptions and consult qualified financial, tax, legal, and real estate professionals before making investment decisions.
How IRR accounts for timing
IRR is the discount rate that sets the net present value of all cash flows , acquisition outflow, periodic distributions, capital calls, and sale proceeds , to zero. There is no closed-form solution; spreadsheets solve it iteratively.
The timing sensitivity is the whole point. A dollar received in year one is worth more than the same dollar in year seven, and IRR prices that difference automatically. This is also its weakness in practice: because the exit usually dominates the cash flow stream, IRR inherits every assumption baked into the exit cap rate. Move that assumption 50 basis points and the IRR moves materially while the property, the leases, and the rent roll stay exactly the same.
IRR also assumes interim distributions are reinvested at the IRR itself, which rarely happens. When a deal shows an unusually high IRR driven by an early refinance, that assumption becomes aggressive enough that many sponsors report modified IRR (MIRR) alongside it, using a realistic reinvestment rate. And IRR says nothing about size , a short flip returning a small profit can post a higher IRR than a large stabilized asset that generates far more dollars, which is why equity multiple belongs next to it.
Worked example: same deal, two verdicts
All figures below are illustrative and rounded for clarity.
Assume a small retail property purchased for $2,000,000 with $500,000 of cash in (down payment plus closing costs) and a fixed-rate loan. Assume a five-year hold.
Setup
- Year 1 NOI: $130,000
- Annual debt service: $95,000
- NOI grows roughly 3% per year
- Net sale proceeds after loan payoff and selling costs in year 5: $760,000
Step 1, Year-one cash flow $130,000 − $95,000 = $35,000
Step 2, Year-one cash-on-cash $35,000 ÷ $500,000 = 7.0%
Step 3, The full stream Year 0: −$500,000 Year 1: $35,000 Year 2. $39,000 Year 3. $43,000 Year 4: $47,000 Year 5: $52,000 + $760,000 = $812,000
Step 4, IRR Solved iteratively (=IRR() in a spreadsheet), this stream returns roughly 16%.
How to read it: the 7.0% describes the checks the property writes while you hold it. The 16% describes what the whole five years produced, and most of the gap comes from the exit , appreciation plus five years of principal paydown, neither of which cash-on-cash captures. Change only the assumed sale price and cash-on-cash does not move at all while IRR swings several points.
Common error: comparing a year-one cash-on-cash against a stabilized-year figure from another deal. Value-add properties show weak year-one numbers by design. Compare the same year in the hold period, or compare stabilized to stabilized.
When cash-on-cash is the better metric
Use cash-on-cash when the property is stabilized, the hold is open-ended, and income is the objective. It works well for net lease assets, small multifamily held indefinitely, and any situation where the investor cares whether distributions cover a specific obligation.
It is also the honest metric for debt sizing conversations. Lenders think in coverage, and cash-on-cash sits close to the same arithmetic , see debt service coverage ratio for the lender’s version of the same question. Because it requires no exit assumption, cash-on-cash is much harder to manipulate.
When IRR is the better metric
Use IRR when the deal has a defined hold, a planned exit, and a cash flow profile that changes over time. Value-add repositioning, development, lease-up, and any structure with a promote or waterfall belongs in an IRR framework, because those structures are defined by timing.
IRR is also the only reasonable way to compare deals of different durations. A three-year and a ten-year hold cannot be ranked by any single-year yield. Partnership documents nearly always express preferred returns and promote hurdles in IRR terms, so sponsors and limited partners need it whether or not they trust the exit assumption.
Reading both metrics together
Experienced underwriters rarely choose. They run cash-on-cash by year, IRR for the hold, and equity multiple to check scale, then look at where the three disagree.
A deal with strong cash-on-cash and weak IRR is an income asset with limited upside, fine if that is what you wanted. Strong IRR with weak early cash-on-cash means the return depends on execution and exit, so stress-test the exit cap rate before committing. Strong IRR with a low equity multiple usually means a short hold; the annualized rate looks impressive, but the dollars are small.
When you screen listings, pull the operating assumptions before the return figures. Realmo’s property analytics show ownership records, valuation, and current-versus-suggested use, which lets you rebuild both metrics from your own assumptions instead of accepting a broker’s.
Common mistakes investors make with both metrics
Comparing cash-on-cash across different leverage levels. A 12% cash-on-cash on 80% leverage and an 8% on 50% leverage are not comparable. The higher figure carries materially more risk of a shortfall when NOI dips.
Treating IRR as a promise. IRR is an output of assumptions, not a projection of results. The sale price assumption alone can move it several hundred basis points.
Ignoring capital expenditures in cash-on-cash. Roof replacements and TI/LC obligations consume real cash. Excluding them inflates the metric and produces a distribution schedule the property cannot fund.
Chasing IRR through a short hold. Shortening the hold raises IRR mechanically while shrinking total profit and adding transaction costs on both ends.
Using one metric in partnership negotiations. A sponsor optimizing for IRR and an investor optimizing for current distributions will structure the waterfall badly if neither states which one they mean.
Related terms
Net operating income (NOI) · Cap rate · Equity multiple · Debt service coverage ratio · Exit cap rate · Preferred return and waterfall structures · Levered vs unlevered returns
FAQs
Is a good cash-on-cash return the same across property types?
No. Expectations vary by asset class, leverage, and market. Net lease assets produce lower but more predictable cash-on-cash than value-add multifamily, because the risk profile differs. Compare a deal against similar assets with similar debt, not against a universal benchmark.
Can IRR be higher than cash-on-cash?
Usually, in a deal that appreciates. IRR includes sale proceeds and principal paydown, which cash-on-cash excludes entirely. If IRR falls below year-one cash-on-cash, the model is assuming the property loses value or income declines over the hold.
Which metric do lenders care about?
Neither directly. Lenders underwrite debt service coverage, loan-to-value, and debt yield, since their concern is whether the property services the loan. Cash-on-cash is closer to their arithmetic because it sits below debt service, but it is a borrower’s metric.
What is a reasonable hold period assumption for IRR?
Five to ten years is the standard range in institutional underwriting, aligned with typical loan terms and lease cycles. Shorter assumed holds inflate IRR; longer holds dilute it. State the assumption explicitly whenever you quote the figure.
Should I use before-tax or after-tax figures?
Both metrics are conventionally quoted before tax, so they stay comparable across investors. After-tax returns depend on MACRS depreciation, entity structure, and personal circumstances. Consult a licensed tax professional before relying on after-tax figures in a decision.