Cap Rate Compression: Why It Happens
Cap rate compression is a decline in prevailing capitalization rates across a market, sector, or asset class, which raises values for the same net operating income. It happens when competition for a limited pool of assets, cheaper debt, stronger expected rent growth, or lower perceived risk pushes buyers to accept a lower going-in yield.
Why compression decides deals you never bid on
An investor holding a stabilized single-tenant retail asset hears that similar properties in the submarket traded 75. Basis points tighter than the deal signed two years earlier. Nothing changed inside the building: same tenant, same rent, same lease term. The value moved anyway, because the market repriced the income stream rather than the income.
That gap drives real decisions. It changes the appraised value supporting a refinance, the equity a seller can pull out, and whether a buyer’s underwriting still works after paying a lower yield on day one. It also sets the trap on the exit side. An investor who assumes the same compression continues through a five-year hold is projecting a market condition, not an operating plan, and that assumption frequently carries more of the projected return than the business plan does.
What compression measures, and what it doesn’t
A capitalization rate is net operating income divided by value. When the cap rate falls and NOI stays flat, the denominator repricing does all the work: buyers now pay more per dollar of income. Compression is quoted in basis points, where 100 basis points equals one percentage point, so a move from 6.00% to 5.50% is 50 basis points of compression.
Two things compression does not measure. It says nothing about whether a specific property performs better, since compression is a market-level phenomenon that an individual asset either participates in or misses. It also says nothing about cash flow, because a compressed cap rate lowers the yield a new buyer receives while leaving the seller’s original yield on cost untouched. Owners gain value on paper; buyers accept less current return in exchange for whatever they expect to happen next.
Four forces that drive cap rate compression
Capital competition. When more equity chases a fixed supply of investable assets, the marginal buyer wins by accepting a lower return. Sectors that attract institutional allocations compress first, because that capital must be placed within a defined period and cannot wait indefinitely for pricing to improve.
The cost and availability of debt. Cap rates trade at a spread over long-term risk-free rates, benchmarked to U.S. Treasury yields. When borrowing costs fall or lenders widen proceeds, positive leverage becomes achievable at lower cap rates, and buyers can bid tighter without breaking their debt service coverage ratio constraints. Credit availability matters as much as price; a market with active lenders compresses faster than one where financing is rationed.
Expected NOI growth. A cap rate is a snapshot of year-one income, so buyers who expect rents to rise will pay a low going-in yield to capture a higher yield later. Sectors with short lease terms and tight vacancy reprice the fastest, because rent growth reaches the income statement sooner.
Falling perceived risk. Longer lease terms, stronger tenant credit, deeper buyer pools, and better data on a submarket all reduce the risk premium buyers demand. This is why the same building can support a lower cap rate after a credit tenant signs a long extension. Without a dollar of additional rent.
How a small cap rate move swings value
Because value equals NOI divided by the cap rate, the relationship is inverse and non-linear. The same 50 basis points of compression produces a larger percentage value gain at a low starting cap rate than at a high one, since the denominator shrinks by a larger proportion. Compression from 8.00% to 7.50% adds about 6.7% to value; the same move from 5.00% to 4.50% adds about 11.1%.
That asymmetry cuts both ways. Assets priced at low cap rates gain the most when the market tightens and lose the most when it turns. This is why sensitivity tables around the exit assumption matter more for premium assets than for high-yield ones.
Worked example: 50 basis points of compression
All figures below are illustrative round numbers chosen to show the mechanics, not market observations.
Inputs. A stabilized asset produces $600,000 of NOI. It is acquired at a 6.00% cap rate with a loan at 60% loan-to-value.
Step 1, entry value. $600,000 ÷ 0.0600 = $10,000,000. The loan is $6,000,000 and the equity is $4,000,000.
Step 2, apply compression. The market moves to 5.50% with NOI unchanged: $600,000 ÷ 0.0550 = $10,909,091. Value rises $909,091, or 9.1%.
Step 3, measure the effect on equity. With the loan balance unchanged, equity value moves from $4,000,000 to $4,909,091, a gain of 22.7%. Debt magnifies the value change into a much larger swing in equity.
Step 4 , separate income from repricing. Suppose NOI also grows to $650,000 over the hold and the asset sells at 5.50%: $650,000 ÷ 0.0550 = $11,818,182. Holding the cap rate at 6.00%, NOI growth alone would produce $10,833,333. So roughly $833,000 of the gain came from operations and roughly $985,000 came from cap rate compression, before selling costs.
How to interpret it. More than half of the value creation in that scenario is market timing, not asset management. An underwriting model that does not run this split cannot tell whether the business plan works or. Whether the projected internal rate of return depends on conditions outside the sponsor’s control.
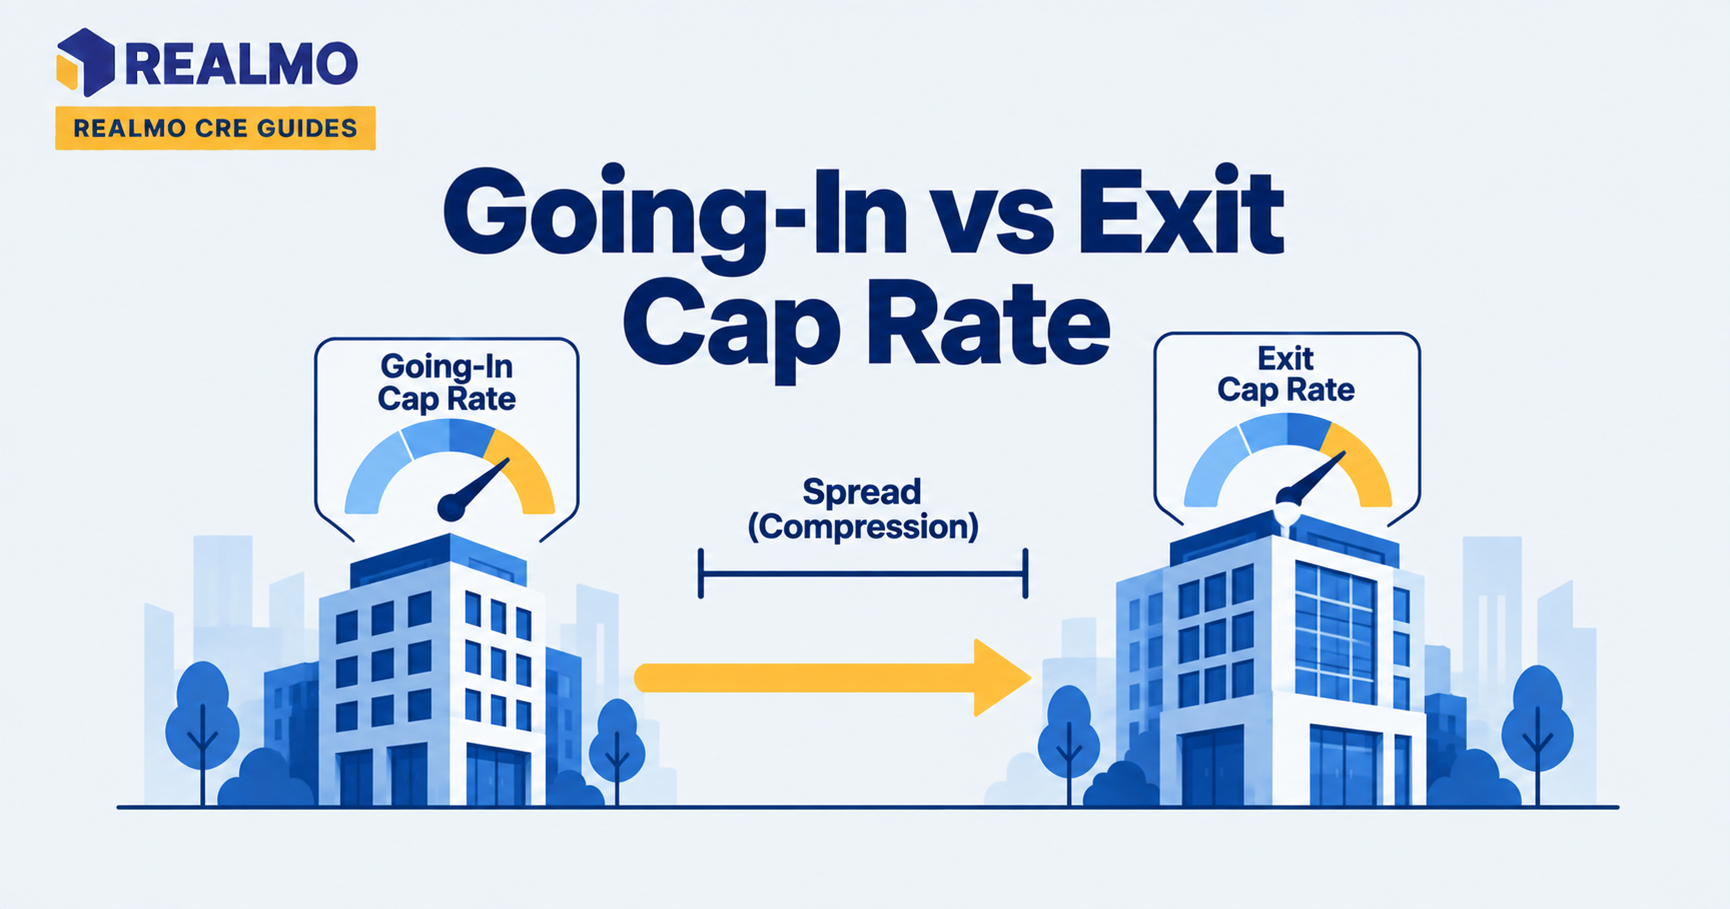
The common error. Modeling an exit cap rate below the entry cap rate. Standard practice runs the exit at or slightly above the going-in rate to account for the asset being older at sale. Then tests the downside separately.
Why compression is uneven across sectors
Compression rarely arrives evenly. Property types with long leases and investment-grade tenants (rated BBB-/Baa3 or higher by S&P, Moody’s, or Fitch) in prevailing market practice trade at lower cap rates than short-lease, management-intensive assets in the same market, because the income is more predictable and the buyer pool is deeper. Within a sector, newer construction in a supply-constrained submarket compresses further than older product on a secondary corridor, even a few miles apart.
Liquidity is the underrated variable. Markets with many active buyers and reliable transaction data support tighter pricing because exit risk is lower, while thin markets carry a permanent premium for the possibility that no bidder appears when the seller needs one. Comparing an asset’s implied cap rate against ownership records and valuation data for similar properties across multiple submarkets, which Realmo publishes without a paywall, is the practical way to tell a genuine market shift from one aggressive comparable sale.
What makes cap rates expand again
Every driver of compression works in reverse. Rising borrowing costs break positive leverage and force bids down. Capital that pulls back from a sector removes the marginal buyer who set the tightest pricing. New supply that slows rent growth erases the forward-yield argument. Tenant credit deterioration or structural questions about a sector’s demand raise the risk premium directly.
Expansion tends to move faster than compression, because sellers anchor on prior pricing and transaction volume dries up before values visibly reset. During that lag, reported comparable sales reflect a market that no longer exists. This is why appraisals and broker opinions can trail the bid by several quarters.
Common mistakes with compression assumptions
- Treating compression as a business plan. If the model’s returns disappear at a flat exit cap, the strategy is a bet on market direction, and it should be labeled that way to investors.
- Ignoring the NOI-versus-repricing split. Without the attribution, a sponsor cannot tell whether execution worked, and repeats a strategy that succeeded for reasons unrelated to the plan.
- Applying one market’s compression to another. Sector and submarket pricing move at different speeds, and importing a tighter rate from a deeper market overstates value.
- Reading a single trade as a trend. One buyer with a 1031 deadline or a strategic adjacency can pay through the market, producing a comparable that misleads every underwriting that uses it.
- Forgetting capital expenditures. Cap rates apply to NOI, which sits above capital reserves, so two assets at the same compressed rate can deliver very different cash to the owner.
Related terms
Capitalization rate · Net operating income · Exit cap rate · Yield on cost · Debt service coverage ratio · Internal rate of return · Comparable sales analysis · Positive leverage
FAQ
What does cap rate compression mean in simple terms?
It means buyers are paying more for the same income. If a property produces unchanged net operating income but sells at a lower capitalization rate, the price rises. Compression describes that market-wide repricing, measured in basis points, and it reflects competition, financing conditions, and expected growth rather than any improvement inside the building.
Is cap rate compression good or bad for investors?
It depends on which side of the trade you are on. Existing owners gain value and refinancing capacity. Buyers accept a lower initial yield and take on more sensitivity to future rate movements. The same compression that rewards a seller narrows the margin for error on the acquisition.
How much does 50 basis points of compression change value?
The percentage gain depends on the starting cap rate because the relationship is inverse. Moving from 6.00% to 5.50% raises value about 9.1%, while moving from 8.00% to 7.50% raises it about 6.7%. Lower starting cap rates produce larger percentage swings from an identical basis-point move.
Should I underwrite compression into my exit cap rate?
Standard practice sets the exit cap at or slightly above the going-in rate. This is because the asset is older at sale and future market conditions are unknown. Compression can be tested as an upside case, but returns that require it are dependent on market direction. Discuss deal-specific assumptions with your own licensed advisors.
What is the difference between cap rate compression and cap rate expansion?
Compression is falling cap rates and rising values; expansion is the reverse. Expansion follows higher borrowing costs, capital withdrawal, or weakening fundamentals. And it usually shows up in reported values more slowly than in bids, because sellers hold prior pricing expectations.