Cap Rate vs ROI: What’s the Difference
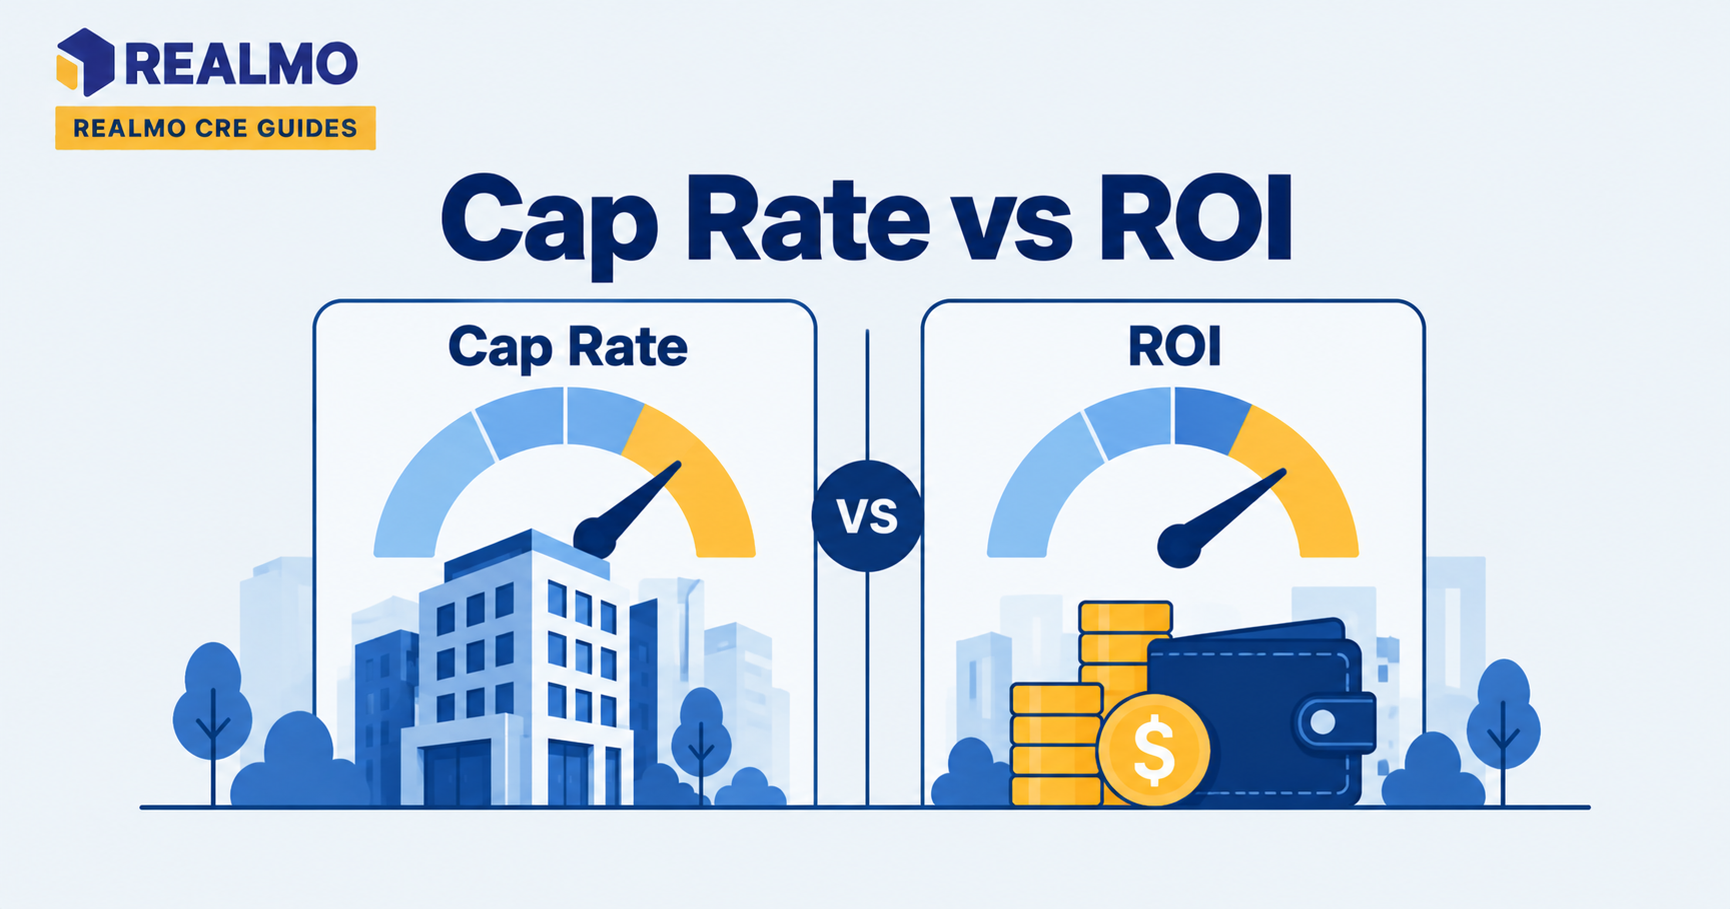
Cap rate vs ROI comes down to what each measures. Cap rate measures a property’s unleveraged annual return, net operating income divided by price, at a single moment in time. ROI measures the return on the cash you actually invested, after debt, capital costs, and the length of the hold.
Why investors confuse these two numbers
A broker sends you an offering memorandum with a 7% cap rate on the cover. You run your own model with a loan on it and your cash return comes out closer to 4.5%. Nothing was misrepresented. The two figures answer different questions: the cap rate priced the building, and your return priced your deal.
That gap decides real outcomes. Two buyers can compete for the same asset at the same cap rate and earn very different returns, because one puts down 40% and the other pays cash, one holds three years and the other fifteen, one budgets a roof replacement in year two and the other doesn’t. If you screen deals on cap rate alone, you are comparing assets. If you underwrite on return, you are comparing your position in those assets. Buying decisions need both.
What cap rate measures and what it ignores
Cap rate is net operating income divided by property value or purchase price. NOI includes rental revenue and other income, minus operating expenses, taxes, insurance, management, and reserves. It excludes debt service, depreciation, capital expenditures, income taxes, and any proceeds from a future sale.
Because it excludes financing, cap rate is a property-level number. It describes the asset, not the buyer. That is exactly why the market uses it as a pricing yardstick: it lets you compare a leased warehouse in one submarket against another without knowing anything about either owner’s loan terms. It is also a snapshot , a single year’s income against a single price. It says nothing about year three.
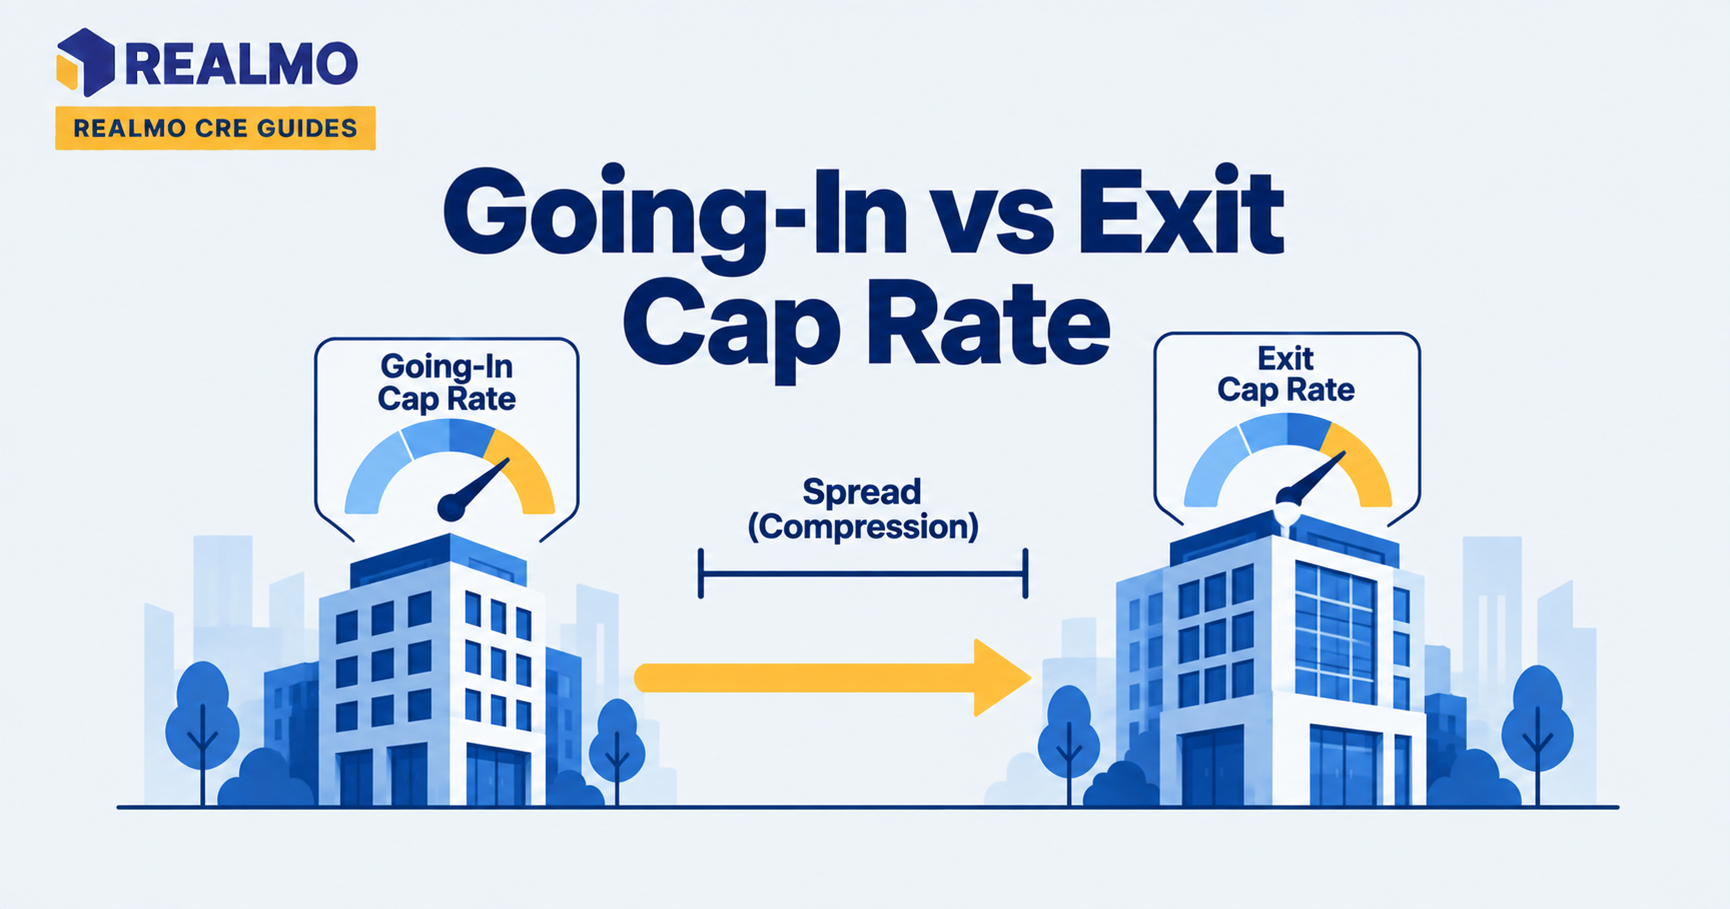
Two conventions matter here. Going-in cap rate uses the buyer’s first-year projected NOI over the purchase price. Exit cap rate is the rate you assume a future buyer will pay when you sell, and it usually drives more of your modeled profit than anything else in the spreadsheet.
What ROI measures and why it varies by investor
Return on investment is profit divided by the money you put in. In commercial real estate the term is used loosely, which is where the trouble starts. The three common versions:
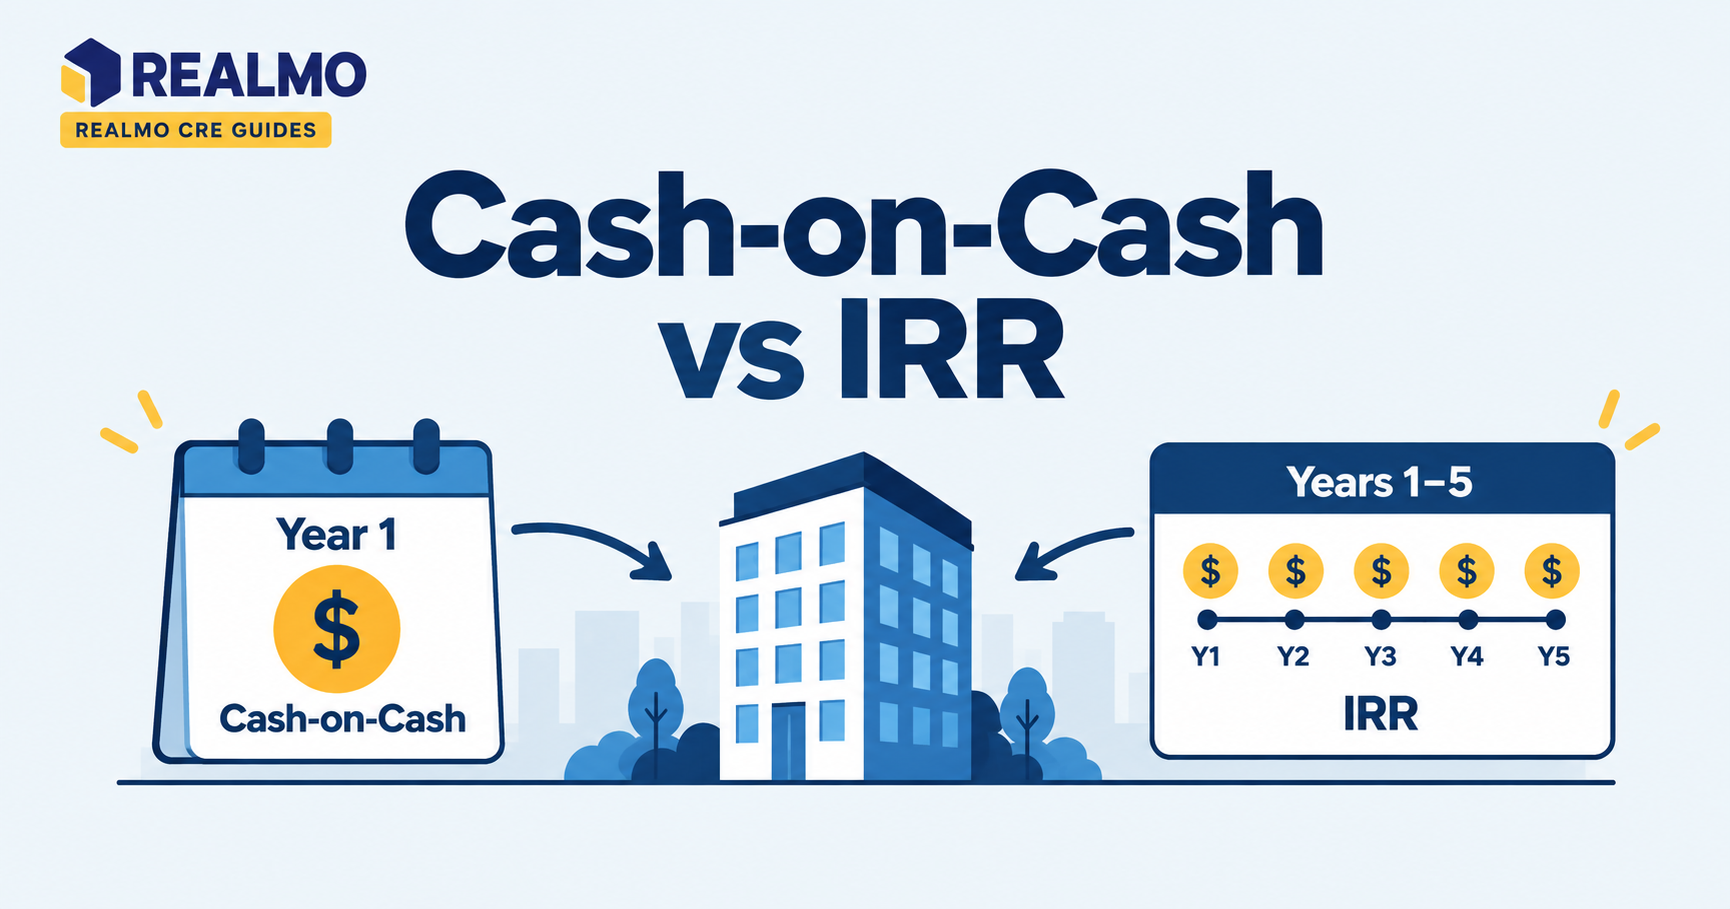
Cash-on-cash return divides annual pre-tax cash flow after debt service by total cash invested. It is the “ROI” most investors mean when discussing a single year.
Total ROI divides cumulative profit, operating cash flow plus net sale proceeds minus equity invested, by equity invested across the entire hold. It captures appreciation and principal paydown but ignores when the money arrived.
Internal rate of return discounts every cash flow to present value and solves for the annualized rate. It handles timing, which the other two do not, and is the standard for partnership-level reporting.
Unlike cap rate, all three depend on your loan, your equity, your hold period, and your capital plan. Same building, different investors, different answers.
Cap rate vs ROI: the four differences that matter
Leverage is the first. Cap rate assumes an all-cash purchase; ROI reflects your actual capital stack.
Time is the second. Cap rate is one year. ROI spans the hold and, in IRR form, weights early dollars more than late ones.
Scope is the third. Cap rate stops at NOI. ROI continues through debt service, capital expenditures, leasing costs, and sale proceeds.
Purpose is the fourth. Cap rate is a pricing and comparison tool used by the whole market. ROI is a decision tool used by one investor deciding whether this deal beats the next one.
Cap Rate vs ROI Calculator
Compare the property’s cap rate with total ROI over the full investment hold.
Property & Financing
Results
| Metric | Result | What It Includes |
|---|---|---|
| Cap Rate | 0.0% | Year 1 NOI and purchase price |
| Total ROI | 0.0% | Debt, initial costs, operating cash flow and sale |
Disclaimer: This calculator is provided for informational and educational purposes only. The results are estimates based on the assumptions and inputs provided and should not be considered financial, investment, tax, legal, or real estate advice. Actual returns may vary due to changes in property income, financing terms, operating expenses, capital expenditures, taxes, market conditions, transaction costs, and sale proceeds. Users should independently verify all assumptions and consult qualified financial, tax, legal, and real estate professionals before making investment decisions. The calculator does not guarantee any investment outcome.
How leverage separates the two numbers
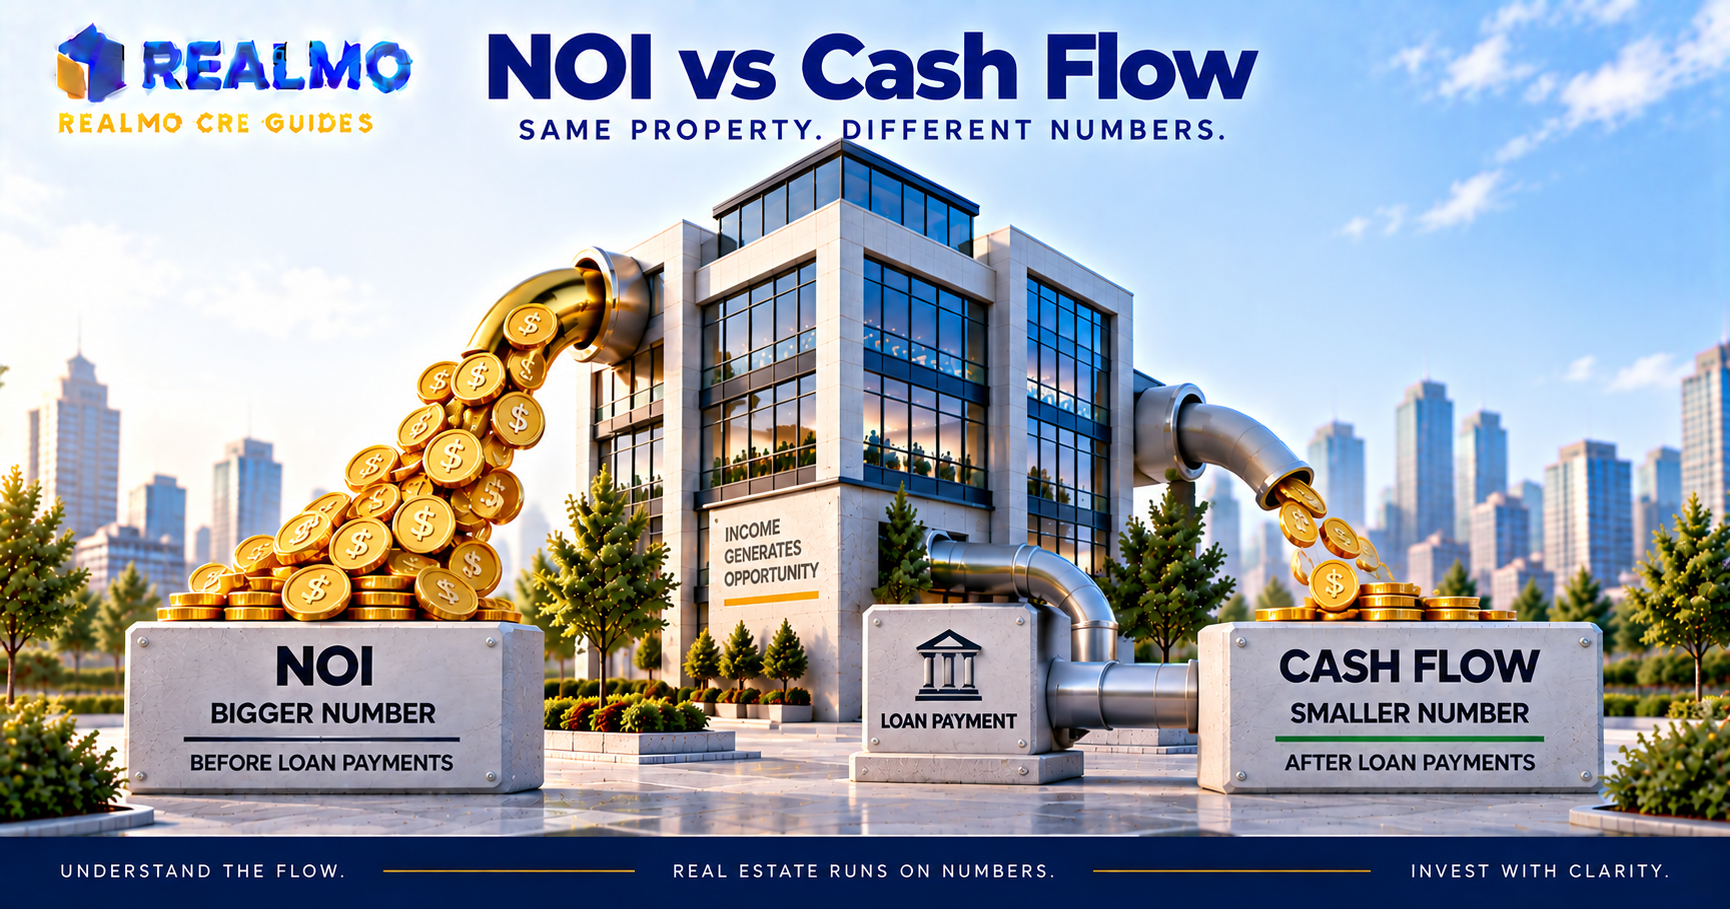
Compare the cap rate to the loan constant , annual debt service divided by loan amount. When the cap rate exceeds the constant, borrowing lifts your cash-on-cash return above the cap rate. That is positive leverage. When the constant exceeds the cap rate, debt drags your return below the cap rate. That is negative leverage, and it appears whenever borrowing costs rise faster than asset yields.
Negative leverage is not automatically a mistake. Investors accept it when they expect NOI to grow into the debt through lease-up, rent rollover, or repositioning. It becomes a mistake when it is unintentional, when the pro forma assumes growth the rent roll cannot support.
Worked example: same building, two answers
All figures below are illustrative and rounded, chosen to show the mechanics rather than to reflect any current market.
Assume a purchase price of $2,000,000 and first-year NOI of $140,000. The going-in cap rate is $140,000 ÷ $2,000,000 = 7.0%.
Now add financing. Assume a hypothetical loan of $1,300,000 (65% LTV) at a 6.5% fixed rate on a 25-year amortization schedule. Annual debt service is roughly $105,300, giving a loan constant of 8.1%, above the 7.0% cap rate, so this deal carries negative leverage.
Cash flow after debt service: $140,000 − $105,300 = $34,700. Total cash invested is $700,000 of equity plus $60,000 of closing and initial capital costs, or $760,000. Cash-on-cash return is $34,700 ÷ $760,000 = 4.6%.
Now hold five years. Assume NOI grows to $155,000, you sell at the same 7.0% cap for $2,214,000, pay 2% in selling costs, and the loan balance has amortized to about $1,177,000. Net sale proceeds are roughly $992,700. Add cumulative operating cash flow of about $190,000 over the five years.
Total profit = ($992,700 − $760,000) + $190,000 = $422,700. Total ROI = $422,700 ÷ $760,000 = 55.6% over five years.
One asset, three legitimate numbers: 7.0% cap rate, 4.6% cash-on-cash, 55.6% total ROI. Interpretation: the asset is priced at 7%, the debt is expensive relative to that yield, and most of the profit comes from amortization and NOI growth rather than current cash flow. The common error is reading the 55.6% as an annual figure. It is not , it is a cumulative five-year result, and it ignores income taxes entirely.
When to use cap rate and when to use ROI
Use cap rate to screen and to price. Comparing offerings in the same market, testing an asking price against recent comparable sales, or estimating value from NOI. Realmo's property analytics show estimated value, cap rate, and ownership records across 9M+ properties, which makes that first screen faster than assembling comps by hand.
Use ROI to decide: after you have a term sheet, a capital plan, and a hold assumption. Cap rate tells you whether the price is defensible. ROI tells you whether the deal clears your own return threshold.
Common mistakes with cap rate and ROI
- Comparing a seller's pro forma cap rate to your own trailing figure. Pro forma NOI assumes full occupancy and market rents. The consequence is overpaying by the difference between assumed and actual income, capitalized.
- Leaving reserves out of NOI. Excluding replacement reserves inflates NOI, inflates the cap rate, and hides capital costs that hit cash flow in year two.
- Quoting total ROI as if it were annual. A 55% five-year return sounds like it beats a 12% annual return. It does not.
- Ignoring the loan constant. Investors discover negative leverage after closing, when cash-on-cash lands below the cap rate they underwrote to.
- Treating exit cap rate as a formality. A modest change in the assumed exit cap moves total ROI more than a full year of rent growth.
Tax treatment materially changes after-tax returns; consult a licensed CPA or tax attorney on your own situation.
Related terms
- Net Operating Income (NOI)
- Cash-on-Cash Return
- Internal Rate of Return (IRR)
- Debt Service Coverage Ratio (DSCR)
- Exit Cap Rate
- Equity Multiple
- Pro Forma Analysis
FAQ
Is a higher cap rate always better?
No. A higher cap rate usually signals higher perceived risk, shorter lease terms, weaker tenant credit, older construction, or a softer submarket. Buyers accept a lower cap rate for stable, long-leased, credit-tenant assets. The right question is whether the cap rate compensates you for the specific risks in that rent roll.
Can cap rate and ROI ever be the same number?
Yes, in one narrow case: an all-cash purchase held one year with no capital expenditures, no transaction costs, and no sale. Then the cap rate equals the first-year cash-on-cash return. Add debt, closing costs, or a longer hold, and the two separate immediately.
Which number do lenders care about?
Lenders underwrite to NOI, debt service coverage ratio, and loan-to-value rather than to your equity return. Cap rate matters to them mainly as a valuation input for the appraisal. Your projected ROI is your concern, not the lender's.
Should I use cash-on-cash or IRR to evaluate a deal?
Use both. Cash-on-cash shows whether the property supports distributions from day one. IRR shows whether the full hold beats alternative uses of the same capital. A deal can have strong IRR driven entirely by an assumed sale price while producing almost no current cash flow.