Best Cities for Real Estate Growth in 2026: The U.S. Markets Rising Fastest

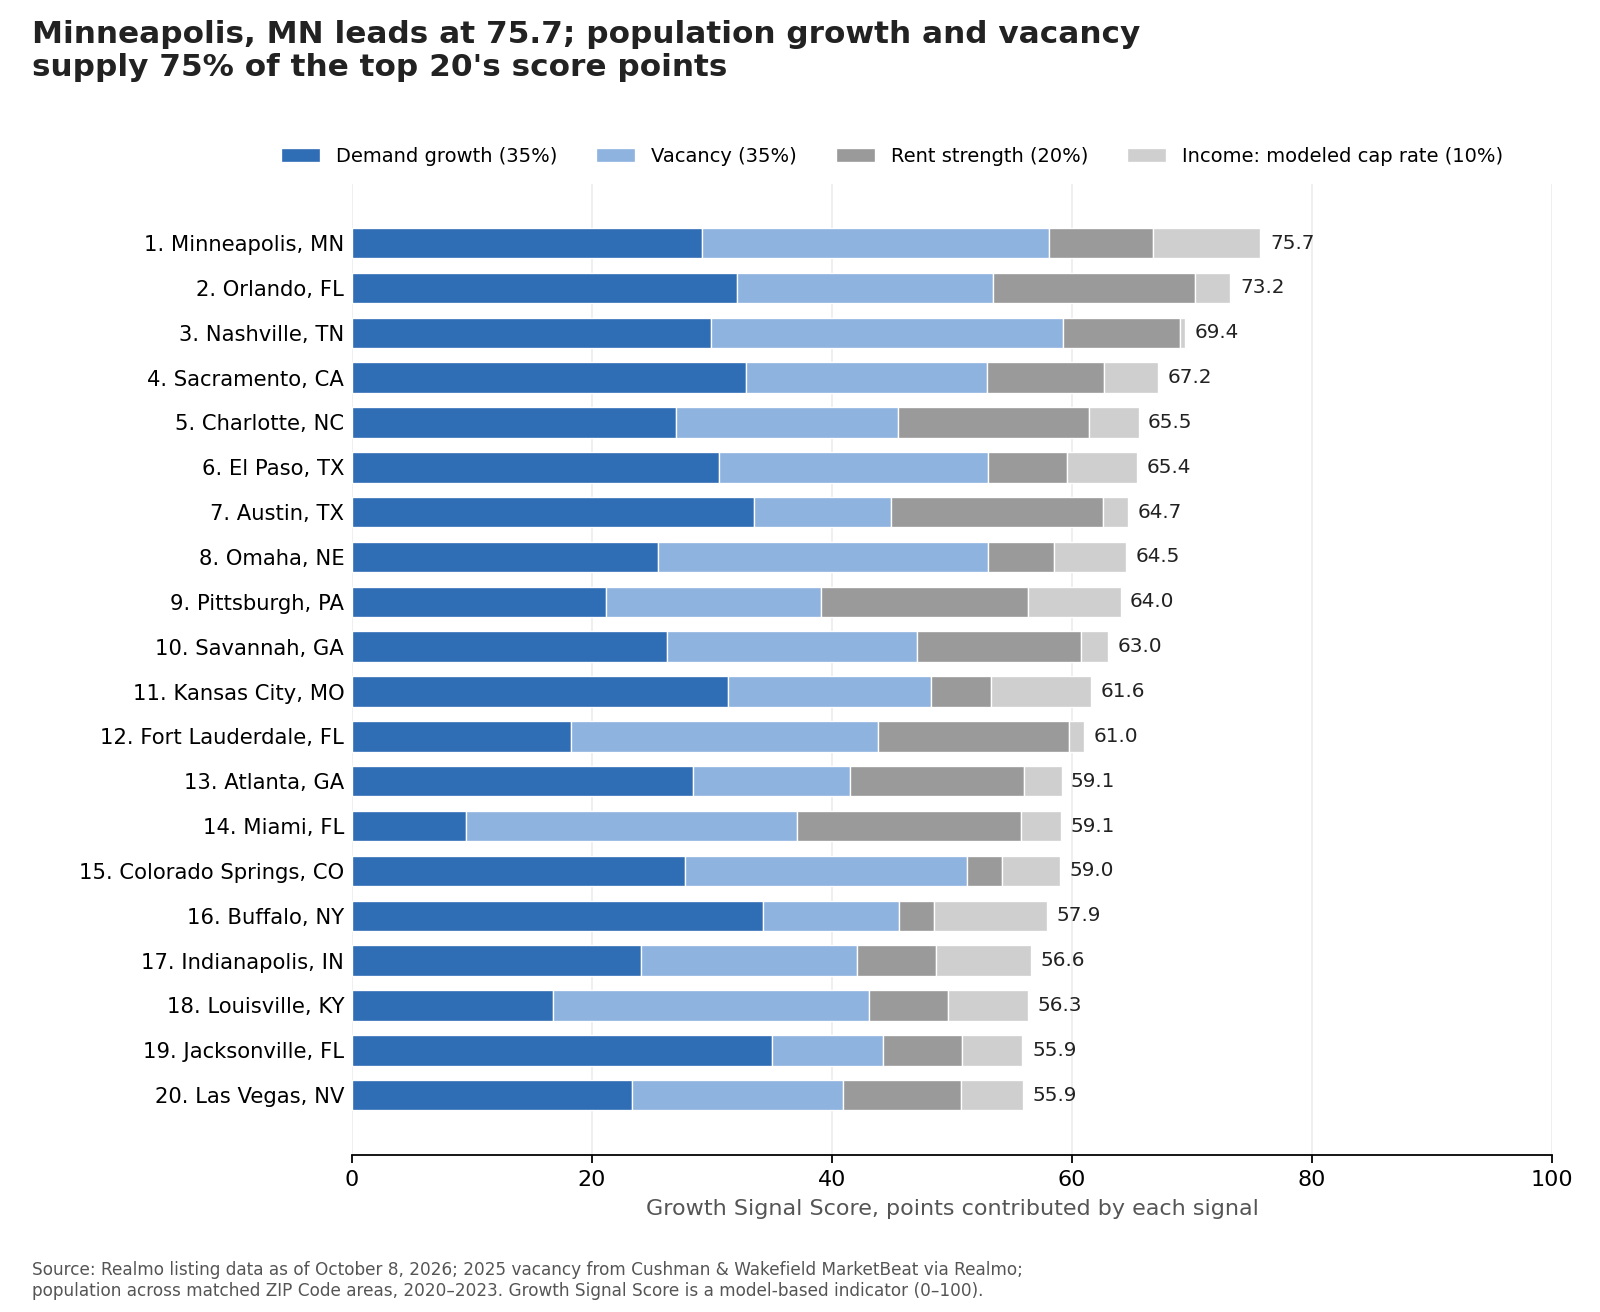
Minneapolis, MN leads the 2026 ranking of the best cities for real estate growth, followed by Orlando, FL, and Nashville, TN. Minneapolis, MN scores 75.7 out of 100 on Realmo’s Growth Signal Score, with 2025 vacancy of 4.4% in retail space and 4.7% in industrial space.
The ranking scores 48 U.S. cities on population growth, sector vacancy, commercial asking rents, and modeled cap rates in the listing data of Realmo, a CRE intelligence platform, as of October 8, 2026 (see how we ranked). Vacancy figures are annual 2025 values. Population growth covers 2020–2023 across each city’s ZIP Code areas, so it’s not a forecast.
Investors looking for the best cities to invest in real estate should read the list as a commercial screen. It covers office, retail, industrial, and multifamily listings. It does not rank single-family rentals or 2–4 unit buildings, and it produces no residential rental yields. For anyone weighing the best places to invest in real estate in 2026, this is a shortlist for underwriting.
Key takeaways
- Minneapolis, MN (75.7), Orlando, FL (73.2) and Nashville, TN (69.4) top the Growth Signal Score, a model-based indicator from 0 to 100.
- 14 of the 20 ranked cities outpaced the U.S. on ZIP-area population growth from 2020 to 2023 (U.S.: +1.5%), and two more matched it.
- Retail is the tightest sector: it posts the lowest 2025 vacancy in 13 of the 20 ranked cities.
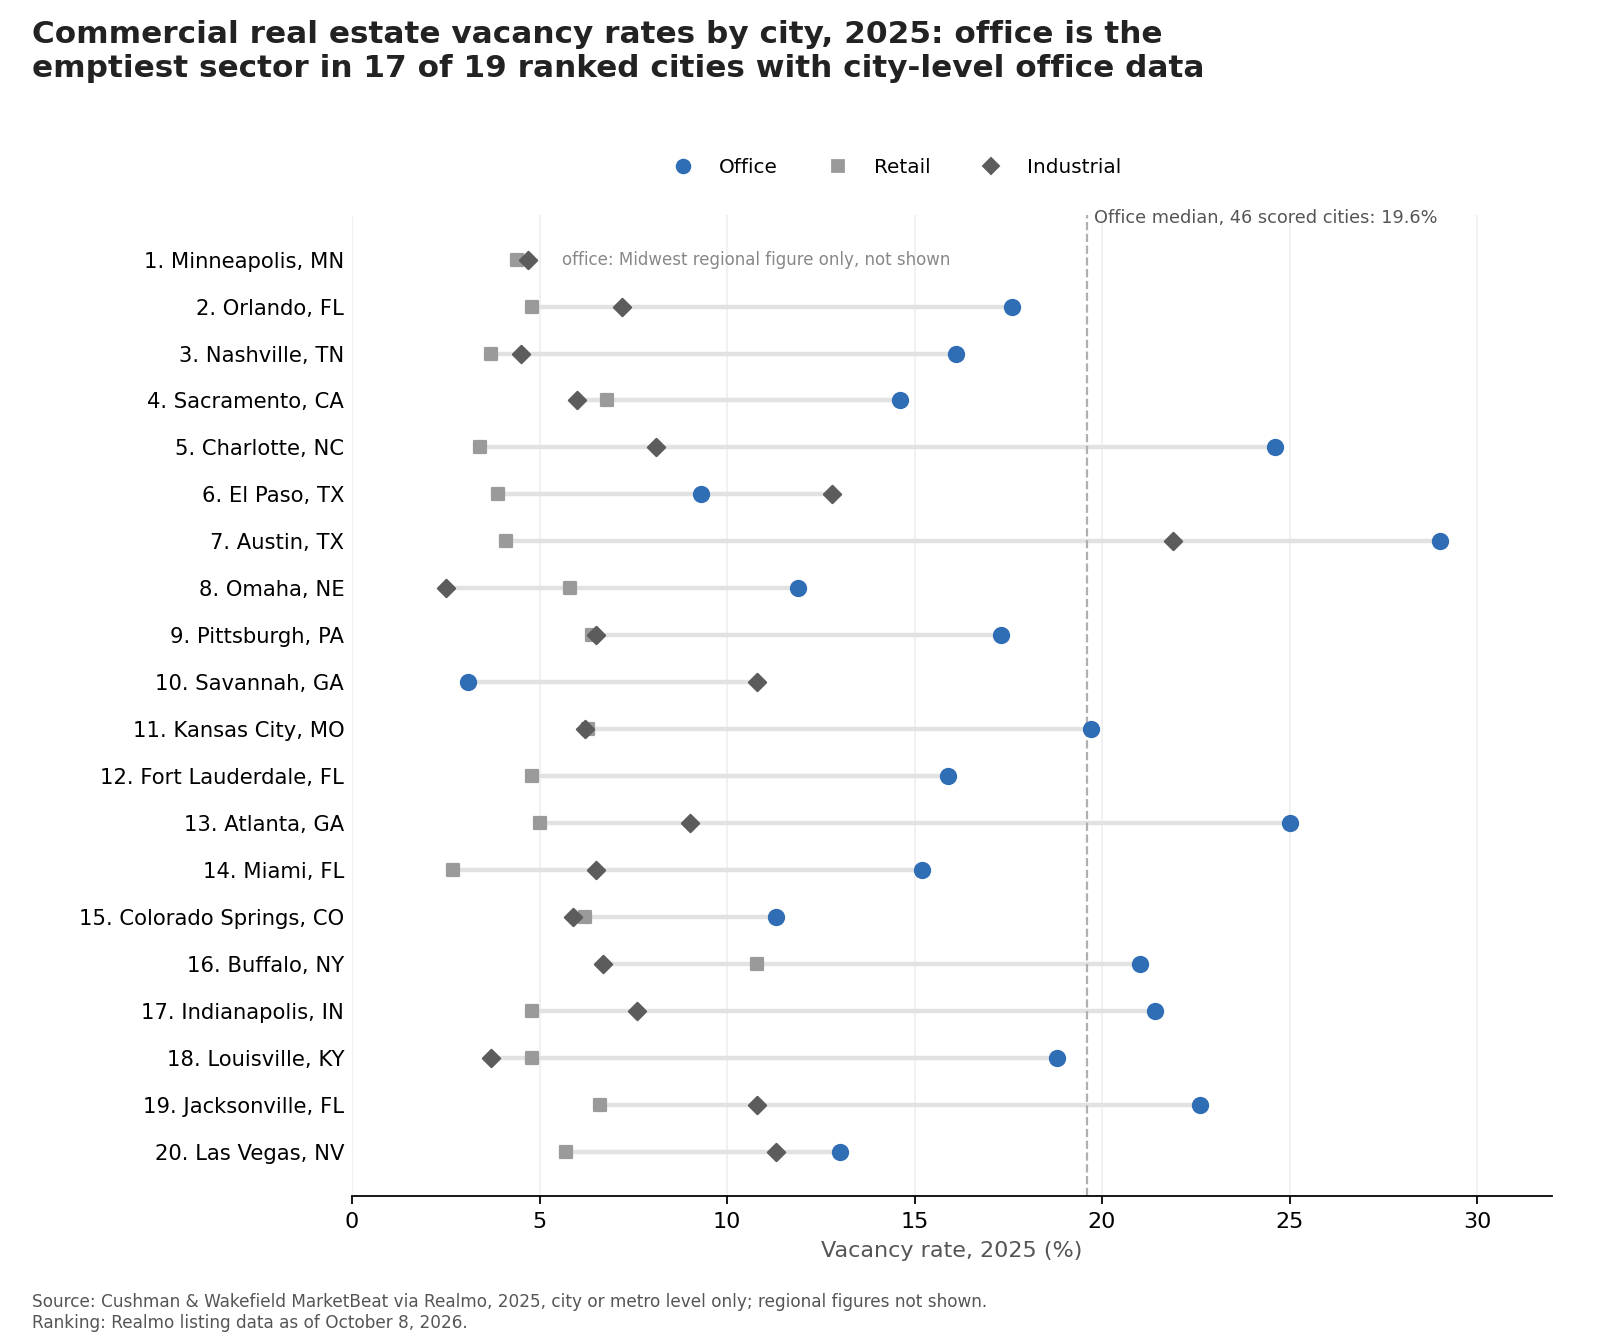
- Office is the emptiest sector in 17 of the 19 ranked cities with city-level office data, from 3.1% in Savannah, GA to 29.0% in Austin, TX.
- Modeled cap rates in the top 20 run from 3.2% in Nashville, TN to 9.5% in Buffalo, NY, vs. 6.1% for the U.S.
The 20 Best Cities for Real Estate Growth in 2026
The 20 cities at the top lean on two signals: population growth and low retail or industrial vacancy. Their median ZIP-area population growth was 2.4% from 2020 to 2023, vs. 1.5% for the U.S., and 14 of the 20 beat the national rate. Lists of the fastest-growing cities in the US rank on residents alone; this score weighs growth against vacancy, so Jacksonville, FL, the fastest grower of the 48 scored cities, still ranks only 19th. Retail posts the lowest vacancy in 13 of the 20 best commercial real estate markets on this list.
| Rank | City, ST | Growth Signal Score | Median asking rent, $/SF/yr | Population growth, ZIP areas, 2020–2023 | Office vacancy, 2025 | Lowest-vacancy sector, 2025 | Priced listings, sale / lease (n) |
|---|---|---|---|---|---|---|---|
| 1 | Minneapolis, MN | 75.7 | $17.98‡ | +2.5% | regional only | Retail, 4.4% | 344 / 38 |
| 2 | Orlando, FL | 73.2 | $25.50 | +3.1% | 17.6% | Retail, 4.8% | 400 / 171 |
| 3 | Nashville, TN | 69.4 | $24.50‡ | +3.0% | 16.1% | Retail, 3.7% | 123 / 26 |
| 4 | Sacramento, CA | 67.2 | $15.00‡ | +3.4% | 14.6% | Industrial, 6.0% | 166 / 21 |
| 5 | Charlotte, NC | 65.5 | $25.00 | +2.2% | 24.6% | Retail, 3.4% | 83 / 53 |
| 6 | El Paso, TX | 65.4 | $16.00‡ | +3.1% | 9.3% | Retail, 3.9% | 227 / 48 |
| 7 | Austin, TX | 64.7 | $28.00 | +3.5% | 29.0% | Retail, 4.1% | 175 / 147 |
| 8 | Omaha, NE | 64.5 | $15.95 | +1.6% | 11.9% | Industrial, 2.5% | 111 / 255 |
| 9 | Pittsburgh, PA | 64.0 | $26.00 | +1.2% | 17.3% | Retail, 6.4% | 53 / 100 |
| 10 | Savannah, GA | 63.0 | $23.56 | +2.1% | 3.1% | Office, 3.1% | 467 / 112 |
| 11 | Kansas City, MO | 61.6 | $15.85‡ | +3.1% | 19.7% | Industrial, 6.2% | 109 / 44 |
| 12 | Fort Lauderdale, FL | 61.0 | $25.00 | +0.6% | 15.9% | Retail, 4.8% | 325 / 216 |
| 13 | Atlanta, GA | 59.1 | $23.99 | +2.4% | 25.0% | Retail, 5.0% | 172 / 85 |
| 14 | Miami, FL | 59.1 | $30.27 | −1.1% | 15.2% | Retail, 2.7% | 1,070 / 535 |
| 15 | Colorado Springs, CO | 59.0 | $15.00 | +2.4% | 11.3% | Industrial, 5.9% | 139 / 59 |
| 16 | Buffalo, NY | 57.9 | $15.00 | +4.7% | 21.0% | Industrial, 6.7% | 635 / 57 |
| 17 | Indianapolis, IN | 56.6 | $16.00 | +1.5% | 21.4% | Retail, 4.8% | 221 / 95 |
| 18 | Louisville, KY | 56.3 | $16.00 | +0.5% | 18.8% | Industrial, 3.7% | 444 / 243 |
| 19 | Jacksonville, FL | 55.9 | $16.00 | +6.7% | 22.6% | Retail, 6.6% | 397 / 240 |
| 20 | Las Vegas, NV | 55.9 | $12.00‡ | +1.5% | 13.0% | Retail, 5.7% | 243 / 14 |
| – | U.S. | – | $17.15 | +1.5% | – | – | 147,894 / 46,890 |
Note: n counts listings with a single usable asking price or rent; medians are approximate.
‡ Rent median rests on fewer than 50 priced lease listings, so read it as directional.
Vacancy covers office, retail, and industrial at city or metro level only; Minneapolis, MN has office vacancy only as a Midwest regional figure, which is not shown or scored. Ties at one decimal go to the stronger population signal (Atlanta, GA over Miami, FL; Jacksonville, FL over Las Vegas, NV).
Source: Realmo listing data as of October 8, 2026; 2025 vacancy from Cushman & Wakefield MarketBeat via Realmo; population across matched ZIP Code areas, 2020–2023. Compare more U.S. markets in Realmo market analysis.
1. Minneapolis, MN: Sub-5% Retail and Industrial Vacancy
Minneapolis, MN ranks first with a Growth Signal Score of 75.7.
- Growth Signal Score: 75.7
- Median asking rent: $17.98/SF/yr (U.S.: $17.15), directional
- Population growth, ZIP areas, 2020–2023: +2.5% (U.S.: +1.5%)
- Median asking price: $169/SF (U.S.: $151)
- Vacancy 2025: lowest retail 4.4%; highest industrial 4.7%
- Modeled cap rate: 8.5% (U.S.: 6.1%)
- Best for: industrial and retail owner-users; income-focused buyers
Why it ranks: Retail and industrial vacancy give the city the second-best vacancy score of the 48 scored cities. Its 8.5% modeled cap rate is the highest in the top 10.
What to watch: Office vacancy exists only as a 21.3% Midwest regional figure, so office is unscored, and the rent median rests on 38 priced lease listings.
Market depth: The listing data shows 599 for-sale and 367 for-lease listings. Q2 2026 recorded sales included 20 industrial deals, at a median $139/SF on 12 with building size.
Rents, prices, and vacancy are on Realmo’s Minneapolis market page.
2. Orlando, FL: Population Growth Meets $25.50 Asking Rents
Orlando, FL ranks second with a Growth Signal Score of 73.2.
- Growth Signal Score: 73.2
- Median asking rent: $25.50/SF/yr (U.S.: $17.15)
- Population growth, ZIP areas, 2020–2023: +3.1% (U.S.: +1.5%)
- Median asking price: $293/SF (U.S.: $151)
- Vacancy 2025: lowest retail 4.8%; highest office 17.6%
- Modeled cap rate: 4.8% (U.S.: 6.1%)
- Best for: office and retail investors underwriting rent levels
Why it ranks: Orlando, FL pairs 3.1% ZIP-area population growth with the highest median ask in the top five. Office backs the headline rent: the office median asking rent runs $27.36/SF/yr on 117 priced listings, vs. $18.39 for the U.S.
What to watch: The 4.8% modeled cap rate trails the U.S. 6.1%, so asking prices leave less modeled income per dollar.
Market depth: The listing data shows 1,242 for-sale and 913 for-lease listings.
Industrial rents and office, retail, and multifamily prices are in Orlando commercial real estate data from Realmo.
3. Nashville, TN: 3.7% Retail and 4.5% Industrial Vacancy
Nashville, TN ranks third with a Growth Signal Score of 69.4.
- Growth Signal Score: 69.4
- Median asking rent: $24.50/SF/yr (U.S.: $17.15), directional
- Population growth, ZIP areas, 2020–2023: +3.0% (U.S.: +1.5%)
- Median asking price: $338/SF (U.S.: $151)
- Vacancy 2025: lowest retail 3.7%; highest office 16.1%
- Modeled cap rate: 3.2% (U.S.: 6.1%)
- Best for: occupancy-focused retail and industrial owners
Why it ranks: Nashville, TN posts the best vacancy score of the 48 scored cities, with industrial at 4.5% and office at 16.1%.
What to watch: The 3.2% modeled cap rate is the lowest in the top 20, and the rent median rests on 26 priced lease listings, too few to score.
Market depth: The listing data shows 530 for-sale and 350 for-lease listings. Q2 2026 recorded sales included 12 office deals, at a median of $435/SF on 11 with building size.
Realmo tracks vacancy and recent sales in Nashville, with a lease-vs-buy estimate.
4. Sacramento, CA: 3.4% Population Growth, 14.6% Office Vacancy
Sacramento, CA ranks fourth with a Growth Signal Score of 67.2.
- Growth Signal Score: 67.2
- Median asking rent: $15.00/SF/yr (U.S.: $17.15), directional
- Population growth, ZIP areas, 2020–2023: +3.4% (U.S.: +1.5%)
- Median asking price: $261/SF (U.S.: $151)
- Vacancy 2025: lowest industrial 6.0%; highest office 14.6%
- Modeled cap rate: 5.5% (U.S.: 6.1%)
- Best for: office investors and office tenants
Why it ranks: ZIP-area population growth of 3.4% is the fourth-fastest of the 48 scored cities. Office vacancy of 14.6% sits below the 19.6% median for the 46 cities with city-level office data.
What to watch: The rent median rests on 21 priced lease listings, too few to score, so the city gets the median rent score.
Market depth: The listing data shows 625 for-sale and 809 for-lease listings. Q2 2026 recorded sales included 15 industrial deals, at a median of $149/SF.
Asking prices, rents, and recent sales are in Sacramento CRE data from Realmo.
5. Charlotte, NC: Retail Vacancy of 3.4% Anchors the Score
Charlotte, NC ranks fifth with a Growth Signal Score of 65.5.
- Growth Signal Score: 65.5
- Median asking rent: $25.00/SF/yr (U.S.: $17.15)
- Population growth, ZIP areas, 2020–2023: +2.2% (U.S.: +1.5%)
- Median asking price: $253/SF (U.S.: $151)
- Vacancy 2025: lowest retail 3.4%; highest office 24.6%
- Modeled cap rate: 5.2% (U.S.: 6.1%)
- Best for: retail investors; office tenants negotiating new leases
Why it ranks: Retail vacancy of 3.4% is the second-lowest of the 47 cities with city-level retail data, behind Miami, FL. The $25.00 median ask clears the U.S. $17.15.
What to watch: Office vacancy of 24.6% is the third-highest in the top 20, and the sale median rests on 83 priced listings.
Market depth: The listing data shows 757 for-sale and 617 for-lease listings. Q2 2026 recorded sales included 24 office deals, at a median $337/SF on the 22 with building size.
Recent sales, vacancy, and the lease-vs-buy breakeven are in Realmo’s Charlotte market analysis.
6. El Paso, TX: Office Vacancy of 9.3%
El Paso, TX ranks sixth with a Growth Signal Score of 65.4.
- Growth Signal Score: 65.4
- Median asking rent: $16.00/SF/yr (U.S.: $17.15), directional
- Population growth, ZIP areas, 2020–2023: +3.1% (U.S.: +1.5%)
- Median asking price: $127/SF (U.S.: $151)
- Vacancy 2025: lowest retail 3.9%; highest industrial 12.8%
- Modeled cap rate: 6.3% (U.S.: 6.1%)
- Best for: office investors and retail owner-users
Why it ranks: Office vacancy of 9.3% is the second-lowest in the top 20, after Savannah, GA, and retail vacancy sits at 3.9%.
What to watch: Industrial vacancy of 12.8% is the city’s weak spot, and the rent median rests on 48 priced lease listings.
Market depth: The listing data shows 1,207 for-sale and 402 for-lease listings.
Asking rents, prices, and vacancy by sector are on Realmo’s El Paso market page.
7. Austin, TX: Fastest Population Growth in the Top 10
Austin, TX ranks seventh with a Growth Signal Score of 64.7.
- Growth Signal Score: 64.7
- Median asking rent: $28.00/SF/yr (U.S.: $17.15)
- Population growth, ZIP areas, 2020–2023: +3.5% (U.S.: +1.5%)
- Median asking price: $350/SF (U.S.: $151)
- Vacancy 2025: lowest retail 4.1%; highest office 29.0%
- Modeled cap rate: 4.4% (U.S.: 6.1%)
- Best for: retail investors; office tenants negotiating new leases
Why it ranks: ZIP-area population growth of 3.5% is the fastest in the top 10. The $28.00 median ask is the second-highest in the top 20, after Miami, FL.
What to watch: Office vacancy of 29.0% and industrial vacancy of 21.9% are the highest in the top 20 for their sectors.
Market depth: The listing data shows 1,035 for-sale and 1,323 for-lease listings.
Track office rents and vacancy by sector in Austin commercial real estate data from Realmo.
8. Omaha, NE: Industrial Vacancy of 2.5%
Omaha, NE ranks eighth with a Growth Signal Score of 64.5.
- Growth Signal Score: 64.5
- Median asking rent: $15.95/SF/yr (U.S.: $17.15)
- Population growth, ZIP areas, 2020–2023: +1.6% (U.S.: +1.5%)
- Median asking price: $144/SF (U.S.: $151)
- Vacancy 2025: lowest industrial 2.5%; highest office 11.9%
- Modeled cap rate: 6.6% (U.S.: 6.1%)
- Best for: industrial investors and owner-users
Why it ranks: Industrial vacancy of 2.5% is the lowest of the 42 cities with city-level industrial data. Office vacancy of 11.9% is the fourth-lowest in the top 20.
What to watch: Industrial asks of $8.75/SF/yr, on 42 priced lease listings, run below the U.S. industrial median of $12.00.
Market depth: The listing data shows 570 for-sale and 530 for-lease listings.
Rents, prices, and vacancy by sector are in Omaha CRE data from Realmo.
9. Pittsburgh, PA: $26.00 Asking Rents, 7.8% Modeled Cap Rate
Pittsburgh, PA ranks ninth with a Growth Signal Score of 64.0.
- Growth Signal Score: 64.0
- Median asking rent: $26.00/SF/yr (U.S.: $17.15)
- Population growth, ZIP areas, 2020–2023: +1.2% (U.S.: +1.5%)
- Median asking price: $129/SF (U.S.: $151)
- Vacancy 2025: lowest retail 6.4%; highest office 17.3%
- Modeled cap rate: 7.8% (U.S.: 6.1%)
- Best for: income-focused office investors
Why it ranks: Pittsburgh, PA pairs the third-highest median ask in the top 20 with a 7.8% modeled cap rate, a combination that offsets slower population growth.
What to watch: ZIP-area population growth of 1.2% trails the U.S. 1.5%, and the sale median rests on 53 priced listings.
Market depth: The listing data shows 640 for-sale and 519 for-lease listings.
Office asking rents and sale prices are in Realmo’s Pittsburgh market analysis.
10. Savannah, GA: Office Vacancy of 3.1%, the Lowest Scored
Savannah, GA ranks 10th with a Growth Signal Score of 63.0.
- Growth Signal Score: 63.0
- Median asking rent: $23.56/SF/yr (U.S.: $17.15)
- Population growth, ZIP areas, 2020–2023: +2.1% (U.S.: +1.5%)
- Median asking price: $238/SF (U.S.: $151)
- Vacancy 2025: lowest office 3.1%; highest industrial 10.8%
- Modeled cap rate: 4.5% (U.S.: 6.1%)
- Best for: office investors and office owner-users
Why it ranks: Office vacancy of 3.1% is the lowest of the 46 cities with city-level office data. The $23.56 median ask tops the U.S. $17.15.
What to watch: Industrial vacancy runs 10.8%, retail vacancy exists only as a South regional figure, and the population figure covers just 11 ZIP areas.
Market depth: The listing data shows 821 for-sale and 212 for-lease listings. Q2 2026 recorded sales included 12 retail deals, at a median of $238/SF on the 11 with building size.
Realmo publishes asking rents and sale prices in Savannah.
11. Kansas City, MO: 3.1% Population Growth, 8.2% Modeled Cap Rate
Kansas City, MO ranks 11th with a Growth Signal Score of 61.6.
- Growth Signal Score: 61.6
- Median asking rent: $15.85/SF/yr (U.S.: $17.15), directional
- Population growth, ZIP areas, 2020–2023: +3.1% (U.S.: +1.5%)
- Median asking price: n/a, land-heavy sample (U.S.: $151)
- Vacancy 2025: lowest industrial 6.2%; highest office 19.7%
- Modeled cap rate: 8.2% (U.S.: 6.1%)
- Best for: buy-and-hold investors focused on modeled income
Why it ranks: ZIP-area population growth of 3.1% pairs with the third-highest modeled cap rate in the top 20.
What to watch: Land listings likely pull the all-category asking price median down to $13/SF, so it is not shown above. Multifamily is the only sector with at least 10 priced sale listings, at $151/SF on 19.
Market depth: The listing data shows 968 for-sale and 349 for-lease listings.
Asking prices, rents, and vacancy are on Realmo’s Kansas City market page.
12. Fort Lauderdale, FL: $25.00 Rents and 4.8% Retail Vacancy
Fort Lauderdale, FL ranks 12th with a Growth Signal Score of 61.0.
- Growth Signal Score: 61.0
- Median asking rent: $25.00/SF/yr (U.S.: $17.15)
- Population growth, ZIP areas, 2020–2023: +0.6% (U.S.: +1.5%)
- Median asking price: $367/SF (U.S.: $151)
- Vacancy 2025: lowest retail 4.8%; highest office 15.9%
- Modeled cap rate: 4.4% (U.S.: 6.1%)
- Best for: retail and office investors underwriting rent levels
Why it ranks: Retail vacancy of 4.8%, office vacancy of 15.9%, and a $25.00 median ask carry the score; industrial vacancy exists only as a South regional figure.
What to watch: ZIP-area population growth of 0.6% trails the U.S. 1.5%, and the 4.4% modeled cap rate trails the U.S. 6.1%.
Market depth: The listing data shows 754 for-sale and 602 for-lease listings. Q2 2026 recorded sales included 13 industrial deals, at a median of $230/SF.
Sector rents, prices, and recent sales are in Fort Lauderdale commercial real estate data from Realmo.
13. Atlanta, GA: Growth and Rents Offset 25.0% Office Vacancy
Atlanta, GA ranks 13th with a Growth Signal Score of 59.1, ahead of Miami, FL on the tie rule.
- Growth Signal Score: 59.1
- Median asking rent: $23.99/SF/yr (U.S.: $17.15)
- Population growth, ZIP areas, 2020–2023: +2.4% (U.S.: +1.5%)
- Median asking price: $246/SF (U.S.: $151)
- Vacancy 2025: lowest retail 5.0%; highest office 25.0%
- Modeled cap rate: 4.8% (U.S.: 6.1%)
- Best for: retail investors; office tenants negotiating new leases
Why it ranks: ZIP-area population growth of 2.4% and a $23.99 median ask carry the score.
What to watch: Office vacancy of 25.0% is the second-highest in the top 20, after Austin, TX, and industrial vacancy runs 9.0%.
Market depth: The listing data shows 1,456 for-sale and 509 for-lease listings.
Office asking rents and prices by month are on Realmo’s Atlanta market page.
14. Miami, FL: Highest Asking Rents in the Top 20
Miami, FL ranks 14th with a Growth Signal Score of 59.1.
- Growth Signal Score: 59.1
- Median asking rent: $30.27/SF/yr (U.S.: $17.15)
- Population growth, ZIP areas, 2020–2023: −1.1% (U.S.: +1.5%)
- Median asking price: $390/SF (U.S.: $151)
- Vacancy 2025: lowest retail 2.7%; highest office 15.2%
- Modeled cap rate: 4.8% (U.S.: 6.1%)
- Best for: retail and industrial investors
Why it ranks: The $30.27 median ask is the highest in the top 20, and retail vacancy of 2.7% is the lowest of the 47 cities with city-level retail data.
What to watch: ZIP-area population fell 1.1% from 2020 to 2023, the weakest reading in the top 20.
Market depth: The listing data shows 2,960 for-sale and 1,483 for-lease listings, the most in the top 20. Q2 2026 recorded sales included 70 industrial deals, at a median $323/SF.
Office and industrial asking rents by quarter are in Realmo’s Miami market analysis.
15. Colorado Springs, CO: Office Vacancy of 11.3%
Colorado Springs, CO ranks 15th with a Growth Signal Score of 59.0.
- Growth Signal Score: 59.0
- Median asking rent: $15.00/SF/yr (U.S.: $17.15)
- Population growth, ZIP areas, 2020–2023: +2.4% (U.S.: +1.5%)
- Median asking price: $184/SF (U.S.: $151)
- Vacancy 2025: lowest industrial 5.9%; highest office 11.3%
- Modeled cap rate: 5.5% (U.S.: 6.1%)
- Best for: office investors and industrial owner-users
Why it ranks: Office vacancy of 11.3% is the third-lowest in the top 20, and no city-level sector runs above that figure.
What to watch: The $15.00 median ask trails the U.S. $17.15, which holds down the rent score.
Market depth: The listing data shows 884 for-sale and 448 for-lease listings. Q2 2026 recorded sales included 22 office deals, at a median of $226/SF.
Asking rents, vacancy, and recent sales are in Colorado Springs CRE data from Realmo.
16. Buffalo, NY: 4.7% Population Growth, 9.5% Modeled Cap Rate
Buffalo, NY ranks 16th with a Growth Signal Score of 57.9.
- Growth Signal Score: 57.9
- Median asking rent: $15.00/SF/yr (U.S.: $17.15)
- Population growth, ZIP areas, 2020–2023: +4.7% (U.S.: +1.5%)
- Median asking price: $93/SF (U.S.: $151)
- Vacancy 2025: lowest industrial 6.7%; highest office 21.0%
- Modeled cap rate: 9.5% (U.S.: 6.1%)
- Best for: investors comparing the best cities to buy investment property on modeled income
Why it ranks: Buffalo, NY posts the second-fastest ZIP-area population growth of the 48 scored cities. Its 9.5% modeled cap rate is the highest in the top 20.
What to watch: Retail vacancy of 10.8% is the highest of the 47 cities with city-level retail data, and the modeled cap rate needs testing against property-level income.
Market depth: The listing data shows 1,303 for-sale and 283 for-lease listings. Q2 2026 recorded sales included 19 retail deals, at a median of $172/SF.
Sector rents and sale prices are in Buffalo commercial real estate data from Realmo.
17. Indianapolis, IN: 4.8% Retail Vacancy, 8.0% Modeled Cap Rate
Indianapolis, IN ranks 17th with a Growth Signal Score of 56.6.
- Growth Signal Score: 56.6
- Median asking rent: $16.00/SF/yr (U.S.: $17.15)
- Population growth, ZIP areas, 2020–2023: +1.5% (U.S.: +1.5%)
- Median asking price: $63/SF (U.S.: $151)
- Vacancy 2025: lowest retail 4.8%; highest office 21.4%
- Modeled cap rate: 8.0% (U.S.: 6.1%)
- Best for: retail and industrial buy-and-hold investors
Why it ranks: Retail vacancy of 4.8% and an 8.0% modeled cap rate carry the score.
What to watch: The $63/SF all-category asking price median sits below the office ($125/SF) and retail ($187/SF) medians; land or low-priced listings likely pull it down.
Market depth: The listing data shows 1,198 for-sale and 825 for-lease listings.
Realmo publishes asking rents and vacancy in Indianapolis, updated monthly.
18. Louisville, KY: Industrial Vacancy of 3.7%
Louisville, KY ranks 18th with a Growth Signal Score of 56.3.
- Growth Signal Score: 56.3
- Median asking rent: $16.00/SF/yr (U.S.: $17.15)
- Population growth, ZIP areas, 2020–2023: +0.5% (U.S.: +1.5%)
- Median asking price: $119/SF (U.S.: $151)
- Vacancy 2025: lowest industrial 3.7%; highest office 18.8%
- Modeled cap rate: 7.3% (U.S.: 6.1%)
- Best for: industrial investors and owner-users
Why it ranks: Industrial vacancy of 3.7% ties Detroit, MI for second-lowest of the 42 cities with city-level industrial data. The 7.3% modeled cap rate tops the U.S. 6.1%.
What to watch: ZIP-area population growth of 0.5% trails the U.S. 1.5%.
Market depth: The listing data shows 878 for-sale and 505 for-lease listings. Q2 2026 recorded sales included 43 office deals, the most office deals in the top 20, at a median $101/SF on the 40 with building size.
Office, retail, and industrial rents are in Realmo’s Louisville market analysis.
19. Jacksonville, FL: Fastest Population Growth of the 48 Scored Cities
Jacksonville, FL ranks 19th with a Growth Signal Score of 55.9, ahead of Las Vegas, NV on the tie rule.
- Growth Signal Score: 55.9
- Median asking rent: $16.00/SF/yr (U.S.: $17.15)
- Population growth, ZIP areas, 2020–2023: +6.7% (U.S.: +1.5%)
- Median asking price: $173/SF (U.S.: $151)
- Vacancy 2025: lowest retail 6.6%; highest office 22.6%
- Modeled cap rate: 5.7% (U.S.: 6.1%)
- Best for: investors who weight population growth first
Why it ranks: ZIP-area population growth of 6.7% is the fastest of the 48 scored cities.
What to watch: Office vacancy of 22.6% runs above the 19.6% median for the 46 cities with city-level office data, and industrial vacancy sits at 10.8%.
Market depth: The listing data shows 1,192 for-sale and 924 for-lease listings. Q2 2026 recorded sales included 22 retail deals, at a median of $228/SF.
Office, retail, and industrial rents plus price trends are on Realmo’s Jacksonville market page.
20. Las Vegas, NV: Office Vacancy of 13.0%
Las Vegas, NV ranks 20th with a Growth Signal Score of 55.9.
- Growth Signal Score: 55.9
- Median asking rent: $12.00/SF/yr (U.S.: $17.15), directional
- Population growth, ZIP areas, 2020–2023: +1.5% (U.S.: +1.5%)
- Median asking price: $191/SF (U.S.: $151)
- Vacancy 2025: lowest retail 5.7%; highest office 13.0%
- Modeled cap rate: 5.7% (U.S.: 6.1%)
- Best for: office investors and office owner-users
Why it ranks: Office vacancy of 13.0% sits below the 19.6% median for the 46 cities with city-level office data.
What to watch: The rent median rests on 14 priced lease listings, too few to score, so the city gets the median rent score. Industrial vacancy runs 11.3%.
Market depth: The listing data shows 1,243 for-sale and 790 for-lease listings. Q2 2026 recorded sales included 31 office deals, at a median of $314/SF.
Multifamily prices, vacancy, and recent sales are in Las Vegas commercial real estate data from Realmo.
Markets to Watch
San Antonio, TX finished 21st with a score of 55.3, just behind Las Vegas, NV. Office vacancy of 16.0% sits below the 19.6% median for the 46 cities with city-level office data, but industrial vacancy of 11.7% holds the score back.
Two Florida cities look like emerging real estate markets that the score could not rank. Population across Ocala, FL ZIP Code areas grew 9.8% from 2020 to 2023, and across Cape Coral, FL ZIP Code areas 8.5%. On that measure, both rank among the 10 fastest-growing real estate markets of the 100 cities in Realmo’s data. Neither has city-level vacancy data, so neither qualifies yet.
How We Ranked the Best Cities for Real Estate Growth
The Growth Signal Score is a model-based indicator from 0 to 100. Each metric becomes a percentile rank among the scored cities, with 100 for the best value, and the score is the weighted sum.
| Signal | Metric | Weight |
|---|---|---|
| Demand growth | Population growth across matched ZIP Code areas, 2020–2023 | 35% |
| Vacancy | 2025 office, retail, and industrial vacancy, city or metro level; lower scores higher, sector percentiles averaged | 35% |
| Rent strength | Median commercial asking rent per SF per year | 20% |
| Income | Median modeled cap rate | 10% |
Each unit is a city name in the Realmo listing index, not a metropolitan statistical area (MSA). Of the 100 cities in the data, 48 have city- or metro-level vacancy in at least two sectors and were scored; regional vacancy figures were never scored. Four cities with fewer than 30 priced lease listings receive the median rent score. Ties at one decimal go to the stronger population signal.
Asking-rent and asking-price momentum are left out: listings grouped by period are different properties, not a market index. Recorded sales are context only, because their coverage varies by city.
Rent strength and modeled cap rate pull in opposite directions (Spearman correlation of −0.58), so high-rent markets give back points on income. With equal weights, Minneapolis, MN stays first, and 17 of the top 20 remain, but Nashville, TN drops from 3rd to 18th. Without population growth, only 12 of the 20 stay. Read the ranks as a screen, not a precise order.
Lists of the hottest real estate markets in 2026 usually measure competition today. Growth signals ask where demand is building and whether space is filling.
Prices and rents are asking figures from listings, not closed deals or signed leases; medians are hidden below 10 priced listings. Vacancy comes from Cushman & Wakefield MarketBeat via Realmo. Financing costs, taxes, insurance, employment, and residential yields sit outside the score. Sector detail for each market is on Realmo city market pages, which report averages and may use different geography than this ranking.
Commercial Real Estate Outlook 2026: What the City Data Shows
Retail and Industrial Space Runs Tighter Than Office
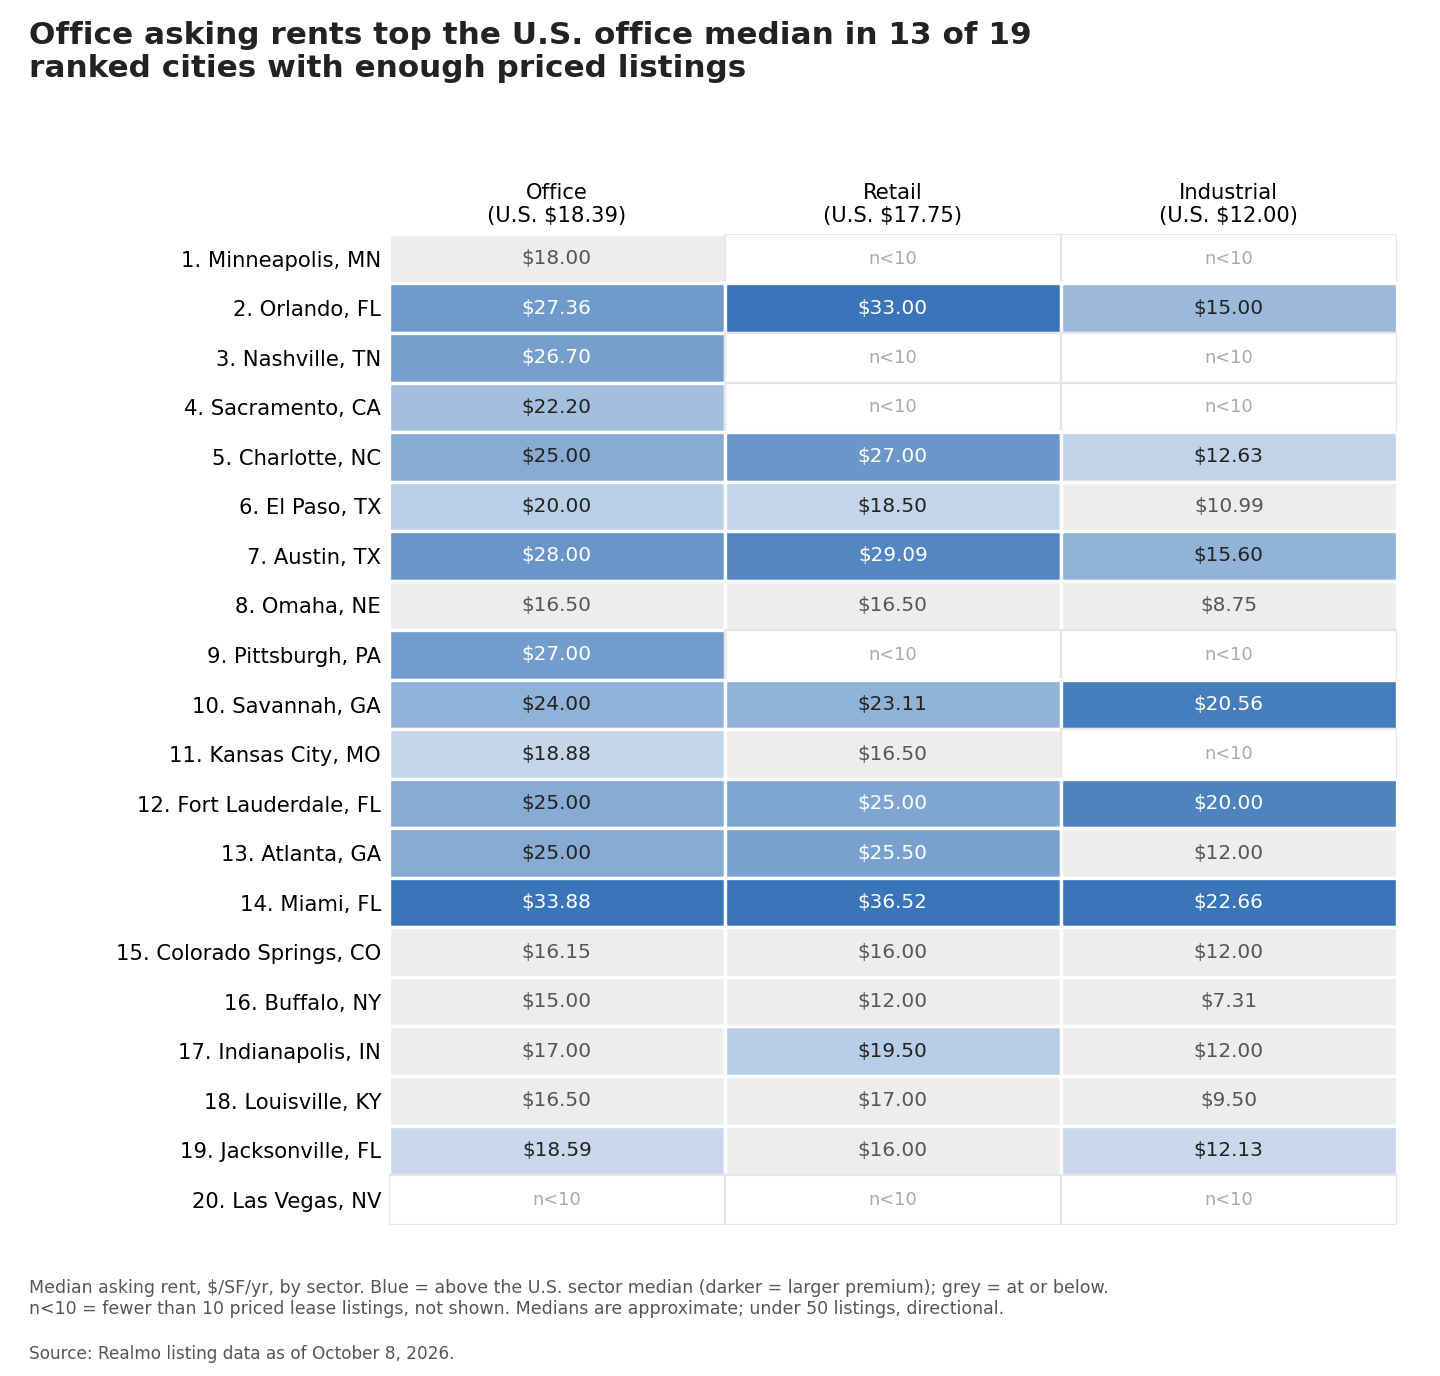
Retail posts the lowest 2025 vacancy in 13 of the 20 ranked cities, and industrial in six. One of the clearest commercial real estate market trends in this data is a split by sector. Office asking rents top the U.S. office median of $18.39/SF/yr in 13 of the 19 ranked cities with at least 10 priced office leases. Yet office is the emptiest sector in 17 of the 19 ranked cities with city-level office data.
Vacancy: Office Ranges From 3.1% to 33.1%
Office vacancy across the 46 scored cities with city-level data runs from 3.1% in Savannah, GA to 33.1% in San Francisco, CA, with a median of 19.6%. Retail is far tighter, at a median of 5.8% across 47 cities. Commercial real estate vacancy rates by city in the top 20 follow the same order, with medians of 17.3% for office, 6.7% for industrial, and 4.8% for retail.
Lease or Buy: What the Listing Data Can Answer
Modeled cap rates in the top 20 run from 3.2% in Nashville, TN to 9.5% in Buffalo, NY, vs. 6.1% for the U.S. The data has no lease-vs-buy breakeven, so that decision still needs property-level math on financing, taxes, and lease terms. Among the best real estate markets for first-time investors on this list, Buffalo, NY has the lowest median whole-property asking price: $234,900 across 980 priced listings. That median mixes land and every property type.
FAQ
Jacksonville, FL leads the 48 scored cities on ZIP-area population growth from 2020 to 2023, at 6.7% vs. 1.5% for the U.S. Buffalo, NY (4.7%), Austin, TX (3.5%), and Sacramento, CA (3.4%) follow. That growth is history, not a forecast, so pair it with current vacancy and asking rents.
Among the best cities to invest in real estate on growth signals, Minneapolis, MN ranks first with a Growth Signal Score of 75.7. ZIP-area population growth of 2.5% and retail vacancy of 4.4% drive the result. The score is a commercial screen, not a buy signal; the right city depends on sector and strategy.
The listing data frames the question but does not settle it. Minneapolis, MN posts a median asking rent of $17.98/SF/yr and a median asking price of $169/SF, and Realmo’s model puts the median cap rate at 8.5%. The breakeven depends on financing, taxes, operating costs, and lease terms.
Minneapolis, MN, Orlando, FL, and Nashville, TN lead this year’s list of the best cities for real estate growth, each pairing ZIP-area population gains with retail vacancy under 5%. Want the numbers behind this ranking? Explore asking prices, rents, and listings by sector in Realmo market analysis, or download the free Q3 2026 report. A ranking narrows the field; it does not replace due diligence, appraisal, or legal review. This ranking is for information only and is not investment advice.