Last-Mile Logistics Facilities: How Last Mile Logistics Real Estate Works
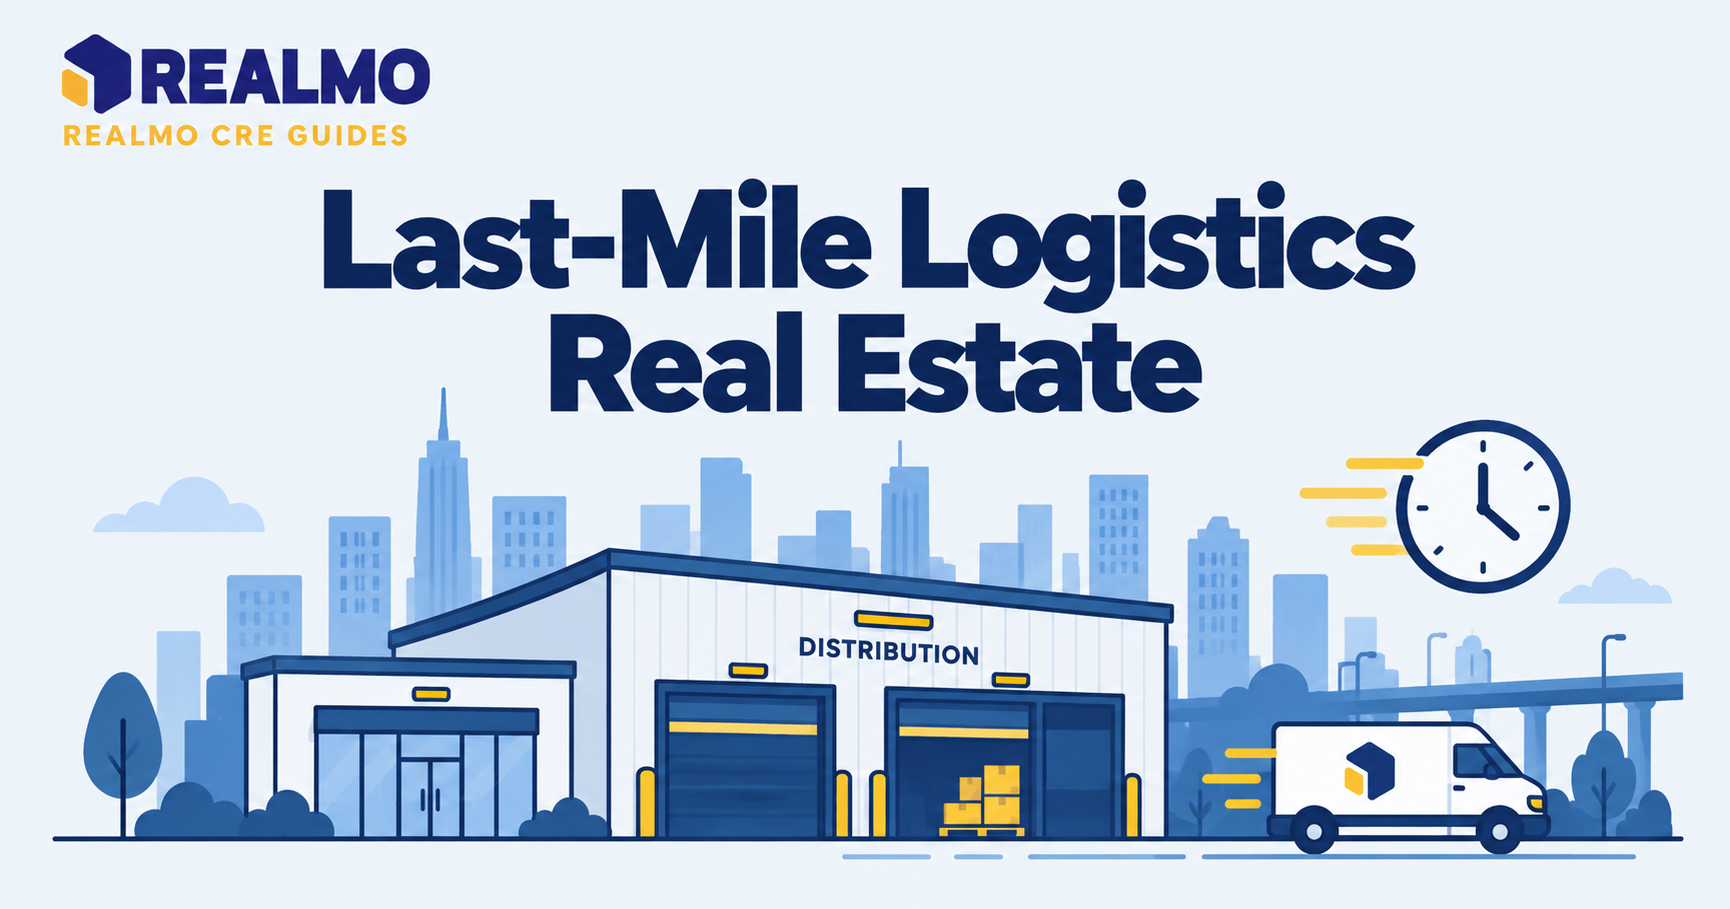
Last mile logistics real estate is warehouse and distribution space positioned close to dense population centers. It stages and dispatches goods on the final leg to the end customer. These buildings are smaller and older than regional distribution centers, and their value derives from drive time to rooftops rather than from cubic storage capacity.
Why This Asset Type Behaves Differently
An investor who has underwritten a 500,000-square-foot bulk warehouse near an interstate interchange will find the last-mile version of the same food group unfamiliar. The building is likely 30 to 60 years old, sits on a constrained infill parcel, and has low clear height. It may have been built for a manufacturer that left decades ago. Underwriting it on bulk warehouse assumptions (long leases, credit tenants, generous parking, clean environmental history) produces the wrong answer.
The offsetting factor is supply. Land inside a metro core is scarce, zoning is defensive, and neighbors resist truck traffic. That constraint is the actual investment thesis: a functionally mediocre building can hold pricing power because nothing comparable can be built two miles away. Investors buy the location’s scarcity and accept the building’s flaws, then decide how much capital the flaws will eventually demand.
What Qualifies a Building as Last-Mile
There is no formal size or specification threshold, which is why the label gets applied loosely in marketing materials. The functional test is whether the building supports high-frequency outbound trips to end customers within a defined service window. That window is usually measured in drive time rather than miles.
Buildings that pass the test share a profile. Footprints run smaller, roughly 25,000 to 200,000 square feet. Loading favors vans and small trucks over exclusive tractor-trailer bays. Employee and van parking demand is heavy relative to floor area, and the site sits inside or next to a built-out residential area. A 40,000-square-foot 1970s warehouse behind a retail corridor can be a legitimate last-mile asset. A new cross-dock building 45 minutes from the population it serves is not, no matter what the offering memorandum calls it.
The category also includes conversions. Vacant big-box retail, older flex parks, parking structures, and obsolete manufacturing plants have all been repositioned into delivery stations. Understanding how zoning and permitted use restrict industrial conversions matters more here than in any other industrial subtype.
How Last Mile Logistics Real Estate Differs From Bulk
Bulk distribution optimizes cost per cubic foot of stored inventory. Last-mile optimizes cost per delivery stop. That single difference cascades through every physical and financial variable.
Bulk buildings want 36-foot-plus clear height, deep truck courts, and dock doors sized for 53-foot trailers. Last-mile buildings tolerate 18 to 24 feet of clear height, because inventory turns in hours or days rather than months. But they need van staging, employee parking, and site circulation that lets dozens of vehicles stage and depart in a compressed window. Parking ratio, not clear height, is frequently the binding constraint.
Lease structure diverges too. Bulk leases run 7 to 15 years with institutional-credit tenants. Last-mile leases skew shorter, and the tenant roster is broader: parcel carriers, third-party logistics providers, grocery and pharmacy distributors, building-products suppliers, and local service contractors. Shorter terms cut both ways: more frequent rollover risk, and more frequent opportunity to reset rent in a supply-constrained submarket. This is where understanding NNN lease structures affects your net cash flow materially.
Which Site Features Actually Drive Rent
Ask what a logistics tenant is paying for and the answer is throughput, not square footage. Four site attributes carry most of the pricing weight.
Trailer and van parking is first. A building with excess paved yard commands a premium over an identical building with a tight site. In some markets, the yard is worth more per square foot than the enclosed space. Second is power. Electric fleet charging requires service capacity that older buildings were never designed for, and utility upgrade timelines can run far longer than a lease negotiation. Third is ingress and egress: signalized access, turning radii, and permitted truck routing determine whether a site works at 6 a.m. volume. Fourth is labor access, which means transit service and residential density within a reasonable commute for a shift-based workforce.
Clear height, column spacing, and floor flatness matter, but they rank below these four for most last-mile users. An investor who tours a building and evaluates only the warehouse envelope will misjudge rent.
Where the Risk Actually Sits
Three risks dominate. Environmental history is the first, because infill industrial land was industrial land for a long time. Prior dry cleaning, plating, fueling, or manufacturing uses can produce recognized environmental conditions that affect financing, insurability, and exit pricing. Phase I, conducted under ASTM E1527, and, where warranted, Phase II work belongs early in diligence, not late.
Second is functional obsolescence with no cure. Low clear height can be tolerated; an undersized site cannot be expanded. If the parcel cannot hold the vehicles the tenant needs, no amount of interior capital fixes it.
Third is tenant concentration and credit. A single-tenant last-mile building leased to a well-capitalized carrier looks like a bond until the carrier reconfigures its network. Networks change faster than leases expire, and a vacated purpose-fitted building re-leases to a different kind of user at a different rent. Evaluating tenant credit in single-tenant industrial deals is a separate exercise from evaluating the real estate.
Worked Example: Underwriting a 60,000 SF Infill Building
All figures below are illustrative and chosen for arithmetic clarity, not drawn from any market.
Assume a 60,000-square-foot single-tenant building on 4.5 acres, leased on a triple-net basis at an illustrative $12.00 per square foot.
Step one, gross potential rent: 60,000 × $12.00 = $720,000.
Step two, apply a credit and structural vacancy allowance of 5%: $720,000 × 0.95 = $684,000 effective gross income.
Step three, deduct owner costs that the lease does not recover. Assume management and a structural reserve totaling $0.50 per square foot: 60,000 × $0.50 = $30,000.
Step four, net operating income: $684,000 − $30,000 = $654,000.
Step five, at an illustrative purchase price of $9,000,000, the going-in capitalization rate is $654,000 ÷ $9,000,000 = 7.27%. See how to calculate and interpret cap rate for the mechanics.
How to read this: the going-in yield is only the first input. The decisive questions are what the rent resets to at expiration, and what the roof, pavement, and electrical service will cost between now and then. A building with in-place rent 20% below achievable rent and a $600,000 deferred capital list is a different investment than the cap rate alone suggests. The most common error at this stage is treating the yard and pavement as a maintenance item. On a van-intensive site, repaving is a capital event that can approach a full year of NOI.
Depreciation for nonresidential real property runs 39 years under the modified accelerated cost recovery system. Site improvements can be separable into shorter recovery periods through a cost segregation study. Tax treatment is fact-specific. Confirm any position with a licensed CPA or tax attorney before relying on it.
Common Mistakes in Last-Mile Underwriting
- Pricing the building instead of the site. Investors run comparables on square footage and clear height, then discover the tenant pool cares about acreage per thousand square feet. The consequence is an overpriced building that re-leases below underwriting.
- Skipping the power study. Assuming a utility upgrade is a scheduling detail, rather than a multi-year constraint, can strand a repositioning plan. It can also force a lease concession or a sale at a discount.
- Ignoring municipal truck routing. A site can be zoned correctly and still be unusable if the approved truck route adds turns through a residential street with a weight restriction. This surfaces at permitting, after closing.
- Underestimating rollover downtime. A specialized last-mile fit-out narrows the replacement tenant pool. Modeling 3 months of downtime on a use-specific building understates carry and re-tenanting cost.
- Treating a national tenant’s guarantee as the parent’s balance sheet. Many leases are signed by a subsidiary. Read the guarantee, not the logo.
When you are sourcing infill sites, parcel-level ownership records and current-versus-suggested-use data on Realmo let you identify underused industrial parcels before they are formally marketed. That can be the only way to find these buildings at all.
Related Terms
- Capitalization rate
- Triple net lease (NNN)
- Clear height in industrial buildings
- Functional obsolescence
- Phase I environmental site assessment
- Cost segregation study
- Industrial outdoor storage (IOS)
FAQ
What size is a typical last-mile logistics facility?
There is no fixed standard, but most fall between roughly 25,000 and 200,000 square feet. Size follows function: the building holds fast-turning inventory and stages delivery vehicles rather than storing pallets long term. Site acreage relative to building area can matter more to a tenant than the square footage itself.
Is last-mile industrial riskier than bulk distribution?
The risks are different rather than uniformly higher. Last-mile assets carry more environmental, obsolescence, and rollover risk because the buildings are older and more specialized. They carry less new-supply risk, because infill land is scarce and difficult to entitle for industrial use.
Can retail buildings be converted to last-mile facilities?
Yes, and vacant big-box retail is a frequent candidate given its size, parking, and proximity to residential density. The obstacles are usually zoning approval, loading dock construction, floor slab capacity, and neighborhood opposition to truck traffic rather than the building shell itself.
What lease term should an investor expect?
Terms run shorter than bulk distribution leases, which reduces income duration but allows more frequent rent resets in constrained submarkets. The tradeoff is that re-tenanting a use-specific building takes longer, so downtime and re-fit assumptions carry more weight in the model.