Partially Leased Mixed-Use
For Sale
$1,750,000
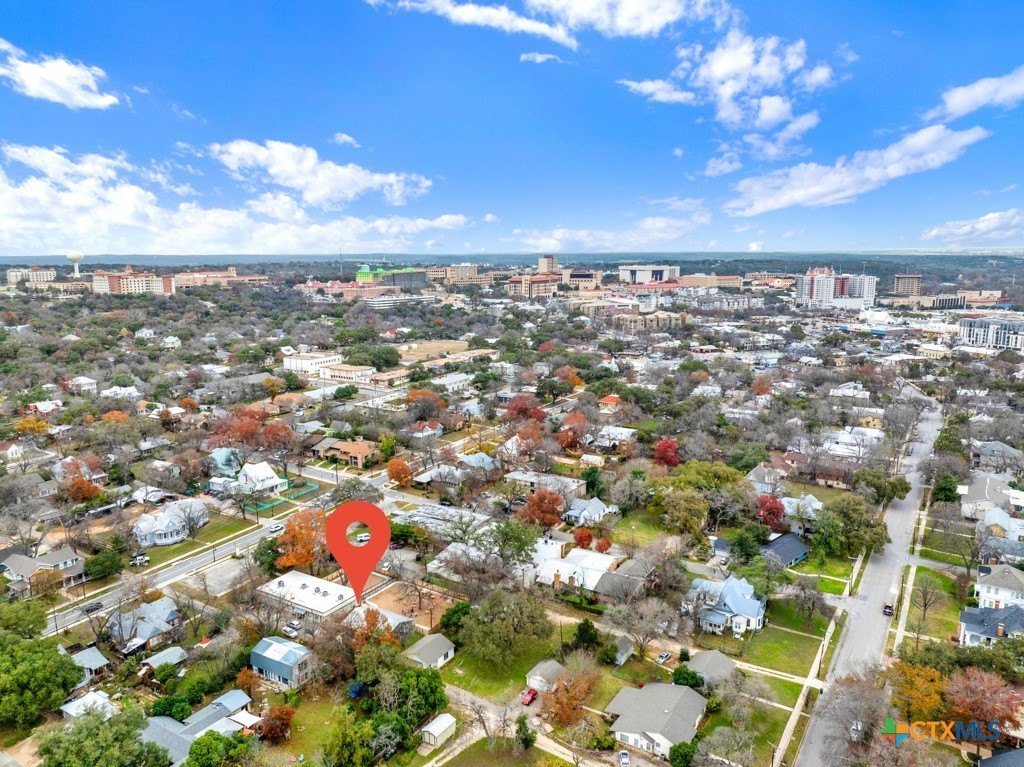
715 W Hopkins Street, San Marcos, TX 78666
CommercialSale, San Marcos, TX
Property Size4,814 SF
Lot Size0.94 Acres
Price / SF$363.52
Days on Market631

Ask AI about this property
Review the available facts, identify missing information and prepare questions for the agent.
Property Features for 715 W Hopkins Street
General Information
Property type
Commercial Sale
Property subtype
Other
Zoning
MU
Subdivision
Farm Lt
Lot features
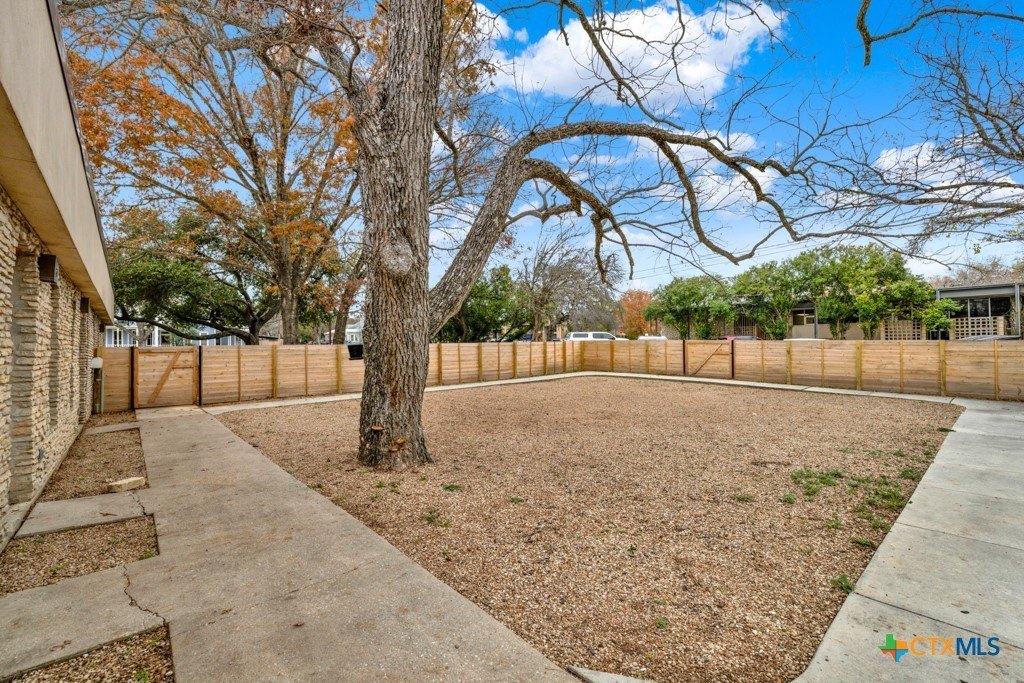
City Lot, Half To One Acre Lot
Elementary school district
San Marcos Cisd
Middle school district
San Marcos Cisd
High school district
San Marcos Cisd
Directions
Exit 202 - Wonderworld Drive. Right on Hopkins Street. Property will be on the right before Old RR 12
Standard status
Active
APN
R27370
Size
4,814 SF
Lot size
0.94 Acres
Taxes and HOA fees
Tax Year
2024
Tax Description
FARM LOT 12-93 BLK PT OF 15 GEO#33333074
Tax Annual Amount
17407
Legal Description
FARM LOT 12-93 BLK PT OF 15 GEO#33333074
Utilities
Sewer type
Public Sewer
Heating system
Electric (Heating)
Cooling system
Electric
Water source
Public
Building Details
Floors in Building
1
Building materials
Masonry
Listing Agency:
Monica & Company Real Estate
(512) 667-9129
Listed By:
Monica Katz · License #0524646
(512) 787-7935
Added: Jan 22, 2025
Changed: Aug 20
Last Checked: Oct 15 at 1:06PM
MLS# 567764
Copyright © 2026 Central Texas Multiple Listing Service. All rights reserved. All information provided by the listing agent/broker is deemed reliable but is not guaranteed and should be independently verified.
Investment Insights
Based on property information with market context.
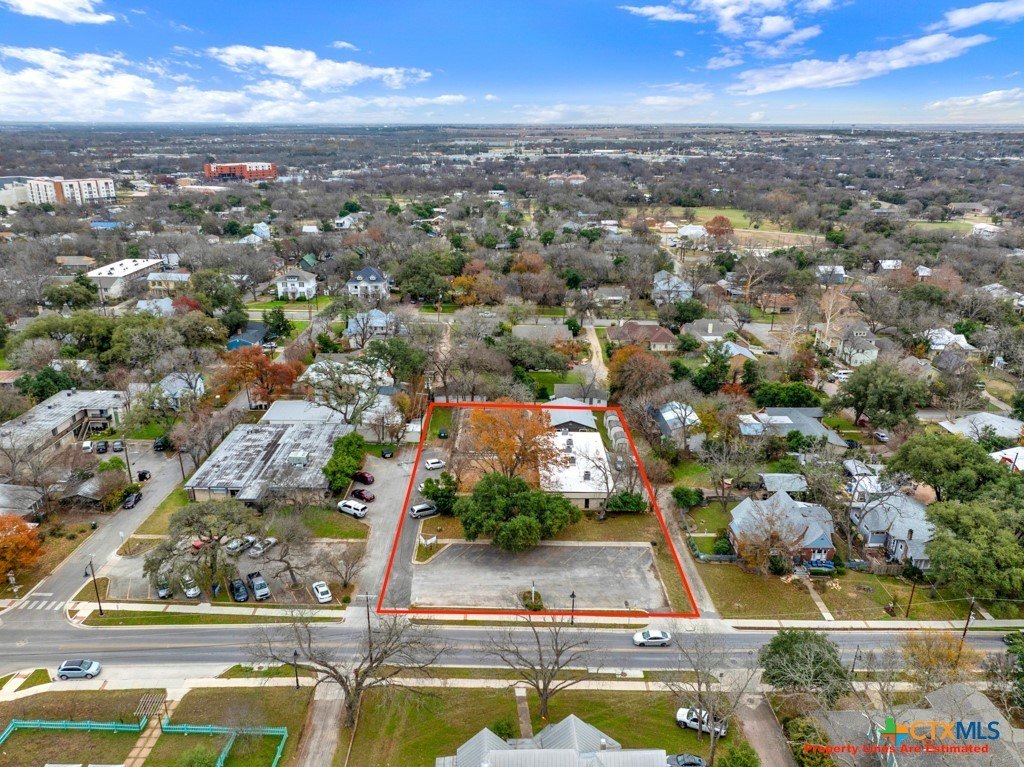
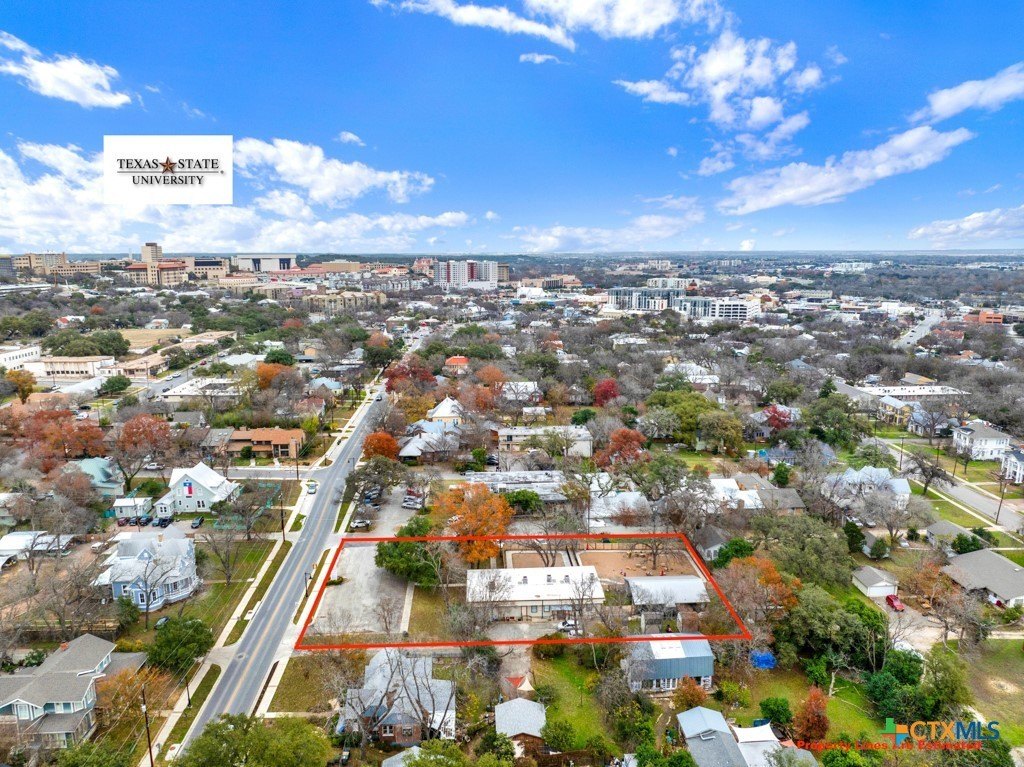
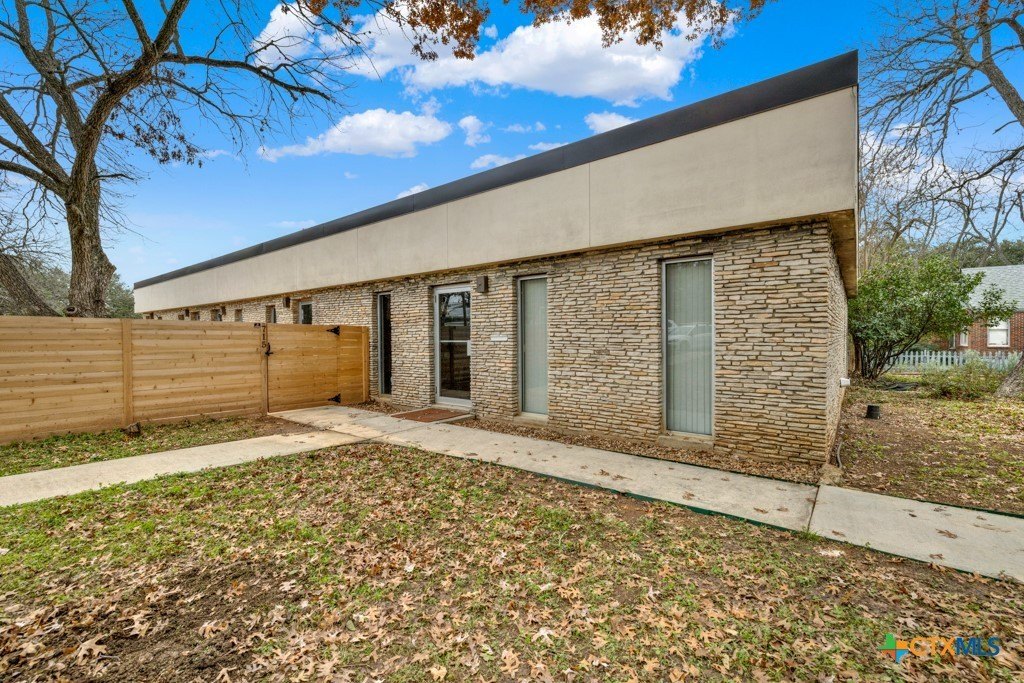
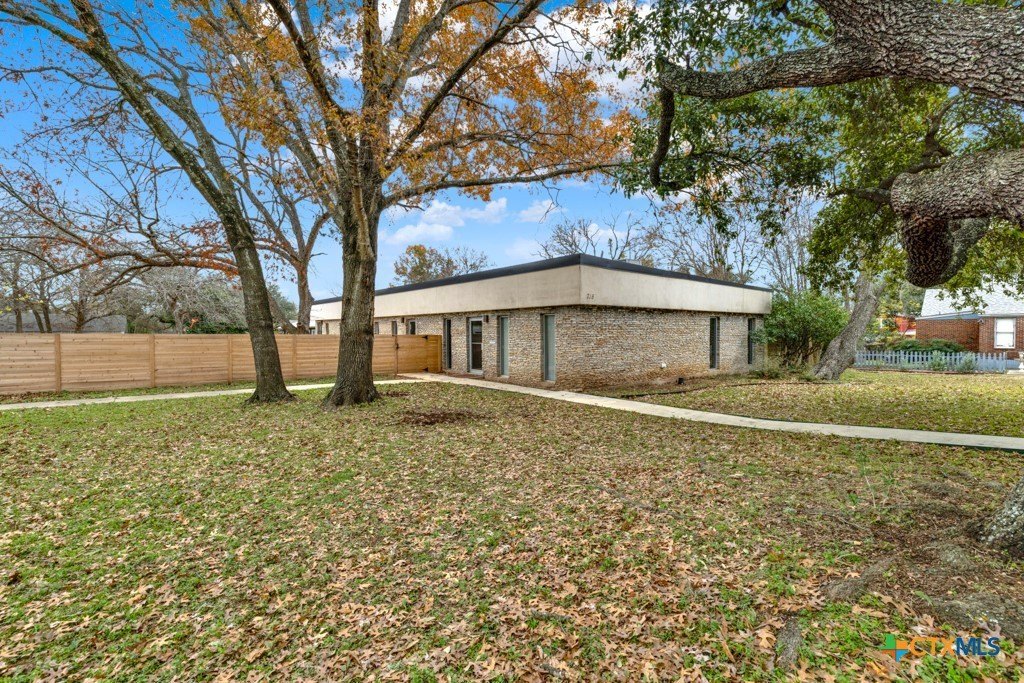
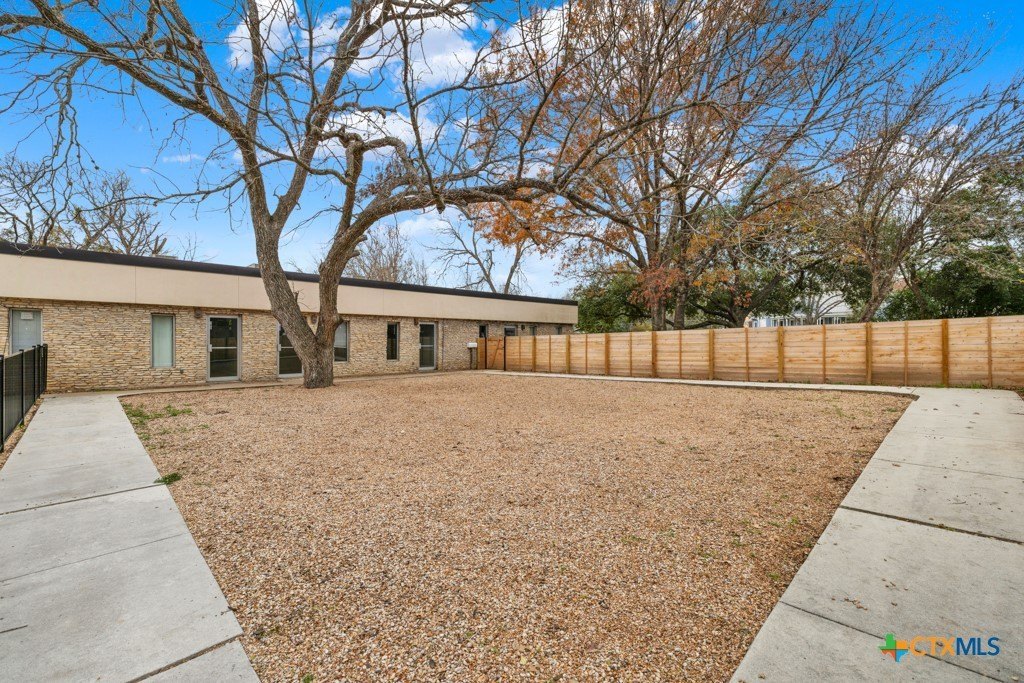
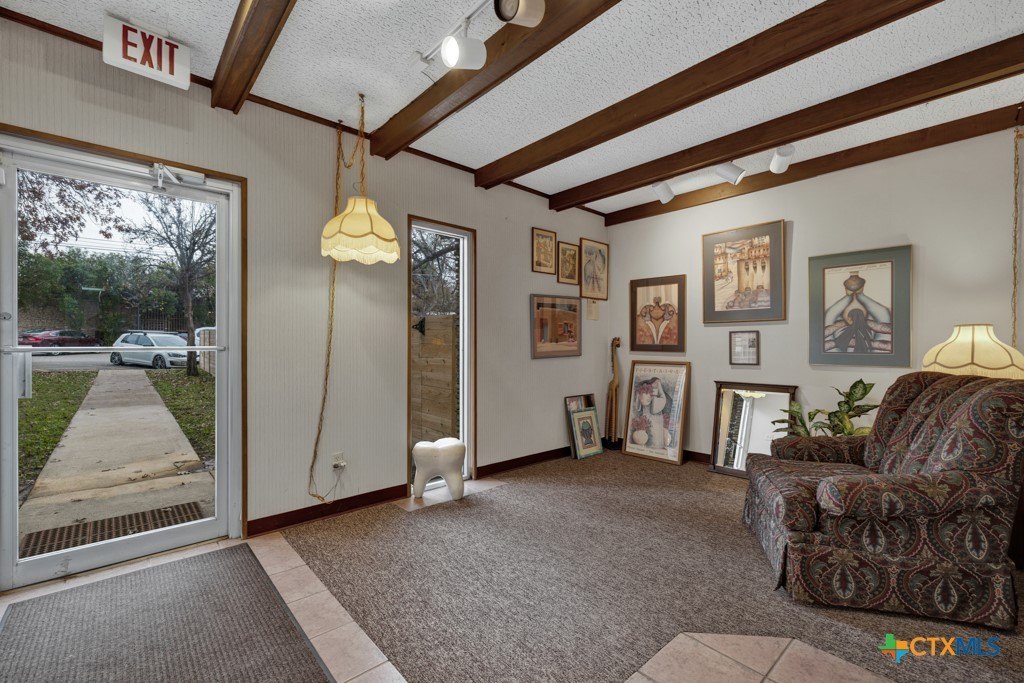
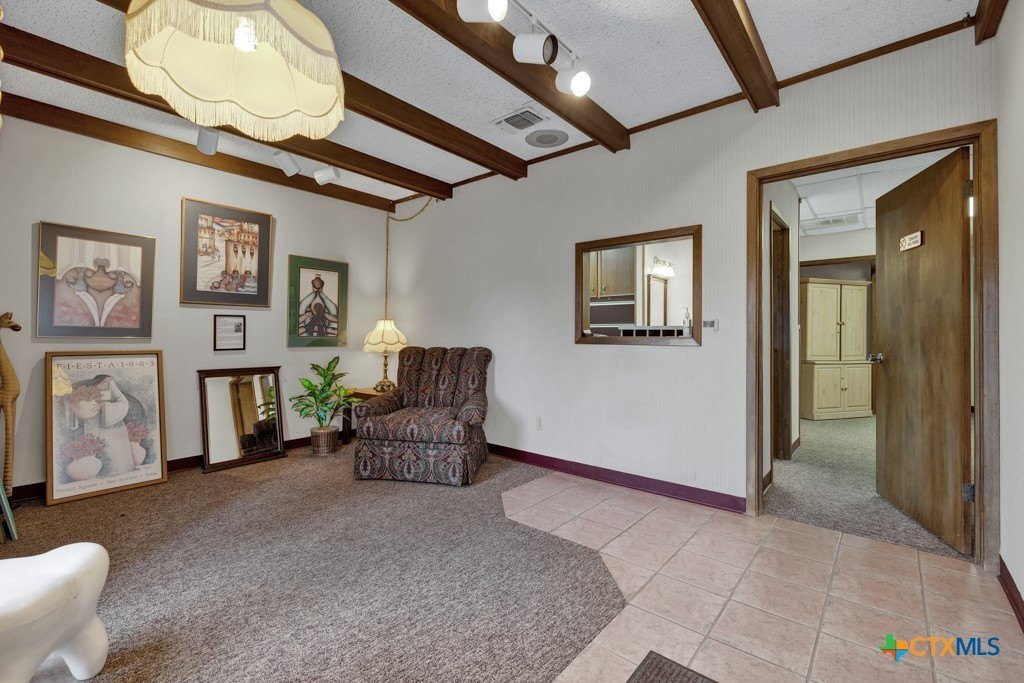
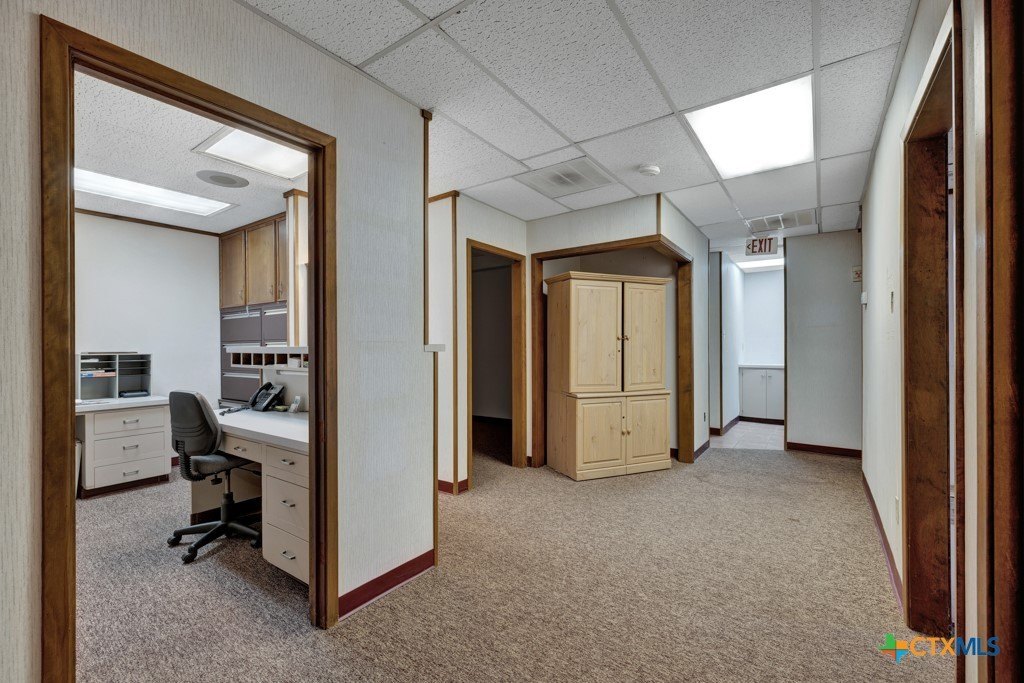
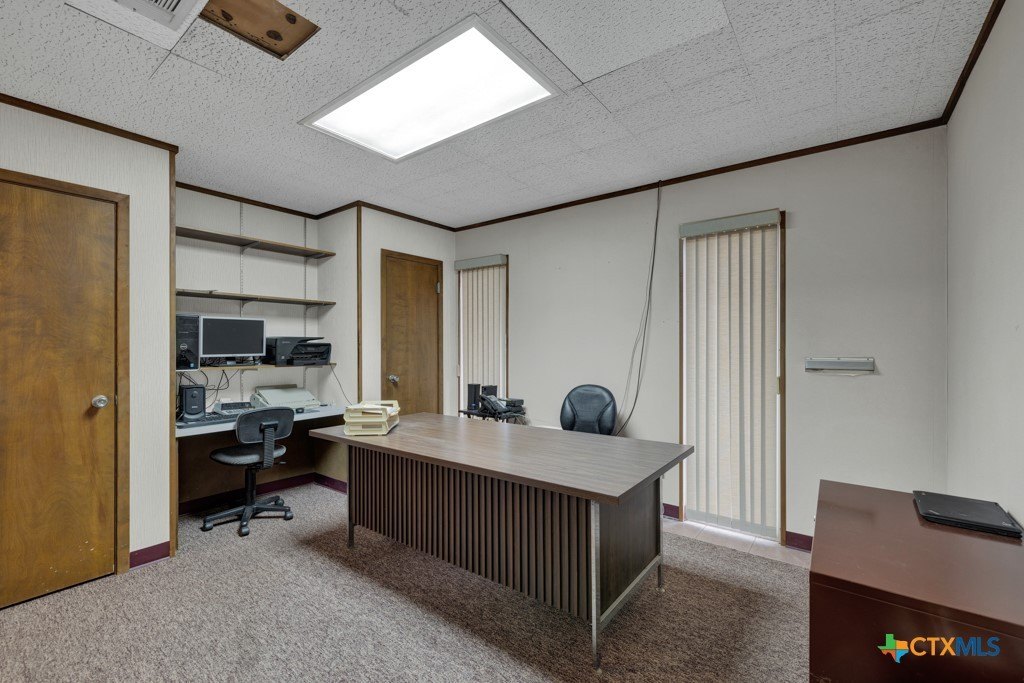
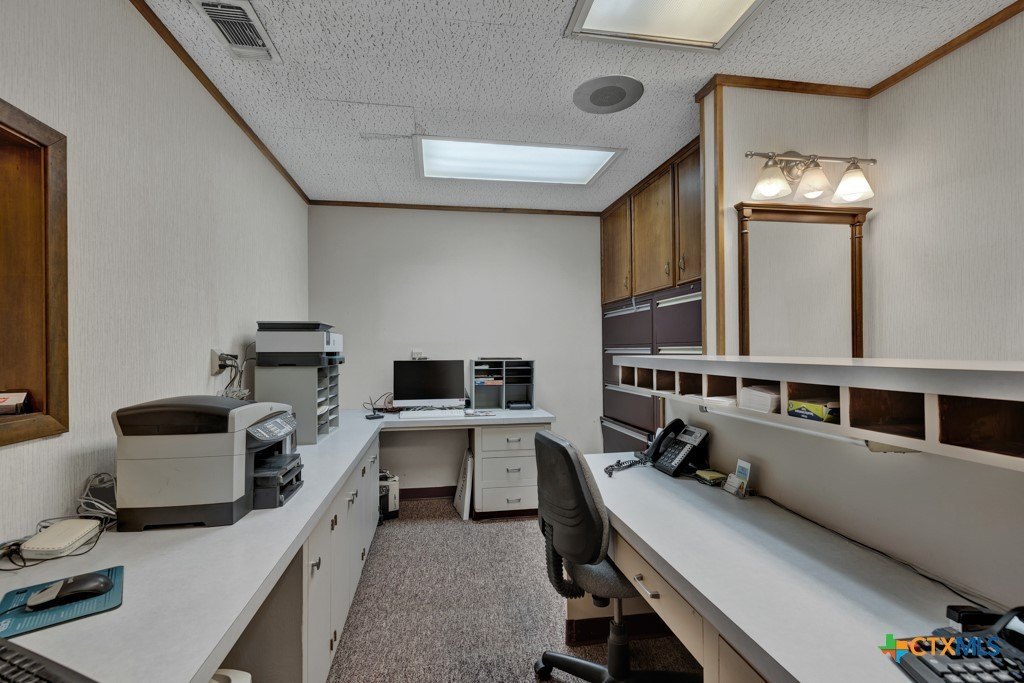
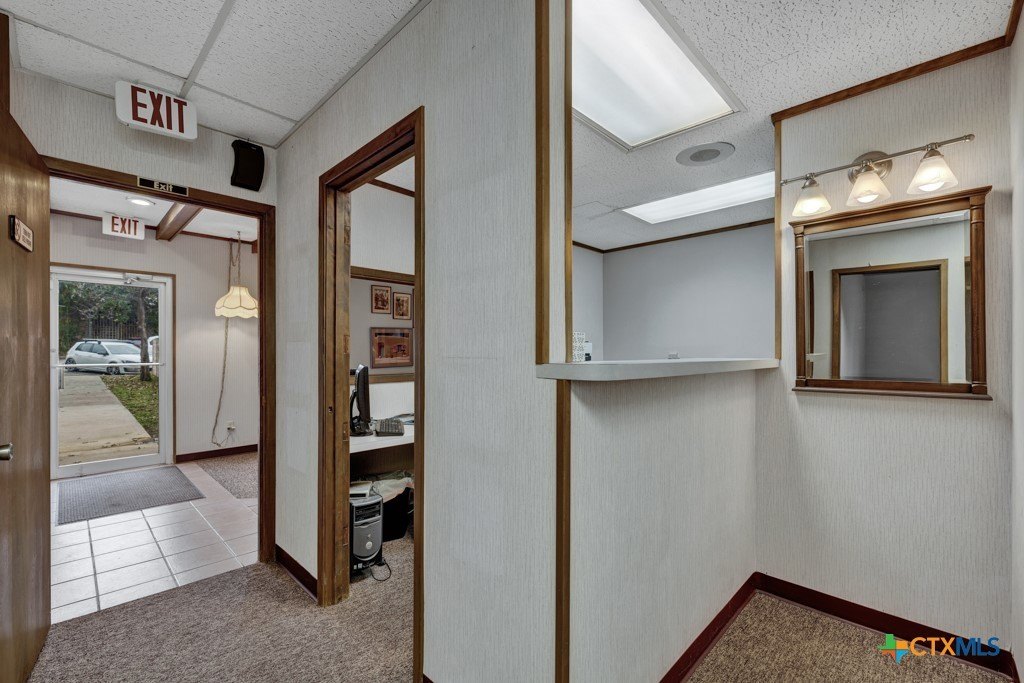
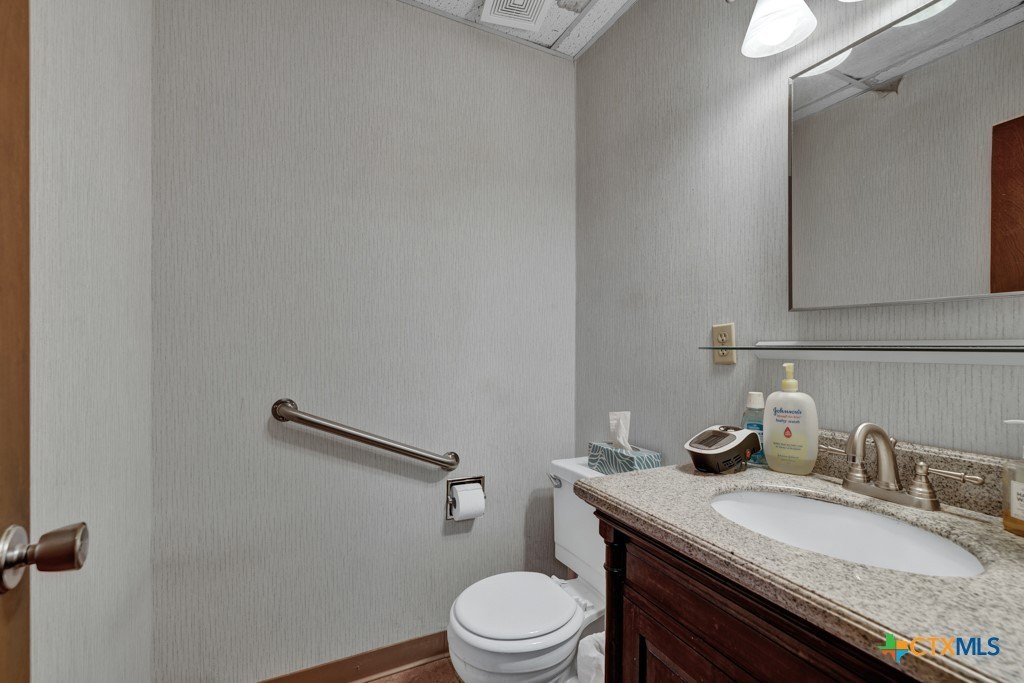
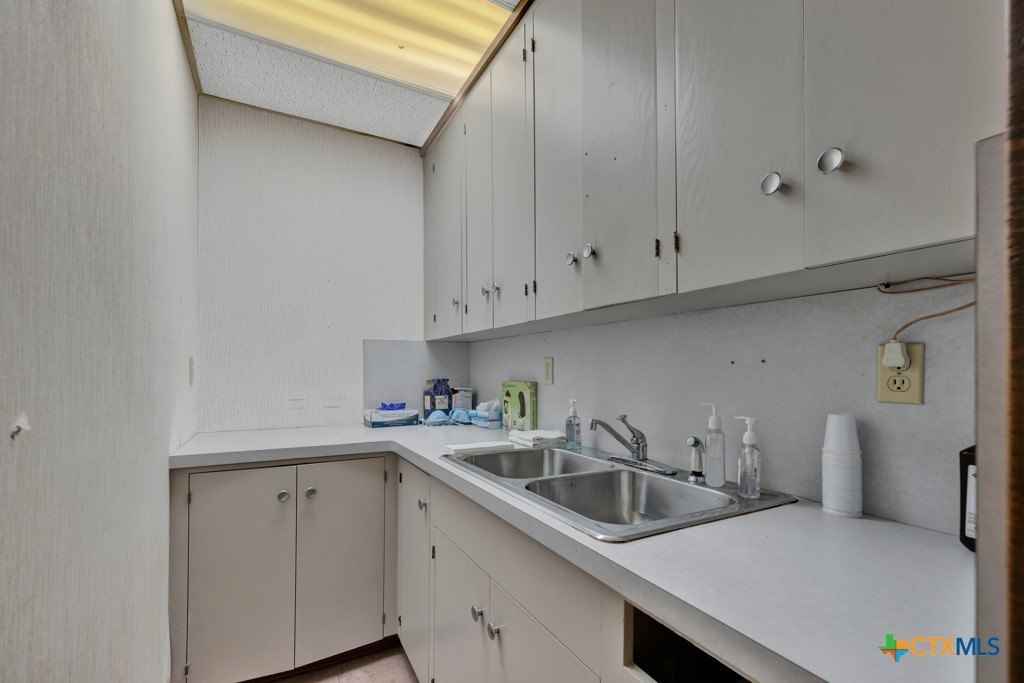
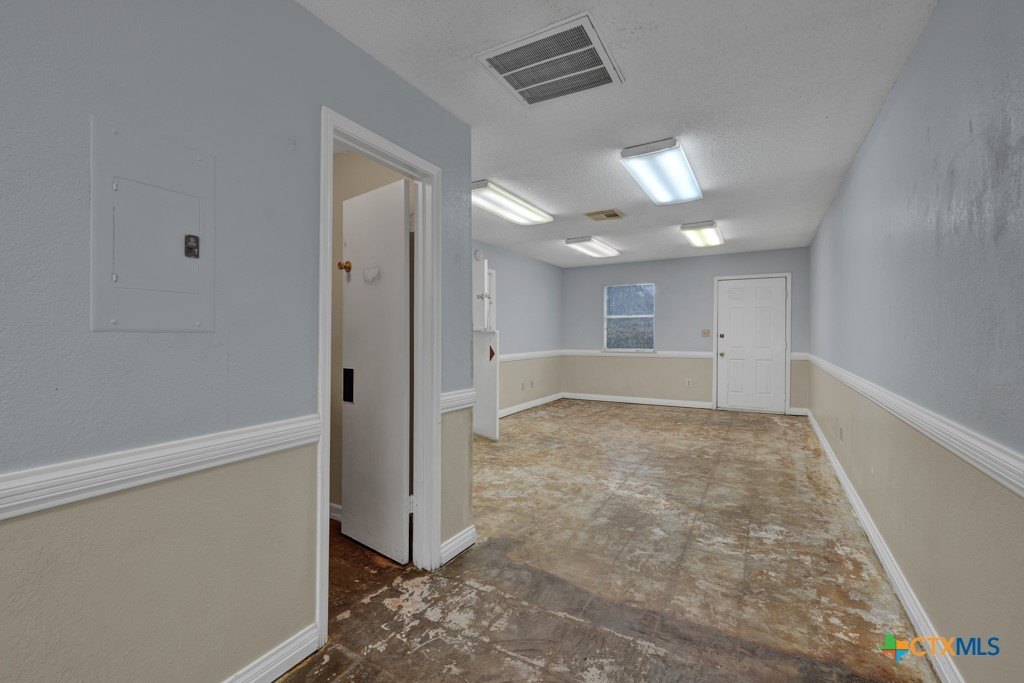
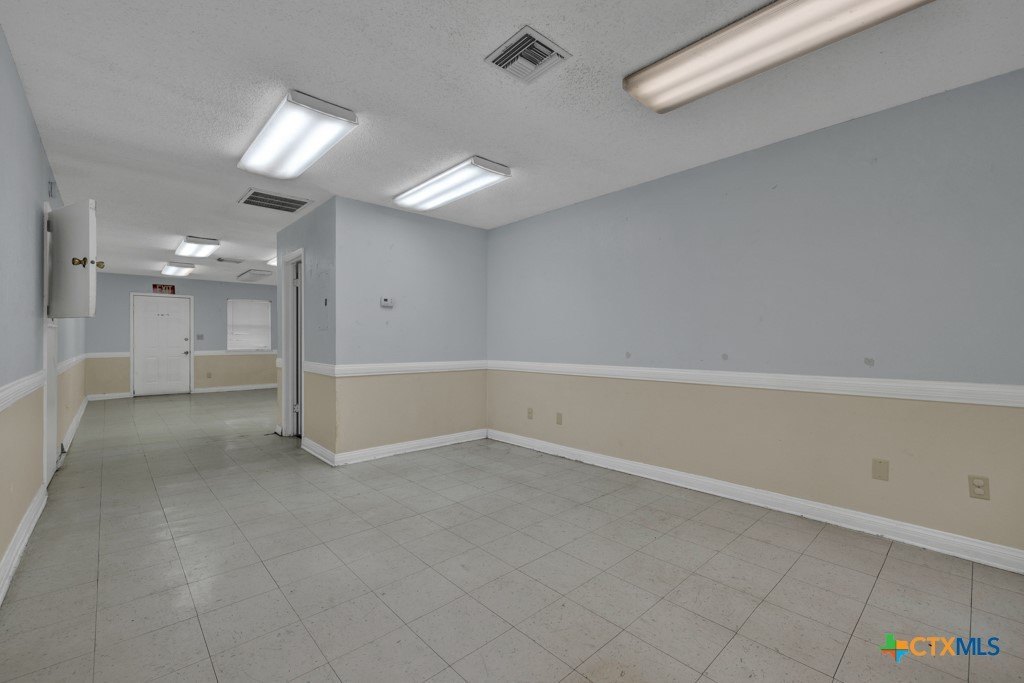
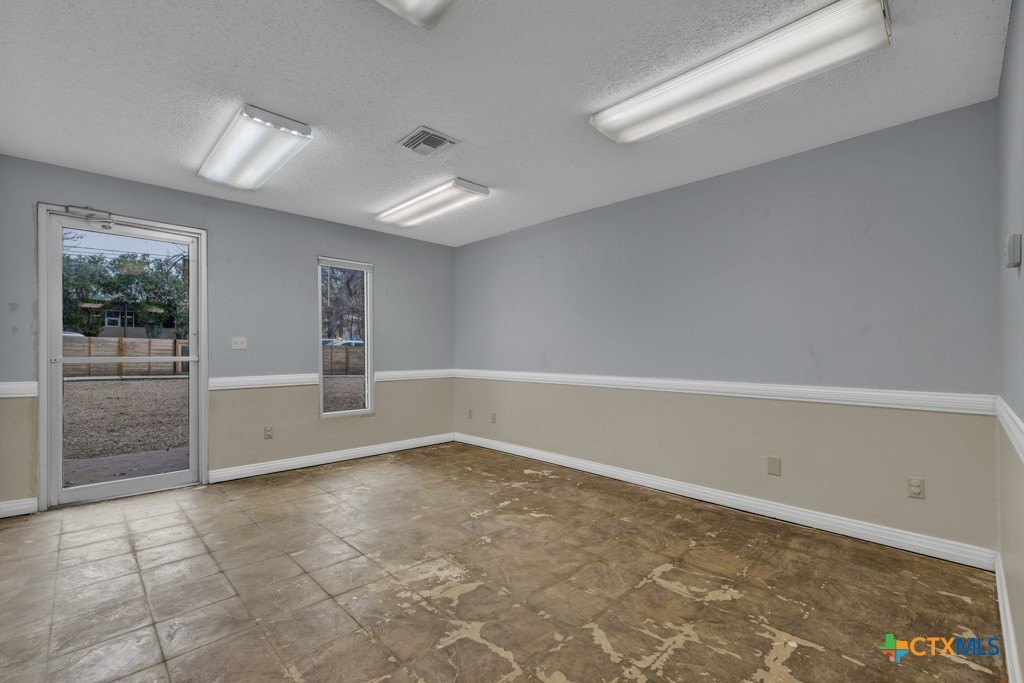
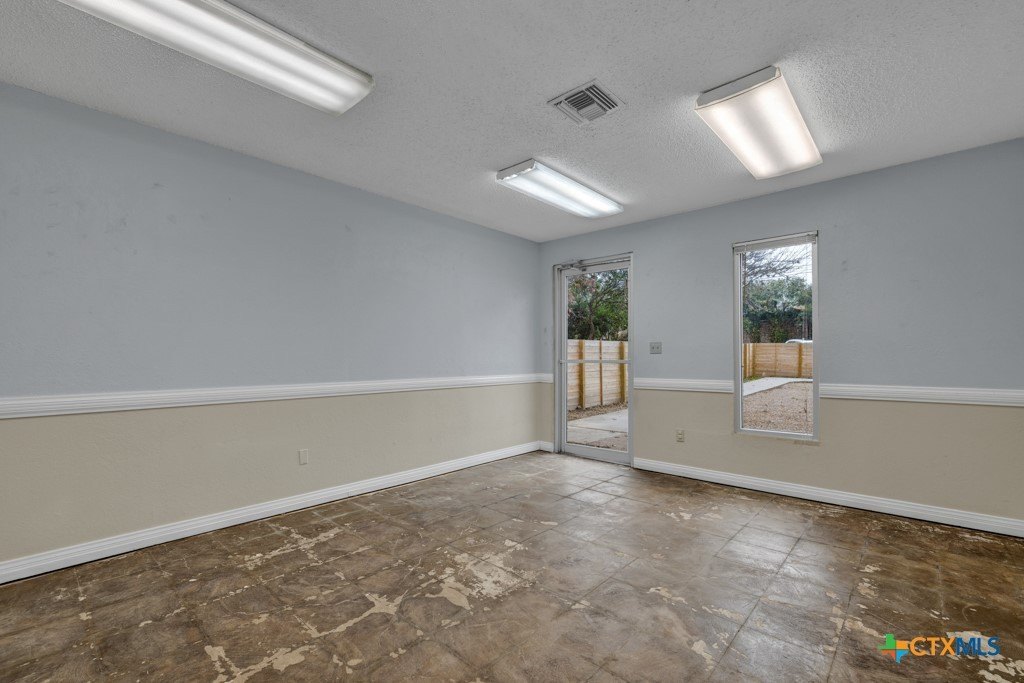
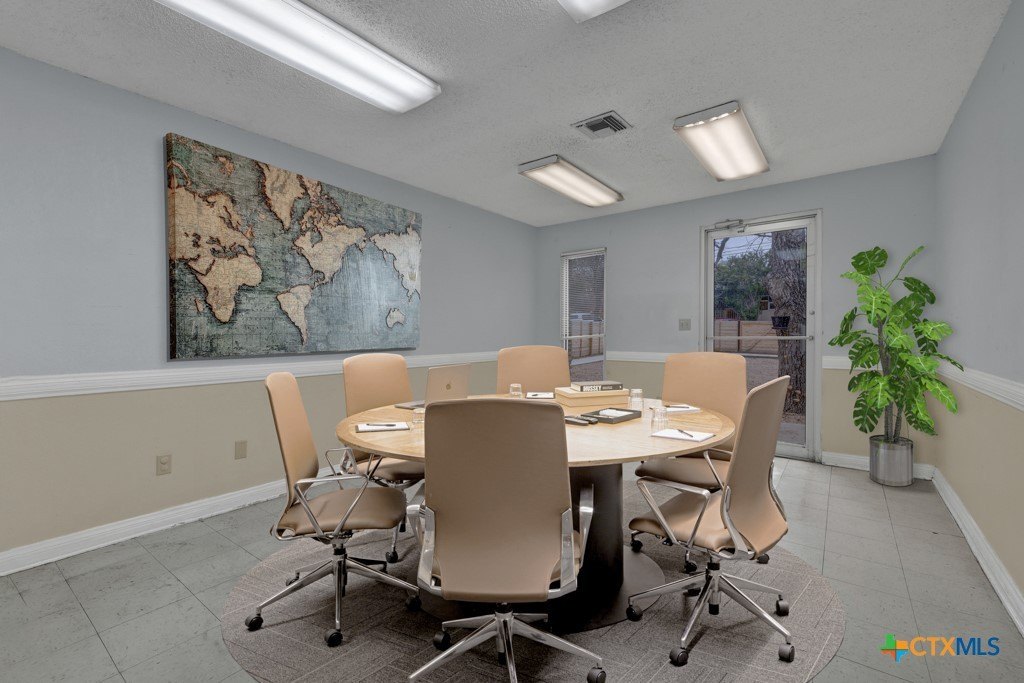
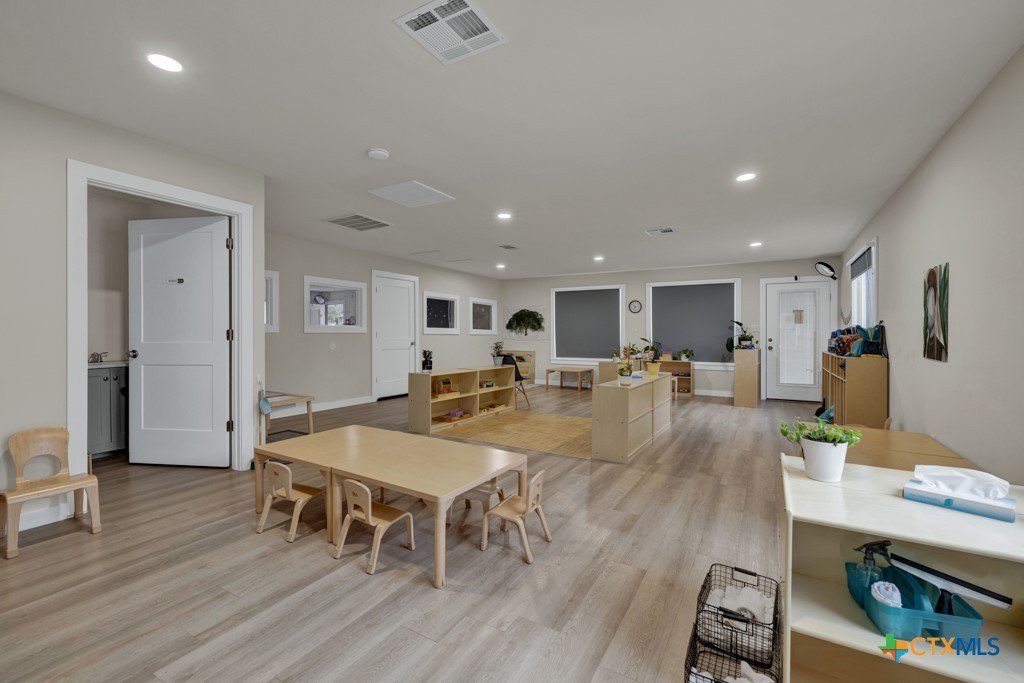
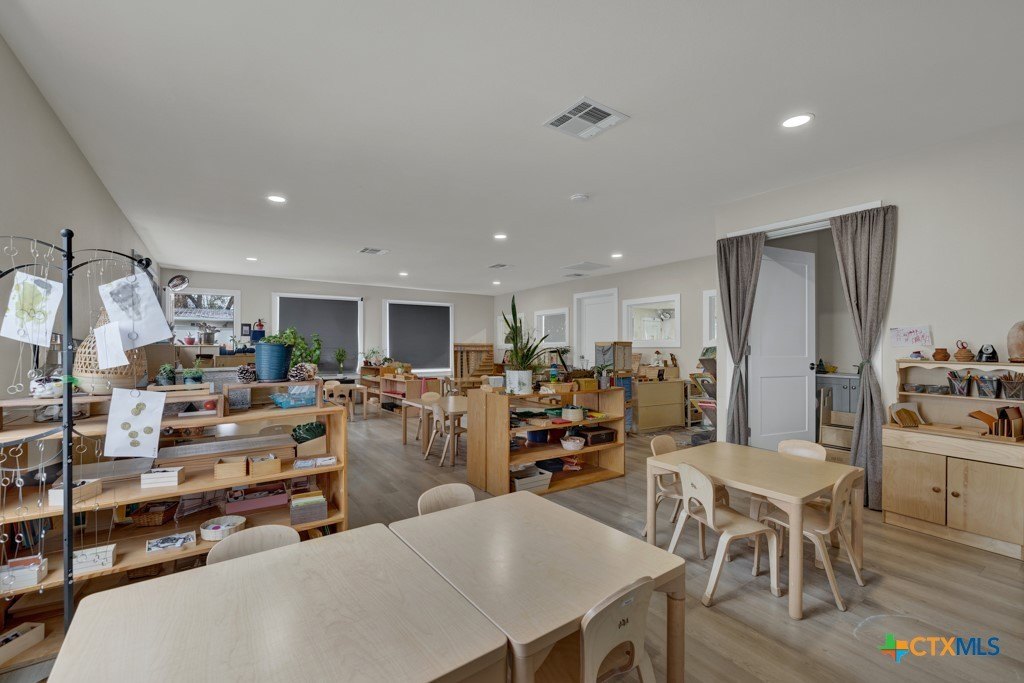
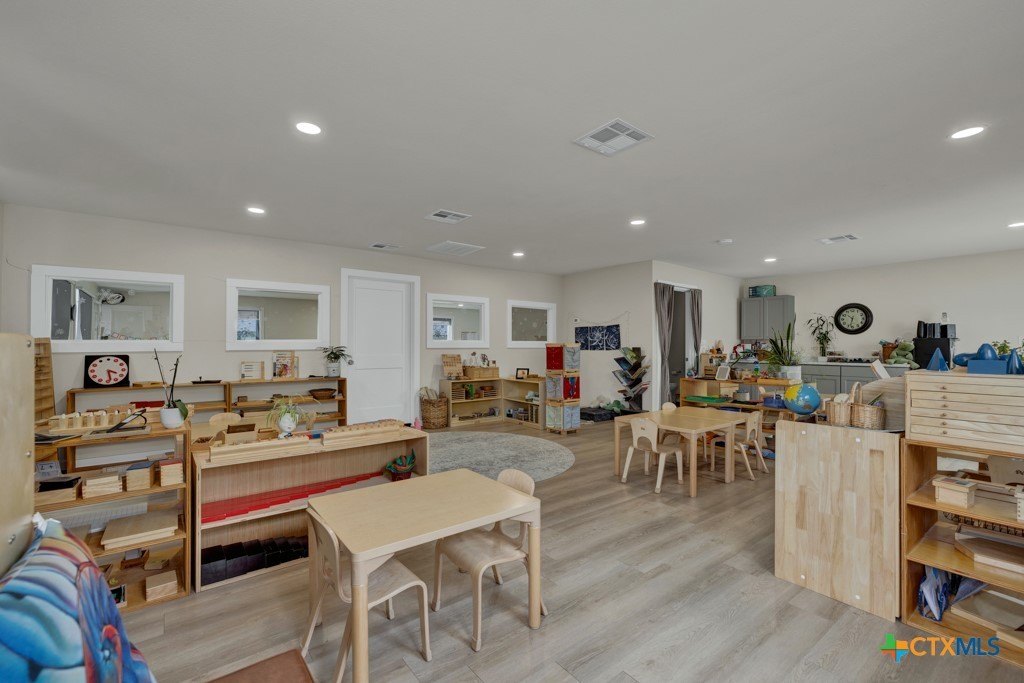
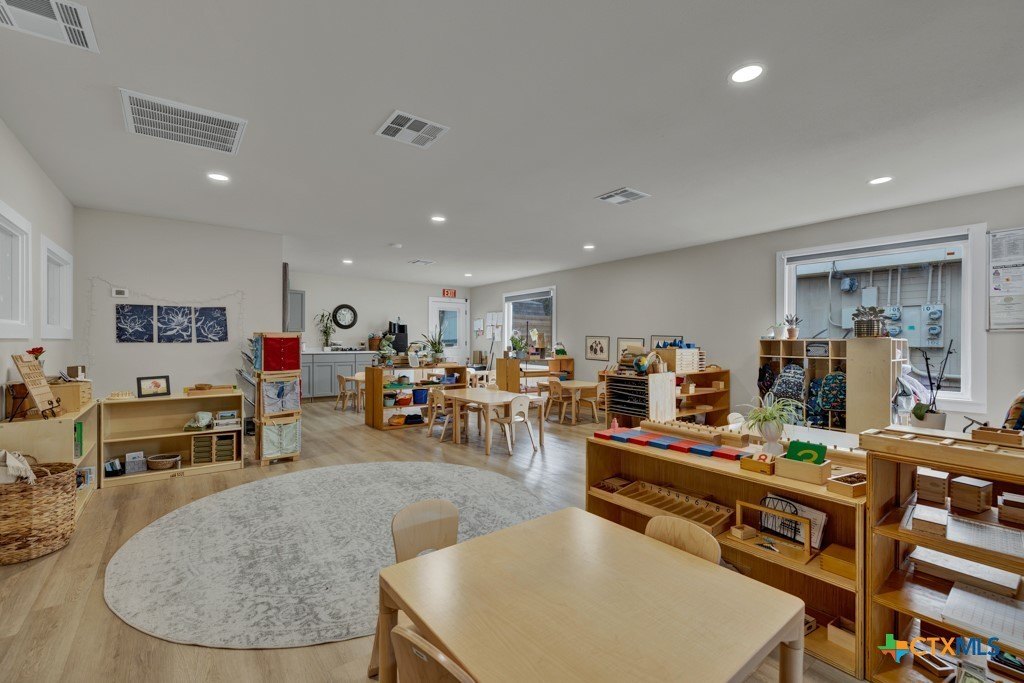
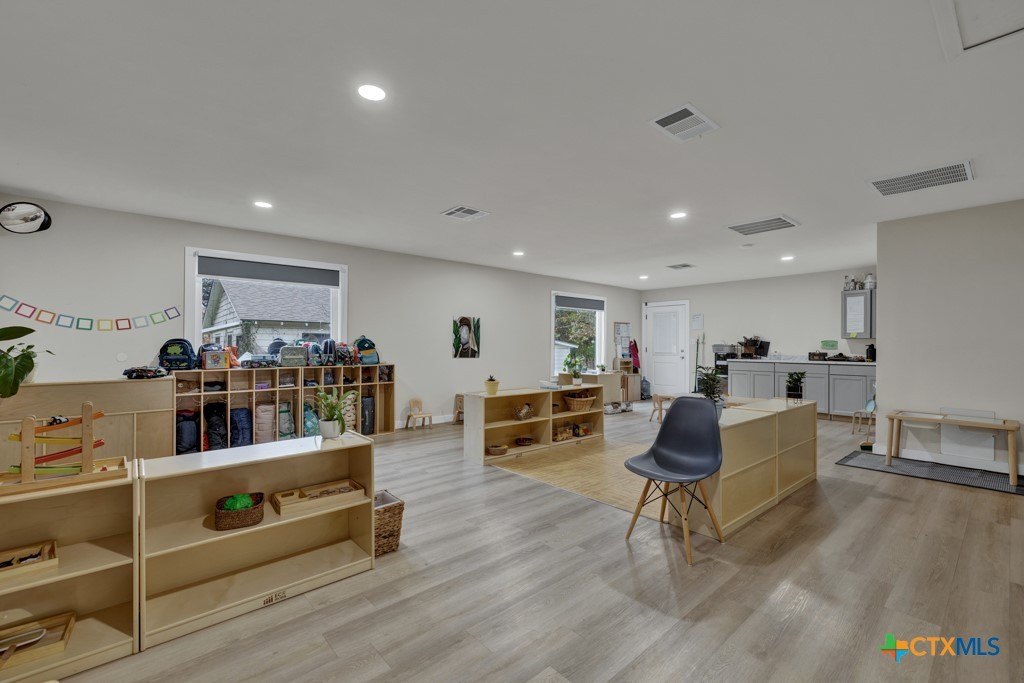
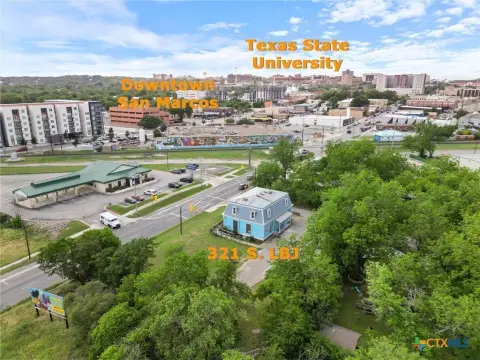
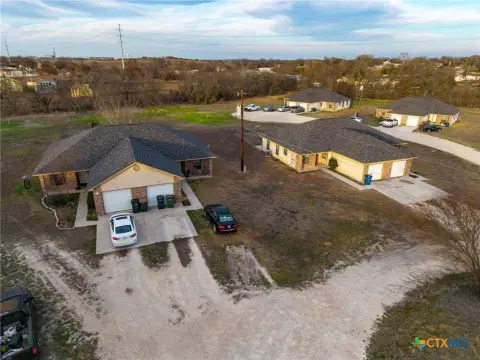
This mixed-use property comprises two masonry buildings totaling 4,814 square feet on 0.9358 acres. The 3,362-square-foot first building is partially leased, with additional suites available, while the 1,452-square-foot second building is fully leased. Available areas feature mostly white-box interiors suited to tenant finish-out. The property is zoned MU and supports both commercial and residential uses.
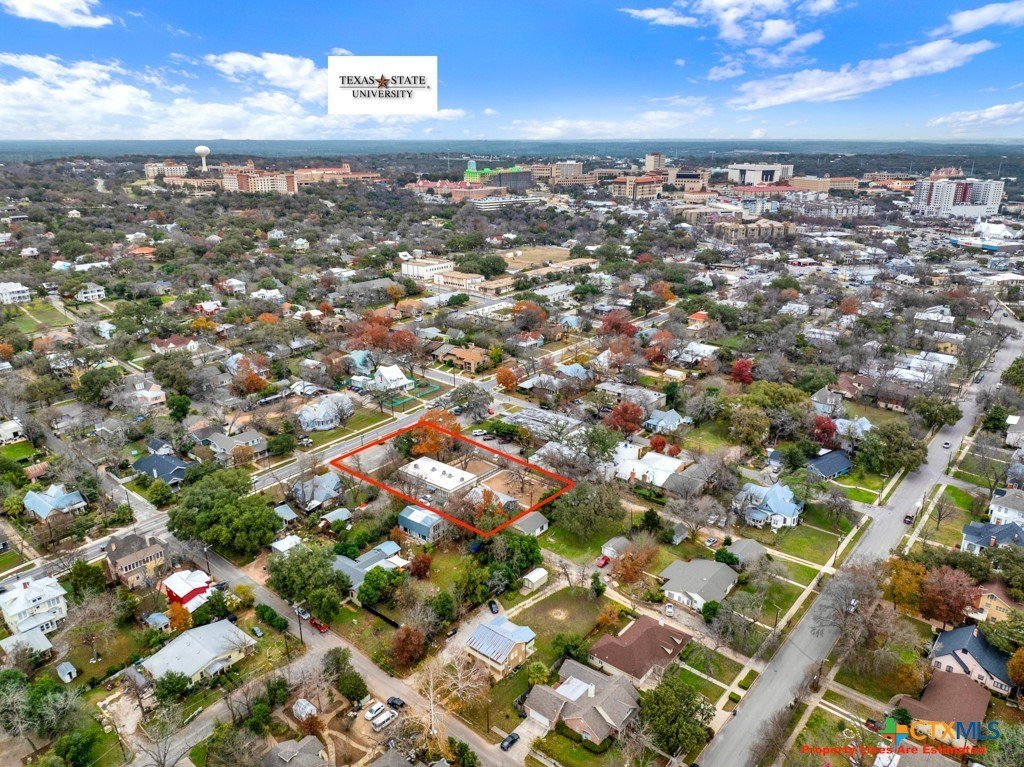
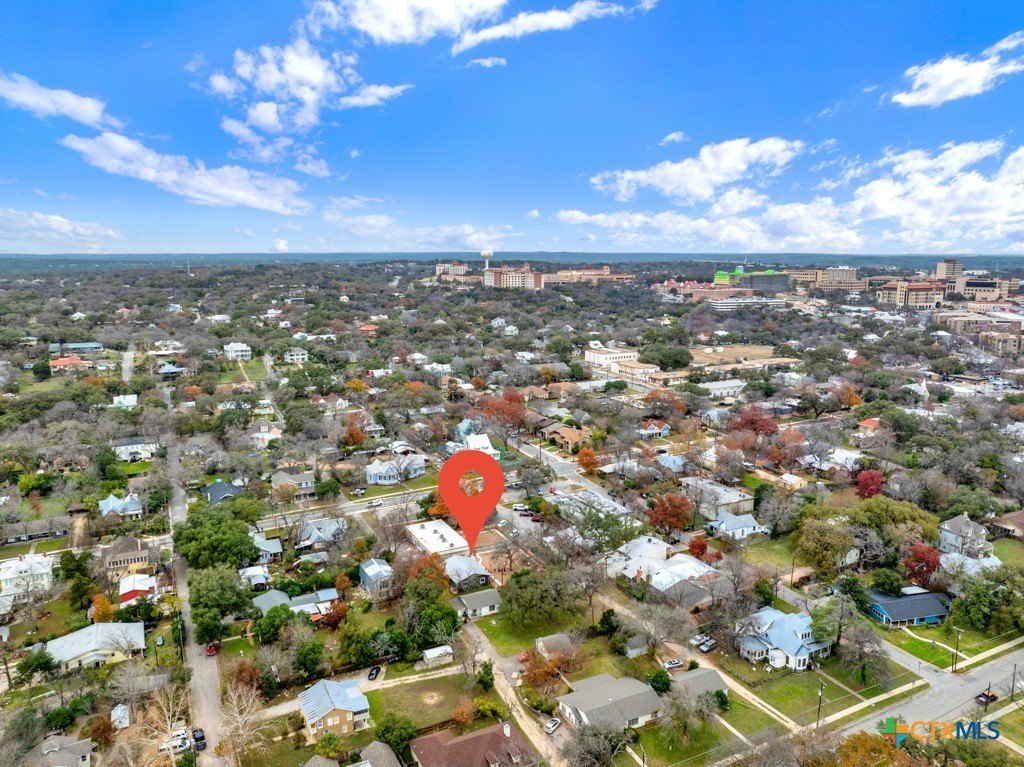
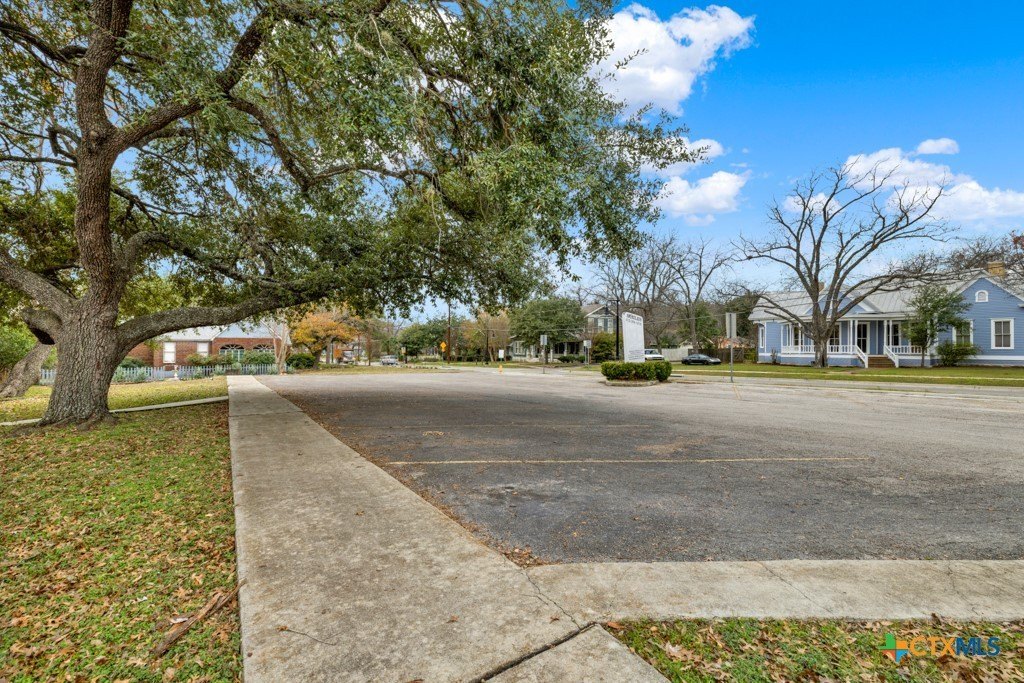
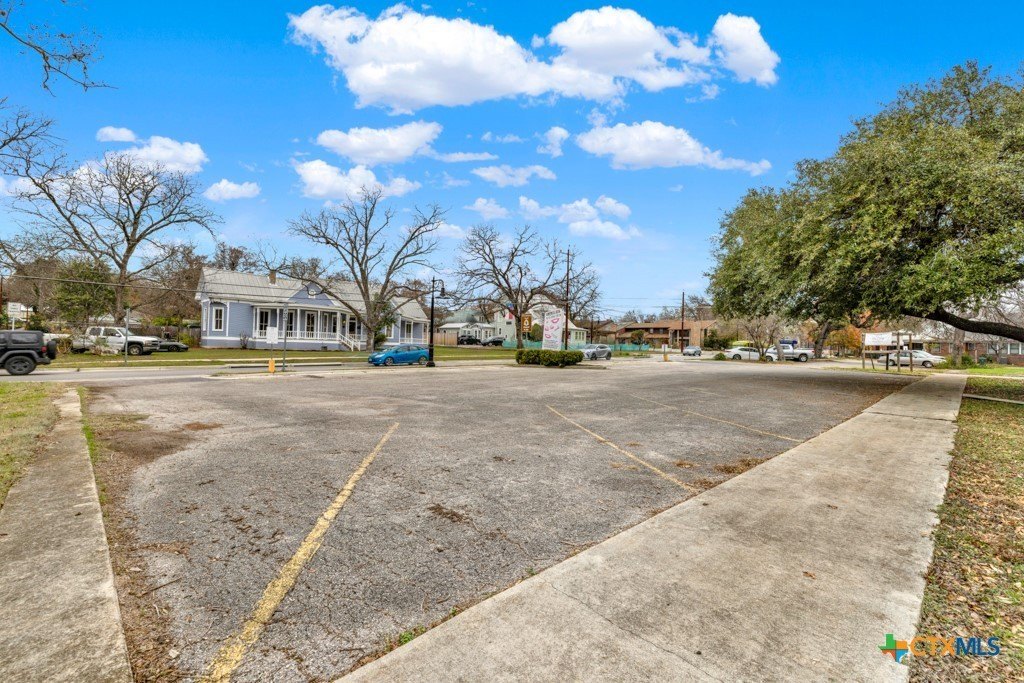
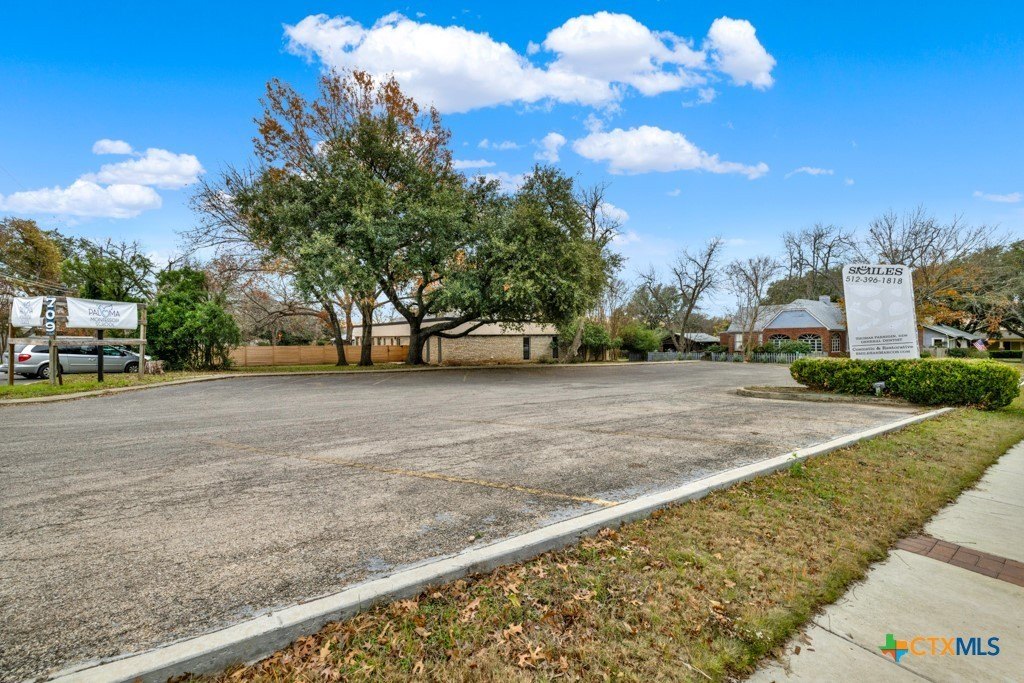
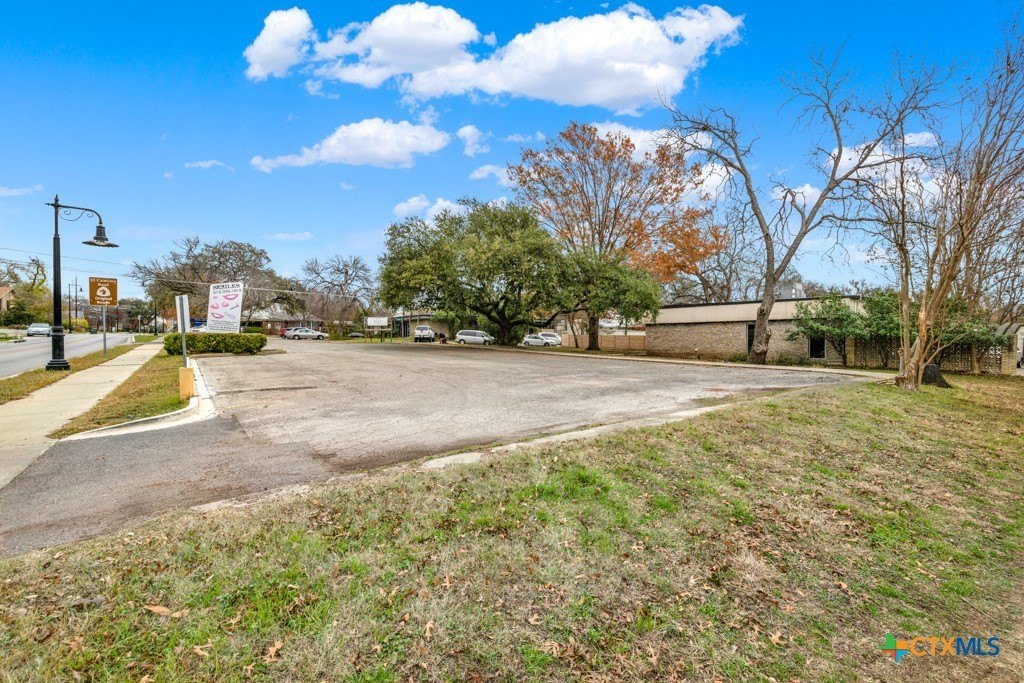
Located at 715 W Hopkins Street in San Marcos, the site fronts a primary commercial corridor with visibility and access to IH-35, Texas State University, and downtown San Marcos. Public water and public sewer serve the property, with electric heating and cooling. Masonry construction provides the building shell for a flexible mixed-use configuration.
Located at 715 W Hopkins Street in San Marcos, the site fronts a primary commercial corridor with visibility and access to IH-35, Texas State University, and downtown San Marcos. Public water and public sewer serve the property, with electric heating and cooling. Masonry construction provides the building shell for a flexible mixed-use configuration.
Key Highlights
- 4,814‑square‑foot mixed‑use property on 0.9358 acres
- Two masonry buildings: 3,362 SF and 1,452 SF
- Second building is fully leased; first building is partially leased
Financial Insights
Estimated NOI and Cap Rate
NOI / Yr
$64,989
Cap Rate
3.71%
Suggested Prices Based on Cap Rates
Cap Rate 5%
$1,299,780
$1.3M
Cap Rate 7%
$928,414
$928.4K
Cap Rate 9%
$722,100
$722.1K
Market Conditions
NOI Build-Up for 4,814 SF
Gross rent
$115.5K $24.00/SF
− Vacancy
−$11.6K −$2.40/SF
EGI
$104.0K $21.60/SF
− OpEx
−$39.0K −$8.10/SF
NOI
$65.0K $13.50/SF
Area
Hays County, TX
Vacancy
10.00%
Lease Rate
$24.00 /SF/Yr
Expense Ratio
37.50%
Simulate Cap Rate and NOI
Suggested Prices Based on Cap Rates
Cap Rate 5%
$1,299,780
Cap Rate 7%
$928,414
Cap Rate 9%
$722,100
Alternative Uses
Best Use
Mixed Use
$928.4K
$812.4K – $1.08M
NOI $64,989 @ 7.0% cap · market cap 3.71%
Second Best
—
—
no second resolved use
Theoretical Best
Office A
$2.01M
$1.76M – $2.35M
NOI $140,866 @ 7.0% cap · market cap 8.05%
Zoning and permitted uses should be independently verified with authorities.
How Realmo checks its estimates
Property Analytics
Unlock full access to Insights
Subscribe to Realmo Intelligence
Open Analytics
Current Use
Lease Details
Yes
Highway access
Location Intelligence
Trade Area within ½ mile
1,516
Businesses Nearby
Explore this area
Business Placement
Demographics for 78666, TX
86,584
Population
36,354
Households
2.4
Avg Household Size
27
Median Age
35%
College-Educated
89%
High-School Grad
192.4 sq mi
ZIP Area
450
Density / Sq Mi
$55,478
Median Household Income
$25,890
Median Earnings
$1,294
Median Rent
$271,900
Median Home Value
Check the figures for this property
Cap Rate, Value Estimation, Potential NOI and more
View Realmo Analytics





Frequently Asked Questions
What type of property is this?
Mixed-use property - Two masonry buildings combine leased space with available suites for additional commercial occupancy.
Where is this mixed-use property located?
The property is located at 715 W Hopkins Street San Marcos, TX.
What is the asking price?
The asking price for this property is $1,750,000.
What are key features of this property?
This property features: 4,814‑square‑foot mixed‑use property on 0.9358 acres; Two masonry buildings: 3,362 SF and 1,452 SF; Second building is fully leased; first building is partially leased


