Manufactured Home in Gated
For Sale
$269,000
55-8221 Ilex St, Fontana, CA 92335
Manufactured home built in 2019 with four bedrooms and two bathrooms, offering off-street parking and community amenities.
Property Size1,415 SF
Price / SF$190.11
Days on Market140
Property Features for 55-8221 Ilex St
General Information
Standard status
Active
Size
1,415 SF
Property subtype
Manufactured In Park
Listing Agency:
REALTY MASTERS & ASSOCIATES
(951) 384-6600
Listed By:
ANA RUTH VILLASENOR ALBUREZ · License #02014991
(909) 252-6504
Source:
Exprealty
Added: Jun 5
Changed: Oct 10
Last Checked: Oct 21 at 2:17AM
Displayed information is deemed reliable but is not guaranteed and should be independently verified. All listing content including descriptions, pricing, images are the copyrighted material of REALTY MASTERS & ASSOCIATES

Ask AI about this property
Review the available facts, identify missing information and prepare questions for the agent.
Investment Insights
Based on property information with market context.
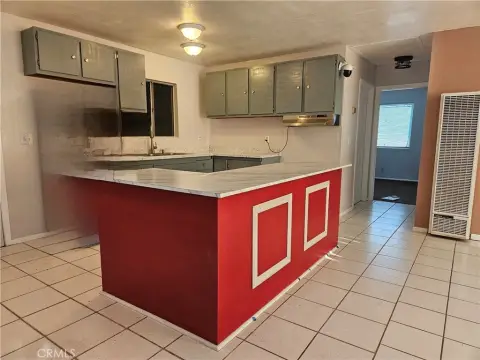
This 2019-built manufactured home offers a 4-bedroom, 2-bath layout with 9-foot ceilings and an open-concept floor plan. The kitchen flows into the living and dining areas, and the home includes what’s described as large storage space. The residence is located within the Starlite Mobile Lodge community.
The community amenities include a swimming pool, clubhouse, and recreational facilities, along with off-street parking. The property is also described as being near Victoria Gardens and other Rancho Cucamonga-area shopping and dining, with access to schools and major freeways.
The home is listed for sale and is identified as unit #55 at 8221 Ilex St in Fontana.
The community amenities include a swimming pool, clubhouse, and recreational facilities, along with off-street parking. The property is also described as being near Victoria Gardens and other Rancho Cucamonga-area shopping and dining, with access to schools and major freeways.
The home is listed for sale and is identified as unit #55 at 8221 Ilex St in Fontana.
Key Highlights
- Manufactured home built in 2019 with approximately 1,415 SF of living space
- 4 bedrooms and 2 bathrooms with 9‑foot ceilings
- Open‑concept layout with spacious kitchen flowing into living and dining areas
Financial Insights
Estimated NOI and Cap Rate
NOI / Yr
$19,151
Cap Rate
7.12%
Suggested Prices Based on Cap Rates
Cap Rate 5%
$383,020
$383.0K
Cap Rate 7%
$273,586
$273.6K
Cap Rate 9%
$212,789
$212.8K
Market Conditions
NOI Build-Up for 1,415 SF
Gross rent
$36.8K $26.04/SF
− Vacancy
−$2.0K −$1.43/SF
EGI
$34.8K $24.61/SF
− OpEx
−$15.7K −$11.07/SF
NOI
$19.2K $13.53/SF
Area
Fontana, CA
Vacancy
5.50%
Lease Rate
$26.04 /SF/Yr
Expense Ratio
45.00%
Simulate Cap Rate and NOI
Suggested Prices Based on Cap Rates
Cap Rate 5%
$383,020
Cap Rate 7%
$273,586
Cap Rate 9%
$212,789
Alternative Uses
Best Use
Apartment 5plus
$273.6K
$239.4K – $319.2K
NOI $19,151 @ 7.0% cap · market cap 7.12%
Second Best
—
—
no second resolved use
Theoretical Best
Office A
$411.7K
$360.3K – $480.4K
NOI $28,822 @ 7.0% cap · market cap 10.71%
Zoning and permitted uses should be independently verified with authorities.
How Realmo checks its estimates
Location Intelligence
Trade Area within ½ mile
332
Businesses Nearby
Explore this area
Business Placement
Demographics for 92335, CA
96,605
Population
25,861
Households
3.7
Avg Household Size
31
Median Age
10%
College-Educated
67%
High-School Grad
17.5 sq mi
ZIP Area
5,520
Density / Sq Mi
$75,198
Median Household Income
$35,912
Median Earnings
$1,636
Median Rent
$433,600
Median Home Value
Market
Vacancy Rate% for Multifamily in West region




Frequently Asked Questions
What type of property is this?
Mobile home & RV park - Manufactured home built in 2019 with four bedrooms and two bathrooms, offering off-street parking and community amenities.
Where is this mobile home & rv park located?
The property is located at 55-8221 Ilex St Fontana, CA.
What is the asking price?
The asking price for this property is $269,000.
What are key features of this property?
This property features: Manufactured home built in 2019 with approximately 1,415 SF of living space; 4 bedrooms and 2 bathrooms with 9‑foot ceilings; Open‑concept layout with spacious kitchen flowing into living and dining areas


