Fully Leased Duplex
For Sale
Contact for pricing
1315 Kings Highway, Dallas, TX 75208
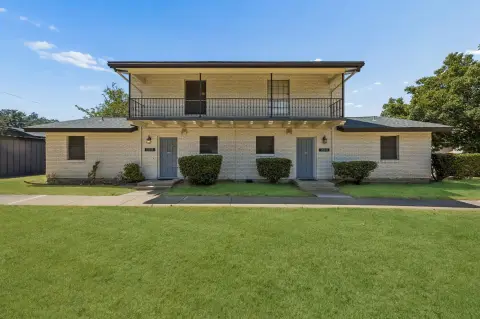
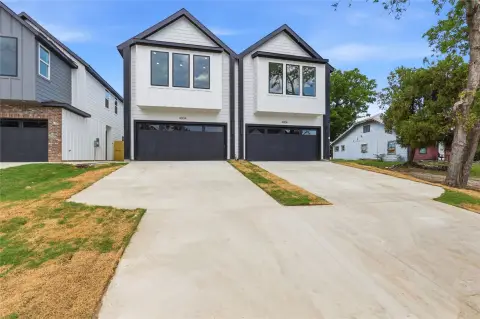
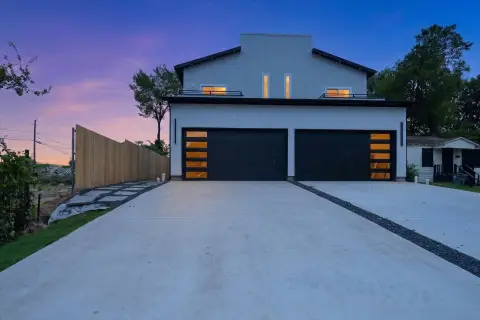
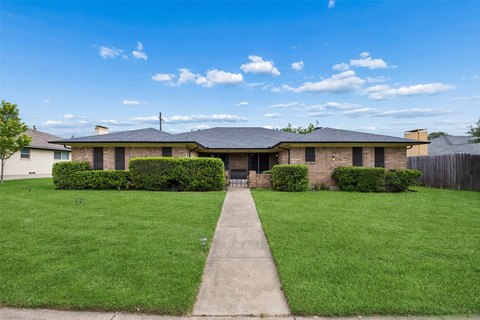
Well-maintained duplex with two leased units, each offering 2 bedrooms and 1 bathroom, plus stainless appliances and stackable washer/dryer.
Property SizeContact for details
Days on Market216
Property Features for 1315 Kings Highway
General Information
Standard status
Active
Total Parking Spaces
4
Property subtype
Duplex
Occupancy
100%
Additional Details
Multifamily Units
2
Amenities
Cable Ready
Central Air
Central
Dryer
Dishwasher
Gas Range
Refrigerator
Washer
Patio, Porch, Sewer Available, Water Available, Cable Available, Composition
Building Details
Year Built
1925
Tenancy
Multi
Listing Agency:
Guildford LTD dba Keller Williams Realty
Listed By:
Seychelle Van Poole · License #0522221
(469) 231-1662
Source:
Kw
Added: Mar 14
Changed: Oct 13
Last Checked: Oct 12 at 5:43PM
Displayed information is deemed reliable but is not guaranteed and should be independently verified. All listing content including descriptions, pricing, images are the copyrighted material of Guildford LTD dba Keller Williams Realty
Investment Insights
Based on property information with market context.
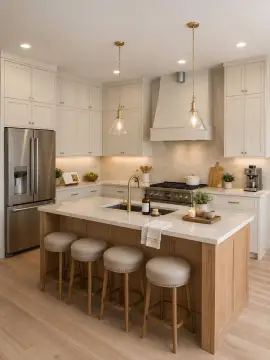
This fully leased duplex offers two separate units, each configured with 2 bedrooms and 1 bathroom. Both units include a full kitchen with stainless steel appliances and a stackable washer and dryer. A four-car carport in the rear provides convenient on-site tenant parking, and the property has been well maintained, including a roof replacement in 2022.
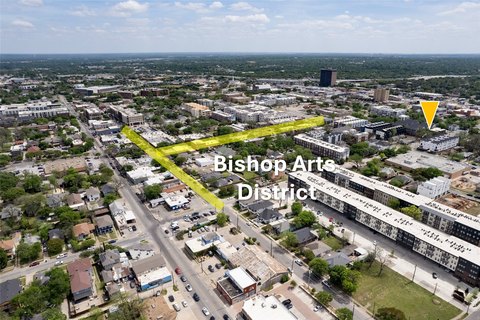
The property is located in the Kings Highway neighborhood near Bishop Arts District, with nearby proximity to Stevens Park Golf Course and Rosemont Elementary School. The area is described as walkable to local destinations, and the home provides easy access to the shops, dining, and entertainment associated with the district.
Water and lawn care are included for the tenants based on current lease terms. The upstairs unit lease expires at the end of June, providing the next owner with the option to move in while continuing to rent the downstairs unit or maintain the property as a fully income-producing asset.
The property is located in the Kings Highway neighborhood near Bishop Arts District, with nearby proximity to Stevens Park Golf Course and Rosemont Elementary School. The area is described as walkable to local destinations, and the home provides easy access to the shops, dining, and entertainment associated with the district.
Water and lawn care are included for the tenants based on current lease terms. The upstairs unit lease expires at the end of June, providing the next owner with the option to move in while continuing to rent the downstairs unit or maintain the property as a fully income-producing asset.
Key Highlights
- Fully leased duplex with 2 units, each featuring 2 bedrooms and 1 bathroom
- Both units are leased for $1,789 per month total, with water and lawn care included
- Upstairs unit lease expires at the end of June, offering flexibility for an owner occupant
Property Analytics
Unlock full access to Insights
Subscribe to Realmo Intelligence
Open Analytics
Current Use
Lease Details
2
Residential units
100%
Occupancy
Multi-tenant
Tenancy
Location Intelligence
Trade Area within ½ mile
944
Businesses Nearby
Explore this area
Business Placement
Demographics for 75208, TX
29,446
Population
13,655
Households
2.2
Avg Household Size
36
Median Age
41%
College-Educated
76%
High-School Grad
6.1 sq mi
ZIP Area
4,827
Density / Sq Mi
$76,502
Median Household Income
$48,460
Median Earnings
$1,589
Median Rent
$415,200
Median Home Value
Check the figures for this property
Cap Rate, Value Estimation, Potential NOI and more
View Realmo Analytics
Market
Vacancy Rate% for Multifamily in South region

Questions? Ask Rey
Realmo’s AI knows this listing — price, zoning, demand, history. Ask anything.




Frequently Asked Questions
What type of property is this?
Duplex - Well-maintained duplex with two leased units, each offering 2 bedrooms and 1 bathroom, plus stainless appliances and stackable washer/dryer.
Where is this duplex located?
The property is located at 1315 Kings Highway Dallas, TX.
What are key features of this property?
This property features: Fully leased duplex with 2 units, each featuring 2 bedrooms and 1 bathroom; Both units are leased for $1,789 per month total, with water and lawn care included; Upstairs unit lease expires at the end of June, offering flexibility for an owner occupant


