Upgraded Duplex with
For Sale
$439,900
9285 & 9287 Agate St, Port Charlotte, FL 33981
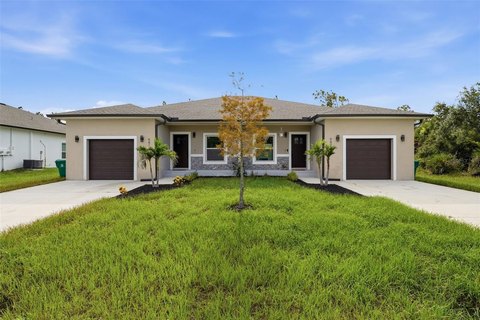
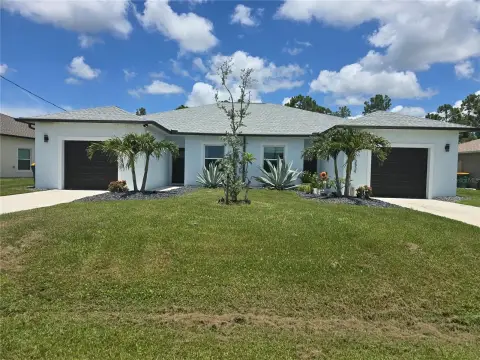
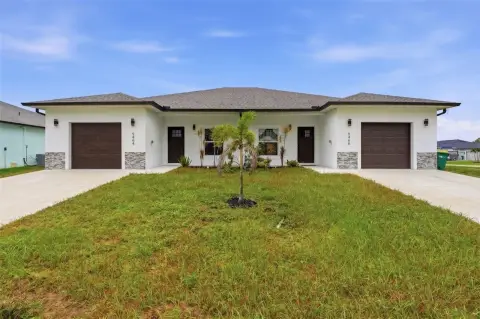
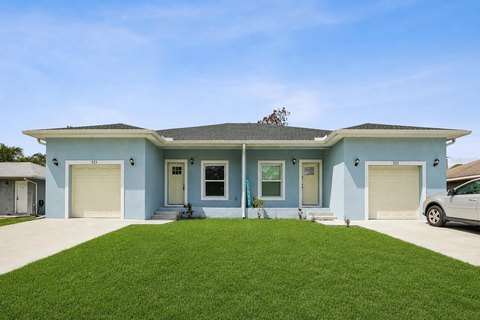
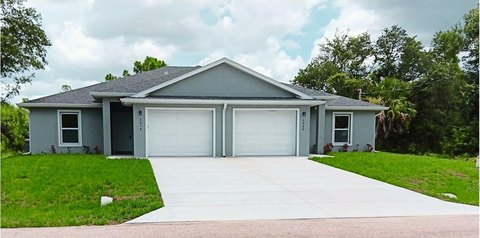
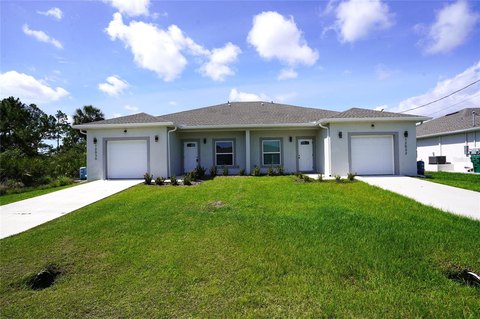
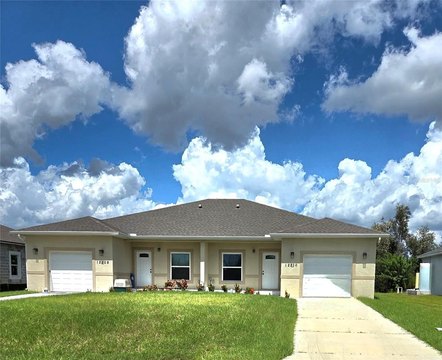
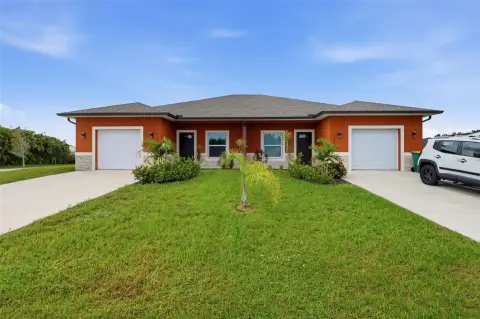
Updated duplex featuring abundant daylight, stainless steel appliances, and hurricane-resistant windows.
Property Size2,250 SF
Price / SF$195.51
Days on Market84
Property Features for 9285 & 9287 Agate St
General Information
Standard status
Active
Size
2,250 SF
Property subtype
Multi-Family
Amenities
9-foot ceilings
hurricane-resistant windows
stainless steel appliances
washer/dryer hookup
ceiling fans with lights
garage
Building Details
Year Built
2024
Listing Agency:
HANK BRILL PROPERTIES LLC
Listed By:
Laurie Clevenger · License #3633279
(941) 473-0600
Source:
Exciterealtyflorida
Added: Jul 26
Changed: Oct 5
Last Checked: Oct 16 at 2:37PM
Displayed information is deemed reliable but is not guaranteed and should be independently verified. All listing content including descriptions, pricing, images are the copyrighted material of HANK BRILL PROPERTIES LLC

Ask AI about this property
Review the available facts, identify missing information and prepare questions for the agent.
Investment Insights
Based on property information with market context.
This duplex offers 2,250 square feet with an upgraded interior designed around natural light. The home includes 9-foot-high ceilings, hurricane-resistant windows, ceiling fans with integrated lights and remote controls, and stainless steel kitchen appliances. Washer and dryer hookups are also provided. Each unit has its own 1-car garage, adding dedicated parking and storage. The property was built in 2024 and includes a 3-bedroom, 2-bath home configuration.
Located near a main road in Port Charlotte, the property is close to restaurants, grocery stores, and shops. The Cove of Rotonda Golf Center is approximately 5 minutes away, while Lemon Bay Golf Club is about a 10-minute drive. Boca Grande Beaches and Englewood Beach are also approximately 10 minutes from the home, with access to major airports, fishing, and boating in the surrounding area.
Located near a main road in Port Charlotte, the property is close to restaurants, grocery stores, and shops. The Cove of Rotonda Golf Center is approximately 5 minutes away, while Lemon Bay Golf Club is about a 10-minute drive. Boca Grande Beaches and Englewood Beach are also approximately 10 minutes from the home, with access to major airports, fishing, and boating in the surrounding area.
Key Highlights
- Duplex with 2,250 square feet, built in 2024
- Each unit includes a 1‑car garage
- 3‑bedroom, 2‑bath home configuration
Financial Insights
Estimated NOI and Cap Rate
NOI / Yr
$21,766
Cap Rate
4.95%
Suggested Prices Based on Cap Rates
Cap Rate 5%
$435,320
$435.3K
Cap Rate 7%
$310,943
$310.9K
Cap Rate 9%
$241,844
$241.8K
Market Conditions
NOI Build-Up for 2,250 SF
Gross rent
$38.3K $17.04/SF
− Vacancy
−$7.2K −$3.22/SF
EGI
$31.1K $13.82/SF
− OpEx
−$9.3K −$4.15/SF
NOI
$21.8K $9.67/SF
Area
Charlotte County, FL
Vacancy
18.90%
Lease Rate
$17.04 /SF/Yr
Expense Ratio
30.00%
Simulate Cap Rate and NOI
Suggested Prices Based on Cap Rates
Cap Rate 5%
$435,320
Cap Rate 7%
$310,943
Cap Rate 9%
$241,844
Alternative Uses
Best Use
Multifamily LT 5
$310.9K
$272.1K – $362.8K
NOI $21,766 @ 7.0% cap · market cap 4.95%
Second Best
Apartment 5plus
$283.8K
$248.3K – $331.1K
NOI $19,864 @ 7.0% cap · market cap 4.52%
Theoretical Best
Office A
$736.7K
$644.6K – $859.5K
NOI $51,570 @ 7.0% cap · market cap 11.72%
Zoning and permitted uses should be independently verified with authorities.
How Realmo checks its estimates
Property Analytics
Unlock full access to Insights
Subscribe to Realmo Intelligence
Open Analytics
Current Use
Location Intelligence
Trade Area within ½ mile
30
Businesses Nearby
Explore this area
Business Placement
Demographics for 33981, FL
13,574
Population
7,808
Households
1.7
Avg Household Size
59
Median Age
27%
College-Educated
93%
High-School Grad
45.4 sq mi
ZIP Area
299
Density / Sq Mi
$71,266
Median Household Income
$36,931
Median Earnings
$1,198
Median Rent
$355,600
Median Home Value
Check the figures for this property
Cap Rate, Value Estimation, Potential NOI and more
View Realmo Analytics
Market
Vacancy Rate% for Multifamily in South region



Frequently Asked Questions
What type of property is this?
Duplex - Updated duplex featuring abundant daylight, stainless steel appliances, and hurricane-resistant windows.
Where is this duplex located?
The property is located at 9285 & 9287 Agate St Port Charlotte, FL.
What is the asking price?
The asking price for this property is $439,900.
What are key features of this property?
This property features: Duplex with 2,250 square feet, built in 2024; Each unit includes a 1‑car garage; 3‑bedroom, 2‑bath home configuration


