Renovated Medical Office
For Sale
$725,000
770 Mill, Reno, NV 89502
Vacant commercial property with updated flooring, HVAC, and central air.
Property Size2,488 SF
Price / SF$291.40
Days on Market315
Property Features for 770 Mill
General Information
Standard status
Active
Size
2,488 SF
Property subtype
Commercial
Building Details
Year Built
1935
Listing Agency:
RE/MAX Gold
Listed By:
Frank Picone · License #S.169095
(775) 691-1348
Source:
Ferrari-lund
Added: Dec 3, 2025
Changed: Oct 13
Last Checked: Oct 12 at 8:15PM
Displayed information is deemed reliable but is not guaranteed and should be independently verified. All listing content including descriptions, pricing, images are the copyrighted material of RE/MAX Gold
Investment Insights
Based on property information with market context.
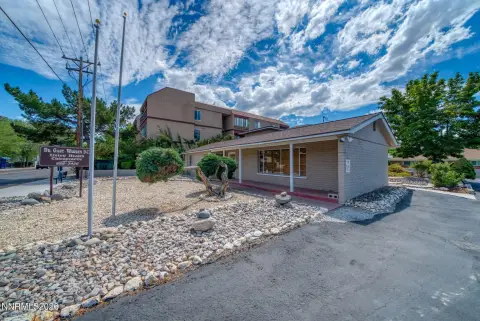
This 2,488-square-foot medical office property at 770 Mill Street includes a recently renovated interior with updated flooring and HVAC. Central air is in place, and the building will be delivered vacant for a new occupant to configure for its business needs.
The property sits along Mill Street near the Renown medical campus in Reno. Commercial zoning supports medical or office use, while on-site, off-street, and street parking options provide practical access. Built in 1935, the property includes a pitched composition roof and a level, landscaped setting.
The property sits along Mill Street near the Renown medical campus in Reno. Commercial zoning supports medical or office use, while on-site, off-street, and street parking options provide practical access. Built in 1935, the property includes a pitched composition roof and a level, landscaped setting.
Key Highlights
- 2,488‑square‑foot medical office property at 770 Mill Street
- Recently renovated office interior with updated flooring and HVAC
- Central air conditioning
Financial Insights
Estimated NOI and Cap Rate
NOI / Yr
$43,981
Cap Rate
6.07%
Suggested Prices Based on Cap Rates
Cap Rate 5%
$879,620
$879.6K
Cap Rate 7%
$628,300
$628.3K
Cap Rate 9%
$488,678
$488.7K
Market Conditions
NOI Build-Up for 2,488 SF
Gross rent
$72.0K $28.92/SF
− Vacancy
−$13.3K −$5.35/SF
EGI
$58.6K $23.57/SF
− OpEx
−$14.7K −$5.89/SF
NOI
$44.0K $17.68/SF
Area
Reno, NV
Vacancy
18.50%
Lease Rate
$28.92 /SF/Yr
Expense Ratio
25.00%
Simulate Cap Rate and NOI
Suggested Prices Based on Cap Rates
Cap Rate 5%
$879,620
Cap Rate 7%
$628,300
Cap Rate 9%
$488,678
Alternative Uses
Best Use
Office B
$628.3K
$549.8K – $733.0K
NOI $43,981 @ 7.0% cap · market cap 6.07%
Second Best
Healthcare Medical
$552.1K
$483.1K – $644.1K
NOI $38,645 @ 7.0% cap · market cap 5.33%
Theoretical Best
Office A
$766.8K
$670.9K – $894.6K
NOI $53,674 @ 7.0% cap · market cap 7.40%
Zoning and permitted uses should be independently verified with authorities.
How Realmo checks its estimates
Property Analytics
Unlock full access to Insights
Subscribe to Realmo Intelligence
Open Analytics
Current Use
Location Intelligence
Trade Area within ½ mile
4,299
Businesses Nearby
Under-served
Demand for This Use
Explore this area
Business Placement
Demographics for 89502, NV
47,062
Population
20,781
Households
2.3
Avg Household Size
36
Median Age
19%
College-Educated
80%
High-School Grad
21.5 sq mi
ZIP Area
2,189
Density / Sq Mi
$62,719
Median Household Income
$36,796
Median Earnings
$1,243
Median Rent
$389,200
Median Home Value
Check the figures for this property
Cap Rate, Value Estimation, Potential NOI and more
View Realmo Analytics
Market
Vacancy Rate% for Office in Reno, NV

Questions? Ask Rey
Realmo’s AI knows this listing — price, zoning, demand, history. Ask anything.




Similar Off Market Nearby
- PetVets RX — 100 E Liberty St, Reno, NV 89501
- M D Kirk Ltd — Reno, NV 89513
- BluePearl Pet Hospital — 555 Morrill Ave, Reno, NV 89512
Frequently Asked Questions
What type of property is this?
Medical Office Space - Vacant commercial property with updated flooring, HVAC, and central air.
Where is this medical office space located?
The property is located at 770 Mill Reno, NV.
What is the asking price?
The asking price for this property is $725,000.
What are key features of this property?
This property features: 2,488‑square‑foot medical office property at 770 Mill Street; Recently renovated office interior with updated flooring and HVAC; Central air conditioning