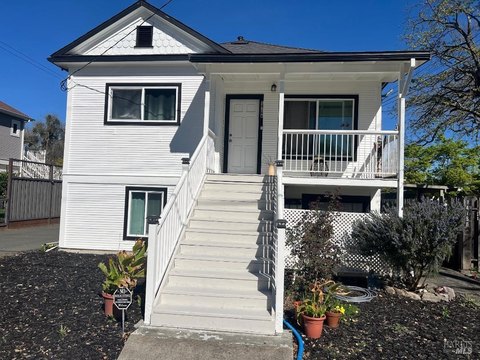
Converted Craftsman Building Near Fuller
For Sale
$1,620,000
563 Jefferson, Napa, CA 94559
Charming office building with live/work potential in desirable Napa location.
Property Size2,700 SF
Price / SF$600
Days on Market483
Property Features for 563 Jefferson
General Information
Standard status
Active
Size
2,700 SF
Building Details
Year Built
1914
Listing Agency:
NAVIGATE REAL ESTATE
Listed By:
TIMO RIVETTI
5803499
Source:
Corcoran
Added: Jun 12, 2025
Changed: Mar 16
Last Checked: Mar 16 at 9:09AM
Displayed information is deemed reliable but is not guaranteed and should be independently verified. All listing content including descriptions, pricing, images are the copyrighted material of NAVIGATE REAL ESTATE
Investment Insights
Based on property information with market context.
This charming converted Craftsman-style building is located across from Fuller Park, offering great visibility and curb appeal in a desirable Napa area. The two-story, well-maintained property is zoned OC (Office Commercial) with live/work potential. It features approximately 2,700 square feet of space, including 7 private offices, a large conference room, a welcoming reception area, a cozy kitchen, and 2 restrooms. Classic architectural details include hardwood floors, built-in cabinetry, operable windows, and 2 decorative fireplaces. The property is ideal for professional or creative use. There are five on-site parking spaces, plus additional street parking. The property is located blocks from Napa's shops, dining, and wine country attractions. Buyer to verify zoning and permitted uses.
Key Highlights
- Prime Location: Across from Fuller Park in a desirable Napa area, close to shops, dining, and wine country attractions.
- Live/Work Potential: Zoned OC (Office Commercial) offering flexibility for residential and commercial use.
- Spacious and Well‑Maintained: Approximately 2,700 sq ft with 7 private offices, a large conference room, reception area, kitchen, and 2 restrooms.
Financial Insights
Estimated NOI and Cap Rate
NOI / Yr
$55,350
Cap Rate
3.42%
Suggested Prices Based on Cap Rates
Cap Rate 5%
$1,107,000
$1.1M
Cap Rate 7%
$790,714
$790.7K
Cap Rate 9%
$615,000
$615.0K
Market Conditions
NOI Build-Up for 2,700 SF
Gross rent
$103.7K $38.40/SF
− Vacancy
−$29.9K −$11.07/SF
EGI
$73.8K $27.33/SF
− OpEx
−$18.4K −$6.83/SF
NOI
$55.3K $20.50/SF
Area
Napa County, CA
Vacancy
28.82%
Lease Rate
$38.40 /SF/Yr
Expense Ratio
25.00%
Simulate Cap Rate and NOI
Suggested Prices Based on Cap Rates
Cap Rate 5%
$1,107,000
Cap Rate 7%
$790,714
Cap Rate 9%
$615,000
Alternative Uses
Best Use
Office B
$790.7K
$691.9K – $922.5K
NOI $55,350 @ 7.0% cap · market cap 3.42%
Second Best
Mixed Use
$378.9K
$331.5K – $442.0K
NOI $26,522 @ 7.0% cap · market cap 1.64%
Theoretical Best
Specialty Retail
$5.45M
$4.77M – $6.36M
NOI $381,393 @ 7.0% cap · market cap 23.54%
Zoning and permitted uses should be independently verified with authorities.
Property Analytics
Unlock full access to Insights
Subscribe to Realmo Intelligence
Open Analytics
Current Use
Location Intelligence
Trade Area within ½ mile
1,519
Businesses Nearby
Explore this area
Business Placement
Demographics for 94559, CA
28,137
Population
11,599
Households
2.4
Avg Household Size
40
Median Age
37%
College-Educated
84%
High-School Grad
41.4 sq mi
ZIP Area
680
Density / Sq Mi
$100,559
Median Household Income
$52,247
Median Earnings
$2,044
Median Rent
$877,100
Median Home Value
Check the figures for this property
Cap Rate, Value Estimation, Potential NOI and more
View Realmo Analytics
Market
Vacancy Rate% for Office in West region

Questions? Ask Rey
Realmo’s AI knows this listing — price, zoning, demand, history. Ask anything.




Frequently Asked Questions
What type of property is this?
Office building - Charming office building with live/work potential in desirable Napa location.
Where is this office building located?
The property is located at 563 Jefferson Napa, CA.
What is the asking price?
The asking price for this property is $1,620,000.
What are key features of this property?
This property features: Prime Location: Across from Fuller Park in a desirable Napa area, close to shops, dining, and wine country attractions.; Live/Work Potential: Zoned OC (Office Commercial) offering flexibility for residential and commercial use.; Spacious and Well‑Maintained: Approximately 2,700 sq ft with 7 private offices, a large conference room, reception area, kitchen, and 2 restrooms.


