Freestanding Downtown Retail/Office
For Sale
Contact for pricing
457 E THOMPSON BLVD, Ventura, CA
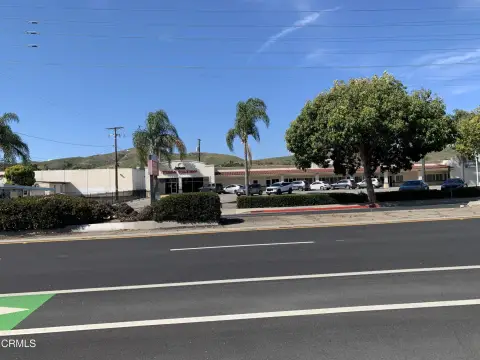
Built in 1937, this single-story freestanding building offers an open floor plan and on-site parking.
Property Size4,000 SF
Lot Size0.16 Acres
Price / SF$398.75
Days on Market166
Property Features for 457 E THOMPSON BLVD
General Information
Standard status
Active
Size
4,000 SF
Class
B
Total Parking Spaces
6
Lot size
0.16 Acres
Property subtype
Retail, Office
Zoning
T6.1
Investment Type
Owner/User
Building Details
Year Built
1937
Buildings
1
Stories
1
Units
5
Listing Agency:
KW Partner San Diego
Listed By:
Christopher Parrino · License #01350268
Source:
Crexi
Added: May 8
Changed: Oct 9
Last Checked: Oct 19 at 6:06AM
Displayed information is deemed reliable but is not guaranteed and should be independently verified. All listing content including descriptions, pricing, images are the copyrighted material of KW Partner San Diego

Ask AI about this property
Review the available facts, identify missing information and prepare questions for the agent.
Investment Insights
Based on property information with market context.
457 E Thompson Blvd is a 4,000 SF freestanding commercial building on a 6,969 SF parcel in Downtown Ventura. Built in 1937, the property features an Art Deco-style front façade and exposed brick detailing at the rear, with interior character defined by exposed wood ceiling and prominent crossbeam design.
The building is single-story with an open floor plan, concrete subfloor, and no shared walls. This configuration supports flexible tenant planning across a range of uses including retail, office, medical, showroom, fitness, or service-oriented businesses, with the ability to customize without requiring major structural modification.
For parking, there are 6 on-site spaces on the east side of the building, with additional public parking in the lots directly behind the property and across S Oak St. The property is delivered vacant at closing and is available for sale by appointment only, with no disturbance of the tenant.
The building is single-story with an open floor plan, concrete subfloor, and no shared walls. This configuration supports flexible tenant planning across a range of uses including retail, office, medical, showroom, fitness, or service-oriented businesses, with the ability to customize without requiring major structural modification.
For parking, there are 6 on-site spaces on the east side of the building, with additional public parking in the lots directly behind the property and across S Oak St. The property is delivered vacant at closing and is available for sale by appointment only, with no disturbance of the tenant.
Key Highlights
- 4,000 SF freestanding commercial building built in 1937 on a 6,969 SF parcel in Downtown Ventura
- Single‑story, open floor plan with a concrete subfloor and no shared walls for flexible use and layout planning
- Exposed wood ceiling and prominent crossbeam design with Art Deco‑style front facade and exposed brick detailing in back
Financial Insights
Estimated NOI and Cap Rate
NOI / Yr
$140,716
Cap Rate
8.82%
Suggested Prices Based on Cap Rates
Cap Rate 5%
$2,814,320
$2.8M
Cap Rate 7%
$2,010,229
$2.0M
Cap Rate 9%
$1,563,511
$1.6M
Market Conditions
NOI Build-Up for 4,000 SF
Gross rent
$224.2K $56.04/SF
− Vacancy
−$36.5K −$9.13/SF
EGI
$187.6K $46.91/SF
− OpEx
−$46.9K −$11.73/SF
NOI
$140.7K $35.18/SF
Area
Santa Clara County, CA
Vacancy
16.30%
Lease Rate
$56.04 /SF/Yr
Expense Ratio
25.00%
Simulate Cap Rate and NOI
Suggested Prices Based on Cap Rates
Cap Rate 5%
$2,814,320
Cap Rate 7%
$2,010,229
Cap Rate 9%
$1,563,511
Alternative Uses
Best Use
Office B
$2.01M
$1.76M – $2.35M
NOI $140,716 @ 7.0% cap · market cap 8.82%
Second Best
Retail
$1.54M
$1.35M – $1.80M
NOI $108,046 @ 7.0% cap · market cap 6.77%
Theoretical Best
Office A
$2.41M
$2.11M – $2.82M
NOI $169,040 @ 7.0% cap · market cap 10.60%
Zoning and permitted uses should be independently verified with authorities.
How Realmo checks its estimates
Property Analytics
Unlock full access to Insights
Subscribe to Realmo Intelligence
Open Analytics
Current Use
Location Intelligence
Trade Area within ½ mile
5,272
Businesses Nearby
Explore this area
Business Placement
Check the figures for this property
Cap Rate, Value Estimation, Potential NOI and more
View Realmo Analytics
Market
Vacancy Rate% for Office in West region



Frequently Asked Questions
What type of property is this?
Retail space - Built in 1937, this single-story freestanding building offers an open floor plan and on-site parking.
Where is this retail space located?
The property is located at 457 E THOMPSON BLVD Ventura, CA.
What is the asking price?
The asking price for this property is $1,595,000.
What are key features of this property?
This property features: 4,000 SF freestanding commercial building built in 1937 on a 6,969 SF parcel in Downtown Ventura; Single‑story, open floor plan with a concrete subfloor and no shared walls for flexible use and layout planning; Exposed wood ceiling and prominent crossbeam design with Art Deco‑style front facade and exposed brick detailing in back


