Automotive Sales Facility with Street
For Sale
$1,000,000
2531 E Thompson Blvd, Ventura, CA 93003
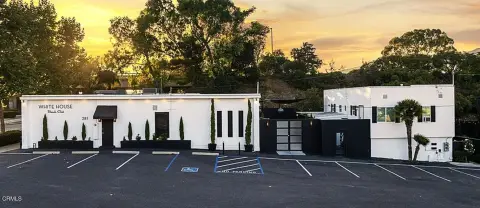
Owner-user automotive property on a Ventura commercial corridor with strong street frontage and consistent customer visibility.
Property Size3,520 SF
Price / SF$284.09
Days on Market102
Property Features for 2531 E Thompson Blvd
General Information
Standard status
Active
Size
3,520 SF
Property subtype
Vacant-User
Amenities
Established Automotive Retail Use – currently a used car facility, well positioned for continued auto use in a corridor known for automotive businesses and strong consumer demand.
Prominent Street Frontage and Visibility - The property offers direct frontage along East Thompson Boulevard, with strong exposure, signage opportunities, and high visibility.
Surrounded by Established Demand Drivers - Located near dense residential neighborhoods, local businesses, and major commuter routes, benefiting from steady local and pass-through traffic.
Prime Infill Coastal Ventura Location - Strategically positioned along East Thompson Boulevard, a major east-west arterial serving Ventura's established retail and automotive corridor, the property benefits from strong traffic counts, excellent visibility, and a highly desirable location within one of Southern California's most supply constrained coastal markets.
Rare Infill Parcel in a Built Out Trade Area - Situated between two established commercial properties, the site represents a unique infill opportunity in a mature market where limited land availability and significant barriers to new development support long term real estate fundamentals.
Value Add and Owner User Flexibility - The offering provides investors with the opportunity to enhance value through future leasing strategies and operational improvements, while also presenting owner users the ability to acquire a highly visible and strategically located commercial site for their business.
Attractive Entry Point into Ventura's Coastal Market - The property presents a rare opportunity to acquire a commercial asset in Ventura's highly sought after coastal market, offering strong underlying real estate fundamentals, limited future supply, and long term appreciation potential.
Building Details
Building Size
3,520 SF
Year Built
1975
Listing Agency:
Marcus & Millichap - Los Angeles
Listed By:
Orbell Ovaness · License #License(s): CA: 01402142
(213) 943-1822
Source:
Marcusmillichap
Added: Jun 28
Changed: Sep 6
Last Checked: Oct 5 at 3:03PM
Displayed information is deemed reliable but is not guaranteed and should be independently verified. All listing content including descriptions, pricing, images are the copyrighted material of Marcus & Millichap - Los Angeles
Investment Insights
Based on property information with market context.
The property at 2531 E Thompson Blvd is currently utilized as an automotive sales facility, offering an efficient layout designed for customer-facing operations. It sits on an infill parcel positioned between two established commercial buildings, providing direct street presence along East Thompson Boulevard. The offering also allows for continued automotive use or adaptation to an alternative commercial application, subject to applicable approvals.
Located along one of Ventura’s established commercial corridors, the site benefits from strong street frontage and visibility with consistent traffic exposure. The surrounding area includes established residential neighborhoods as well as neighborhood-serving retail and automotive-related businesses, supporting an active mix of local customer activity along the thoroughfare.
For owner users, the site provides long-term control of a well-positioned storefront in a mature coastal market where comparable commercial opportunities can be limited. The combination of direct exposure, accessible frontage, and a layout suited to automotive retail makes it a practical fit for operators seeking visibility and customer access, with the flexibility to pursue alternative commercial uses subject to approvals.
Located along one of Ventura’s established commercial corridors, the site benefits from strong street frontage and visibility with consistent traffic exposure. The surrounding area includes established residential neighborhoods as well as neighborhood-serving retail and automotive-related businesses, supporting an active mix of local customer activity along the thoroughfare.
For owner users, the site provides long-term control of a well-positioned storefront in a mature coastal market where comparable commercial opportunities can be limited. The combination of direct exposure, accessible frontage, and a layout suited to automotive retail makes it a practical fit for operators seeking visibility and customer access, with the flexibility to pursue alternative commercial uses subject to approvals.
Key Highlights
- Automotive sales facility on E. Thompson Boulevard in Ventura’s established commercial corridor
- Built in 1975, owner‑user commercial property with strong street frontage
- Infill parcel positioned between two established commercial buildings
Financial Insights
Estimated NOI and Cap Rate
NOI / Yr
$56,357
Cap Rate
5.64%
Suggested Prices Based on Cap Rates
Cap Rate 5%
$1,127,140
$1.1M
Cap Rate 7%
$805,100
$805.1K
Cap Rate 9%
$626,189
$626.2K
Market Conditions
NOI Build-Up for 3,520 SF
Gross rent
$84.5K $24.00/SF
− Vacancy
−$4.0K −$1.13/SF
EGI
$80.5K $22.87/SF
− OpEx
−$24.2K −$6.86/SF
NOI
$56.4K $16.01/SF
Area
Ventura County, CA
Vacancy
4.70%
Lease Rate
$24.00 /SF/Yr
Expense Ratio
30.00%
Simulate Cap Rate and NOI
Suggested Prices Based on Cap Rates
Cap Rate 5%
$1,127,140
Cap Rate 7%
$805,100
Cap Rate 9%
$626,189
Alternative Uses
Best Use
Retail
$805.1K
$704.5K – $939.3K
NOI $56,357 @ 7.0% cap · market cap 5.64%
Second Best
Industrial
$512.6K
$448.5K – $598.0K
NOI $35,879 @ 7.0% cap · market cap 3.59%
Theoretical Best
Office A
$1.21M
$1.06M – $1.41M
NOI $84,588 @ 7.0% cap · market cap 8.46%
Zoning and permitted uses should be independently verified with authorities.
Property Analytics
Unlock full access to Insights
Subscribe to Realmo Intelligence
Open Analytics
Current Use
Location Intelligence
Trade Area within ½ mile
535
Businesses Nearby
25k
Monthly Visits Nearby
Under-served
Demand for This Use
Explore this area
Business Placement
Foot Traffic Nearby
Dining 100%
Jersey Mike's Subs
Dining
10,904 visits/mo
0.4 miles
Starbucks
Dining
10,854 visits/mo
0.4 miles
Domino's Pizza
Dining
3,243 visits/mo
0.5 miles
Demographics for 93003, CA
50,558
Population
20,734
Households
2.4
Avg Household Size
42
Median Age
41%
College-Educated
92%
High-School Grad
20.8 sq mi
ZIP Area
2,431
Density / Sq Mi
$100,300
Median Household Income
$50,185
Median Earnings
$2,173
Median Rent
$781,600
Median Home Value
Check the figures for this property
Cap Rate, Value Estimation, Potential NOI and more
View Realmo Analytics
Market
Vacancy Rate% for Retail in West region

Questions? Ask Rey
Realmo’s AI knows this listing — price, zoning, demand, history. Ask anything.




Similar Off Market Nearby
- Car Donations & Junk Car Removal — 5040 telegraph rd, ventura, ca 93003
- CAMPERS CHOICE MOBILE RV REPAIR — 41 S Wake Forest Ave, Ventura, CA 93003
- Buena Auto Care — 5898 Telegraph Rd, Ventura, CA 93003
- ClearChoiceAutomotive&RV llc — 5505 Topa Topa Dr, Ventura, CA 93003
- clearchoiceRVservice — 5505 Topa Topa Dr, Ventura, CA 93003
Frequently Asked Questions
What type of property is this?
Auto shop - Owner-user automotive property on a Ventura commercial corridor with strong street frontage and consistent customer visibility.
Where is this auto shop located?
The property is located at 2531 E Thompson Blvd Ventura, CA.
What is the asking price?
The asking price for this property is $1,000,000.
What are key features of this property?
This property features: Automotive sales facility on E. Thompson Boulevard in Ventura’s established commercial corridor; Built in 1975, owner‑user commercial property with strong street frontage; Infill parcel positioned between two established commercial buildings



