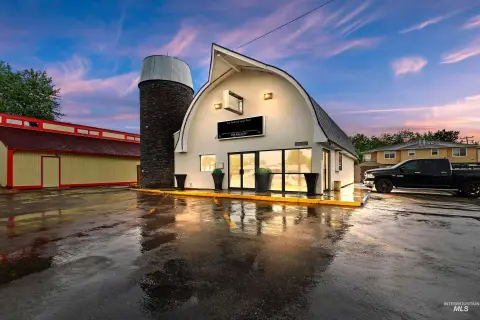
West Boise Multi-Tenant Office
For Sale
$7,550,000
350 N Mitchell St, Boise, ID 83704
43,142 SF office building in West Boise for sale.
Property Size43,142 SF
Price / SF$175
Days on Market153
Property Features for 350 N Mitchell St
General Information
Standard status
Active
Size
43,142 SF
Property subtype
Office
Occupancy
87%
Net Operating Income
$566,117
Building Details
Building Size
43,142 SF
Listing Agency:
TOK Commercial
Listed By:
Kekaula Kaniho
(208) 280-3130
Source:
Tokcommercial
Added: May 16
Changed: Oct 13
Last Checked: Oct 14 at 9:34PM
Displayed information is deemed reliable but is not guaranteed and should be independently verified. All listing content including descriptions, pricing, images are the copyrighted material of TOK Commercial
Investment Insights
Based on property information with market context.
Cottonwood Plaza is a 43,142 square foot multi-tenant office building located in West Boise. Constructed in 2000, the property is currently 87% occupied. The building houses four tenants: Zayo, Bartlett Roofing, Giltner Logistics, and Accel Therapies, all operating under NNN leases with 3% annual rent escalations. The current net operating income is $566,117. There is currently 5,625 square feet of vacant space. Bartlett Roofing has notified ownership that they expect to vacate at their lease expiration of 08/31/2027, making 17,404 square feet available on 09/01/2027. Located in the heart of West Boise near Emerald Street and minutes from I-184, Cottonwood Plaza provides access to Downtown Boise, the Boise Airport, and the broader Treasure Valley. The property is surrounded by retail, dining, and business services, with nearby national retailers and major employment hubs.
Key Highlights
- High‑traffic West Boise location, conveniently located near I‑184 and amenities.
- Strong existing cash flow from nationally recognized tenants under NNN leases.
- Value‑add opportunity through lease‑up of current vacancy and future vacancy in 2027.
Financial Insights
Estimated NOI and Cap Rate
NOI / Yr
$584,358
Cap Rate
7.74%
Suggested Prices Based on Cap Rates
Cap Rate 5%
$11,687,160
$11.7M
Cap Rate 7%
$8,347,971
$8.3M
Cap Rate 9%
$6,492,867
$6.5M
Market Conditions
NOI Build-Up for 43,142 SF
Gross rent
$906.0K $21.00/SF
− Vacancy
−$126.8K −$2.94/SF
EGI
$779.1K $18.06/SF
− OpEx
−$194.8K −$4.52/SF
NOI
$584.4K $13.54/SF
Area
Ada County, ID
Vacancy
14.00%
Lease Rate
$21.00 /SF/Yr
Expense Ratio
25.00%
Simulate Cap Rate and NOI
Suggested Prices Based on Cap Rates
Cap Rate 5%
$11,687,160
Cap Rate 7%
$8,347,971
Cap Rate 9%
$6,492,867
Alternative Uses
Best Use
Office B
$8.35M
$7.30M – $9.74M
NOI $584,358 @ 7.0% cap · market cap 7.74%
Second Best
—
—
no second resolved use
Theoretical Best
Office A
$11.91M
$10.43M – $13.90M
NOI $834,021 @ 7.0% cap · market cap 11.05%
Zoning and permitted uses should be independently verified with authorities.
How Realmo checks its estimates
Property Analytics
Unlock full access to Insights
Subscribe to Realmo Intelligence
Open Analytics
Current Use
Location Intelligence
Trade Area within ½ mile
485
Businesses Nearby
Explore this area
Business Placement
Demographics for 83704, ID
42,430
Population
17,776
Households
2.4
Avg Household Size
37
Median Age
32%
College-Educated
92%
High-School Grad
8.8 sq mi
ZIP Area
4,822
Density / Sq Mi
$70,806
Median Household Income
$37,201
Median Earnings
$1,363
Median Rent
$354,400
Median Home Value
Check the figures for this property
Cap Rate, Value Estimation, Potential NOI and more
View Realmo Analytics
Market
Vacancy Rate% for Office in Boise, ID

Questions? Ask Rey
Realmo’s AI knows this listing — price, zoning, demand, history. Ask anything.




Frequently Asked Questions
What type of property is this?
Office building - 43,142 SF office building in West Boise for sale.
Where is this office building located?
The property is located at 350 N Mitchell St Boise, ID.
What is the asking price?
The asking price for this property is $7,550,000.
What are key features of this property?
This property features: High‑traffic West Boise location, conveniently located near I‑184 and amenities.; Strong existing cash flow from nationally recognized tenants under NNN leases.; Value‑add opportunity through lease‑up of current vacancy and future vacancy in 2027.


