4-Unit MCM
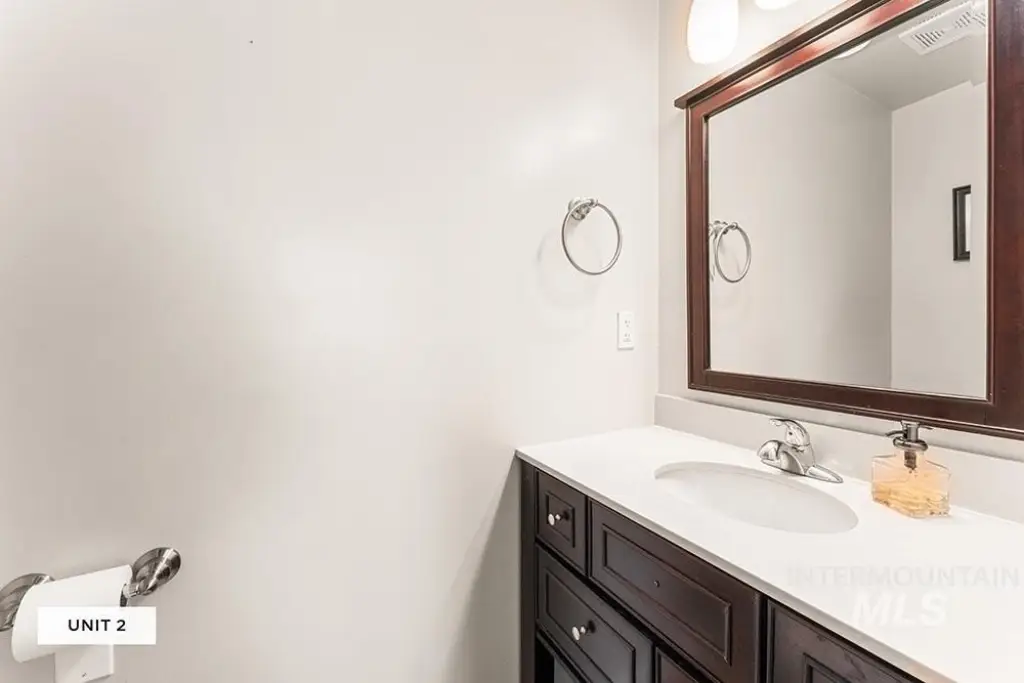
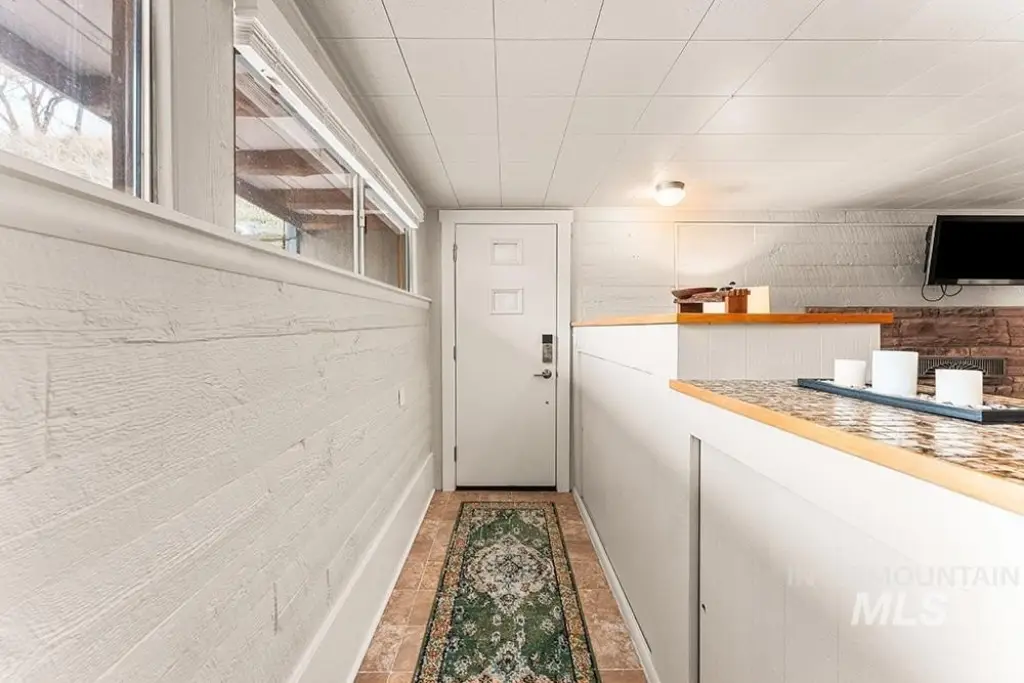
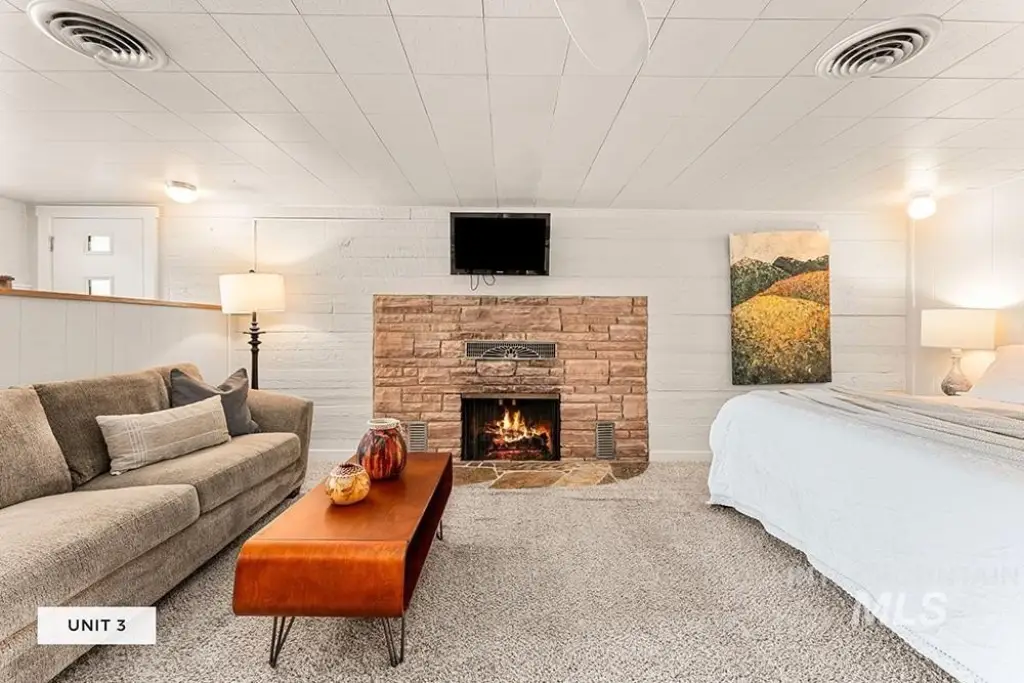
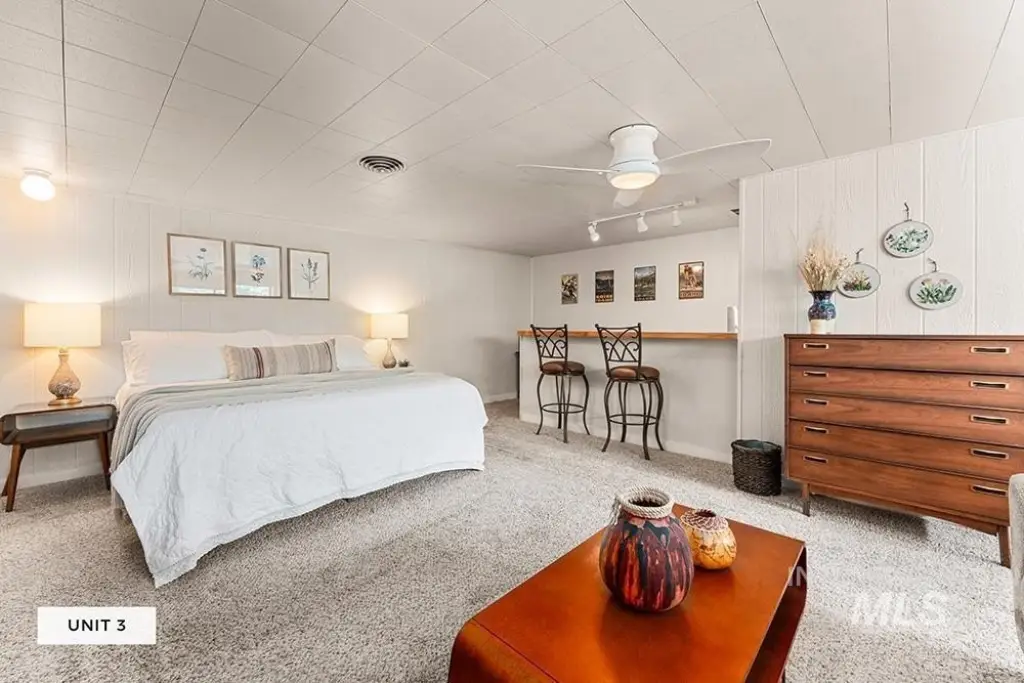
For Sale
$899,900
4480 N Kitsap Way, Boise, ID 83703
Residential Income, Boise, ID
Property Size2,729 SF
Lot Size0.51 Acres
Price / SF$329.75
Days on Market94
Property Features for 4480 N Kitsap Way
General Information
Property type
Residential Multi Family
Property subtype
Other
Bedrooms
5
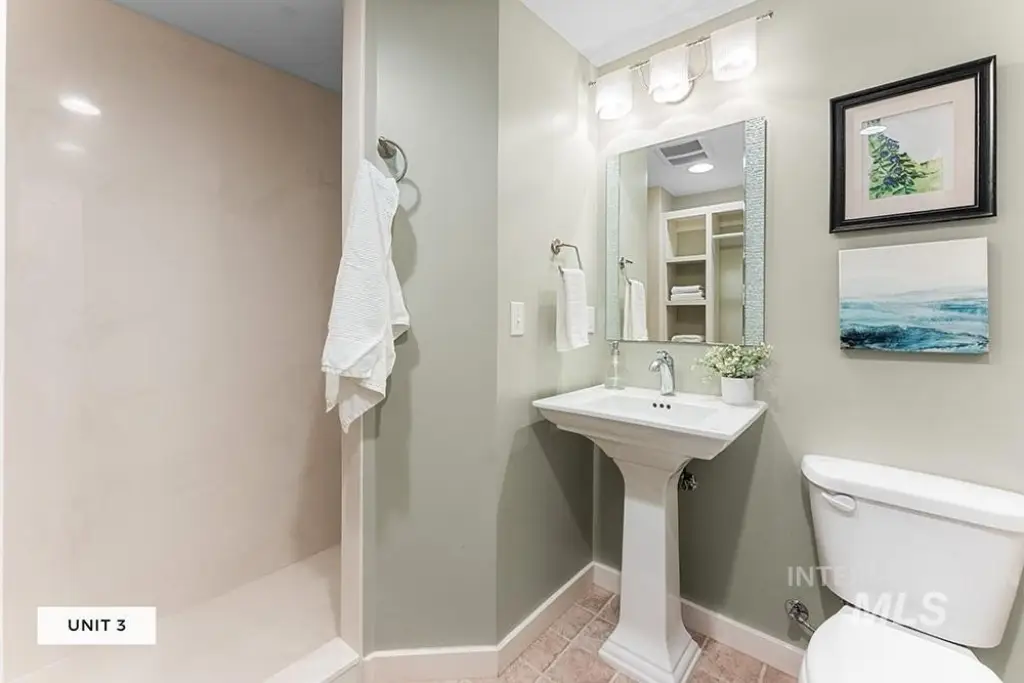
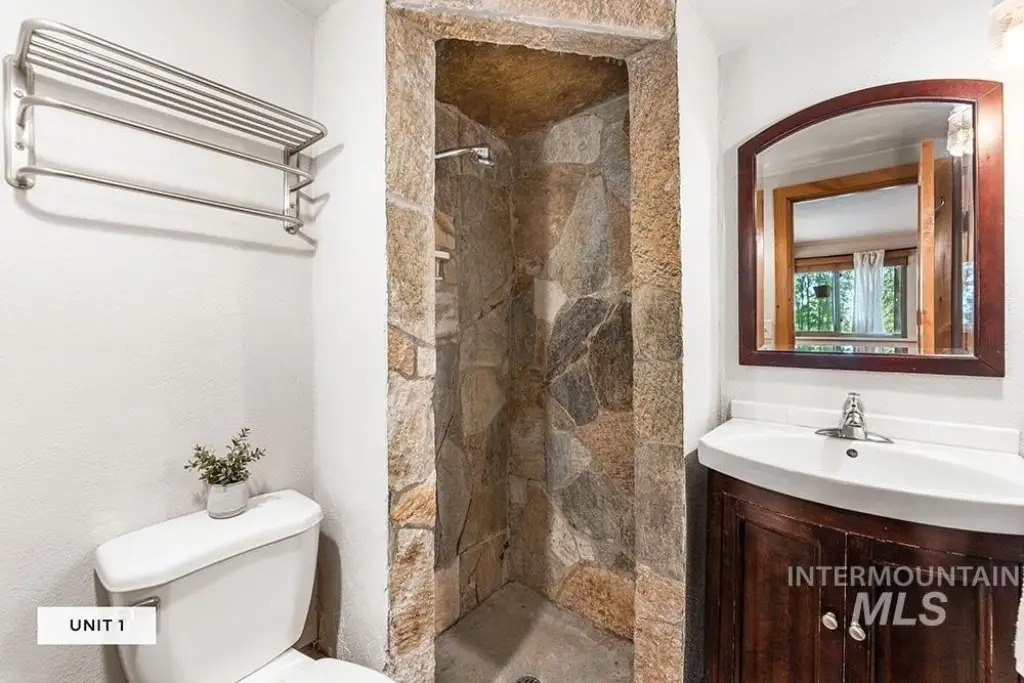
Bathrooms
4
Full bathrooms
4
Rooms
Bathroom 2, Bedroom 5, Bedroom 4, Bedroom 3, Bathroom 3, Bathroom 1, Bedroom 1, Bathroom 4, Bedroom 2
Parking
8
Parking features
RV
Fireplace
1
Appliances
Disposal (Some Units), Stove/Range (Some Units), Refrigerator (No Units), Washer/Dryer (Some Units)
Subdivision
0 Not Applic.
Lot features
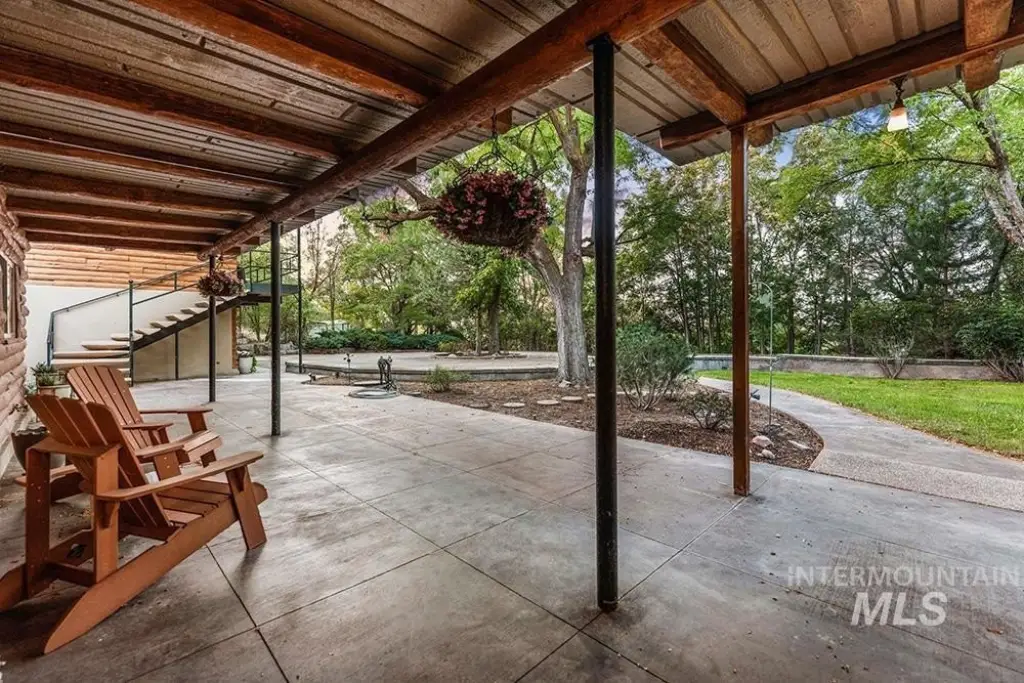
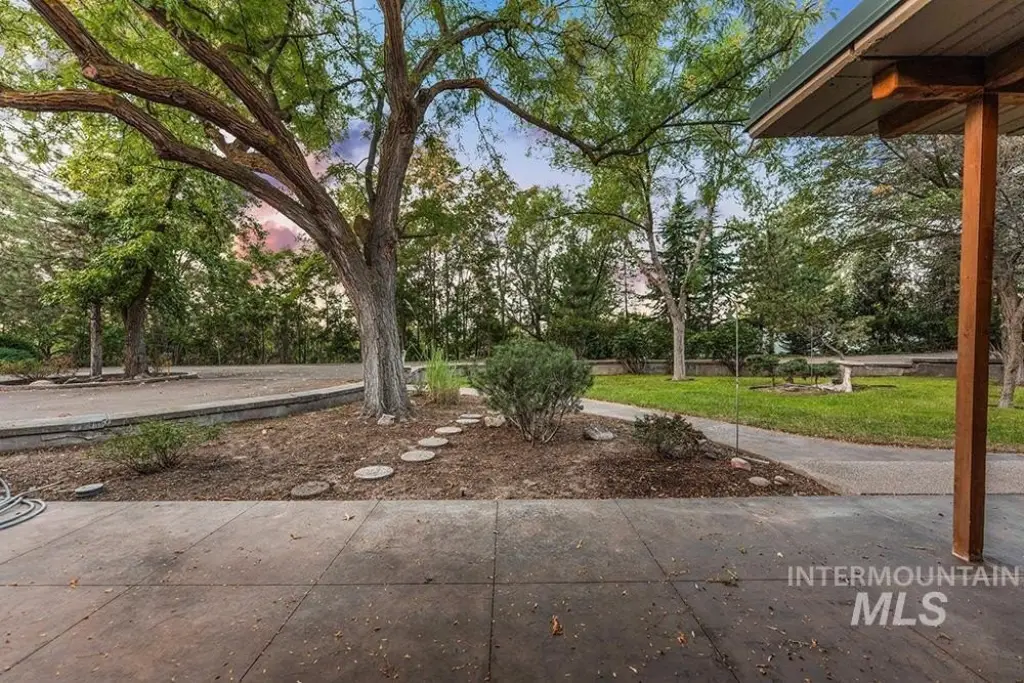
1/2 - .99 Acre, Garden, R. V. Parking
Elementary school
Collister
Middle school
Hillside
High school
Boise
Elementary school district
Boise School District #1
Middle school district
Boise School District #1
High school district
Boise School District #1
Directions
N on Harrison Blvd, L Hill Rd past the 36th Street round about, R Kitsap Way
Standard status
Active
APN
S0629120635
Size
2,729 SF
Lot size
0.51 Acres
Taxes and HOA fees
Tax Year
2025
Tax Description
See Attached Exhibit A
Tax Annual Amount
5862
Legal Description
See Attached Exhibit A
Utilities
Heating system
Hot Water(Heating), Baseboard, Fireplace(s), Radiant, Forced Air
Cooling system
Window Unit(s), Wall/Window Unit(s)
Amenities
fireplace
radiant floor heating
Building Details
Year built
1954
Number of units
4
Flooring type
Laminate
Building materials
Log
Roof type
Tar/Gravel
Listing Agency:
Keller Williams Realty Boise
(208) 672-9000
Listed By:
Lysi Bishop · License #SP20072
(208) 870-8292
Added: Jul 6
Changed: Sep 13
Last Checked: Oct 7 at 2:06AM
MLS# 98992883
Copyright © 2026 Intermountain Multiple Listing Service. All rights reserved. All information provided by the listing agent/broker is deemed reliable but is not guaranteed and should be independently verified.
Investment Insights
Based on property information with market context.
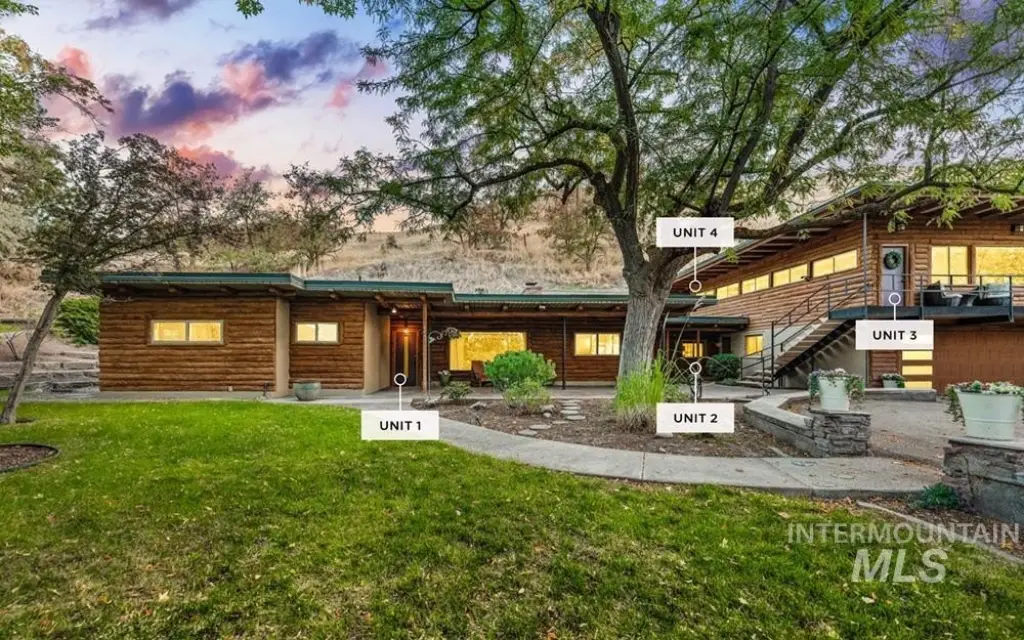
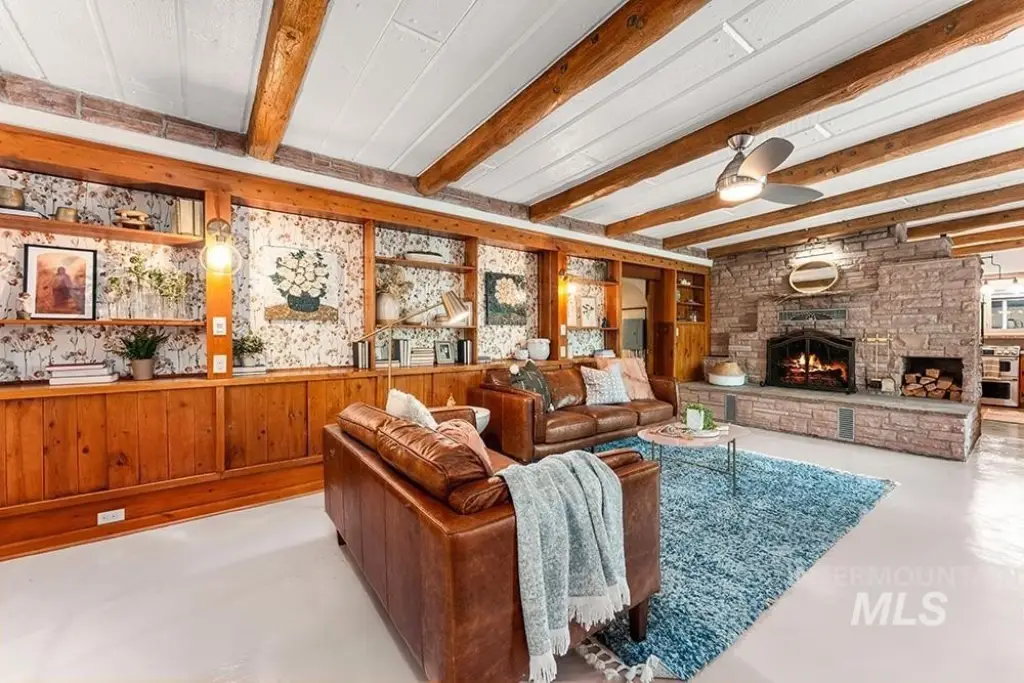
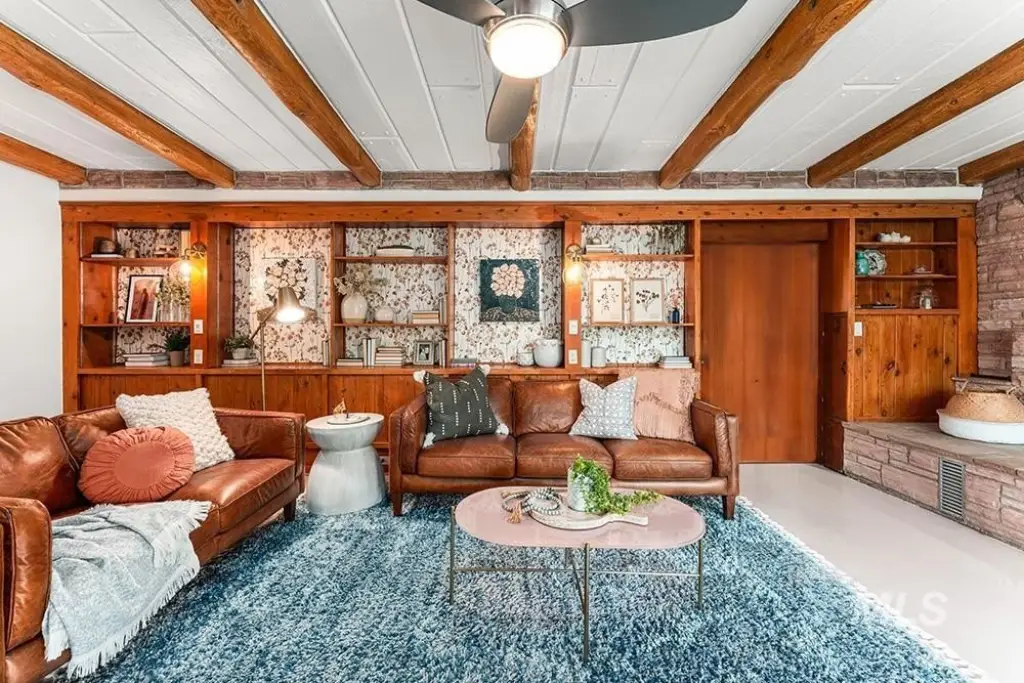
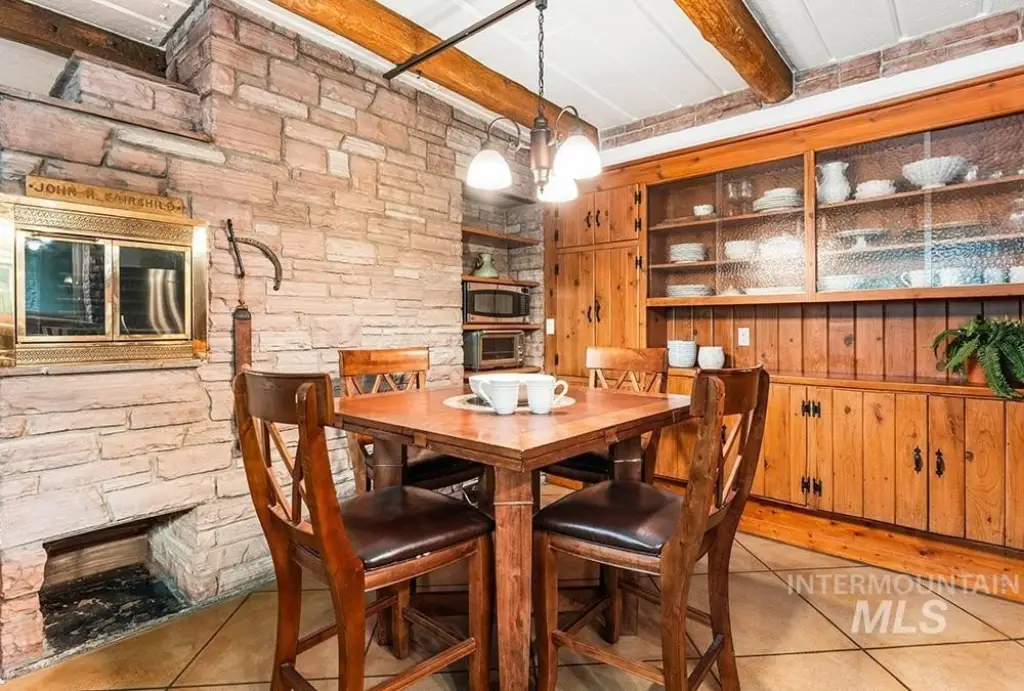
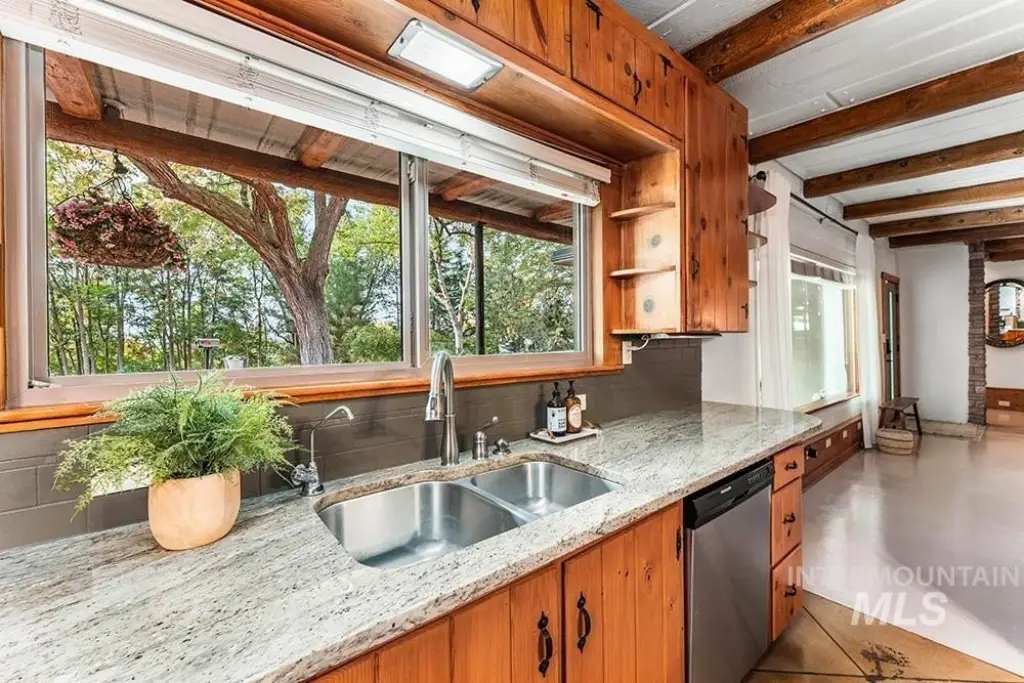
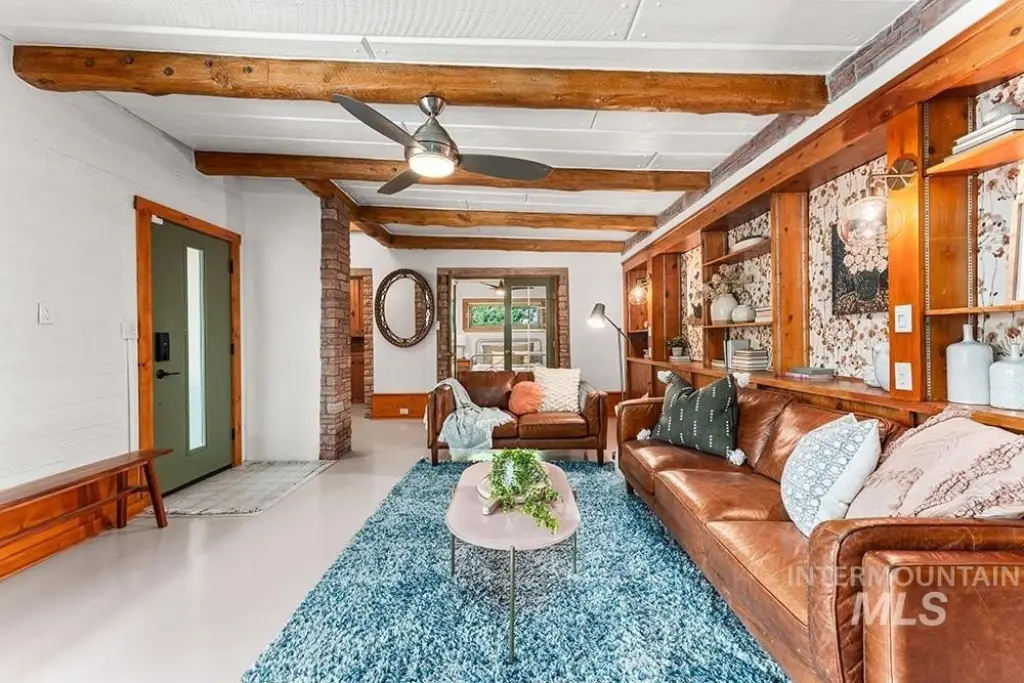
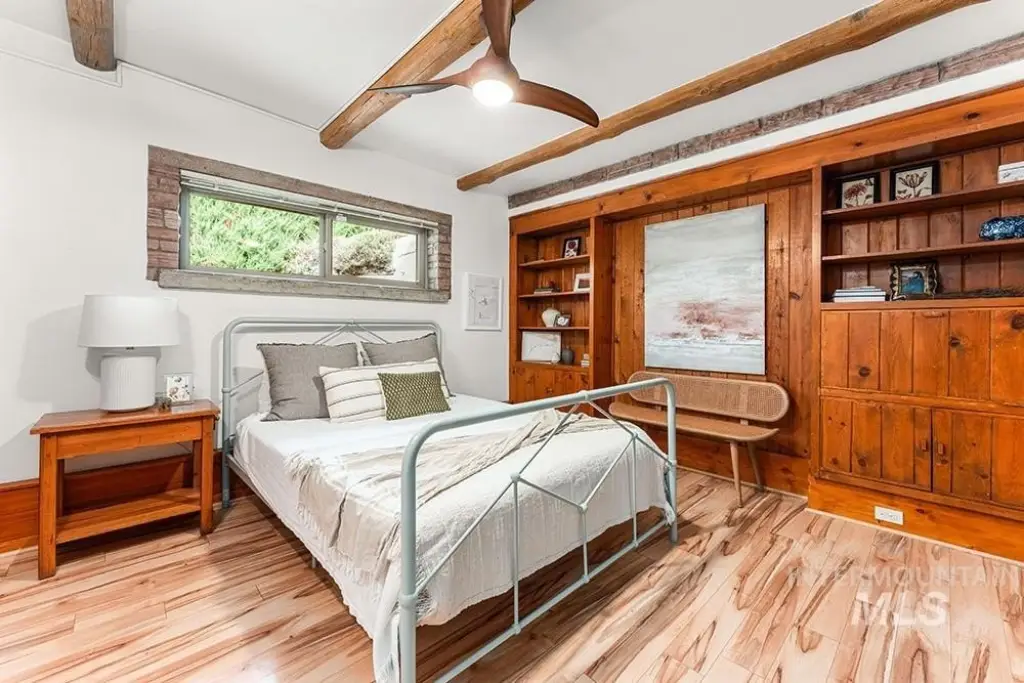
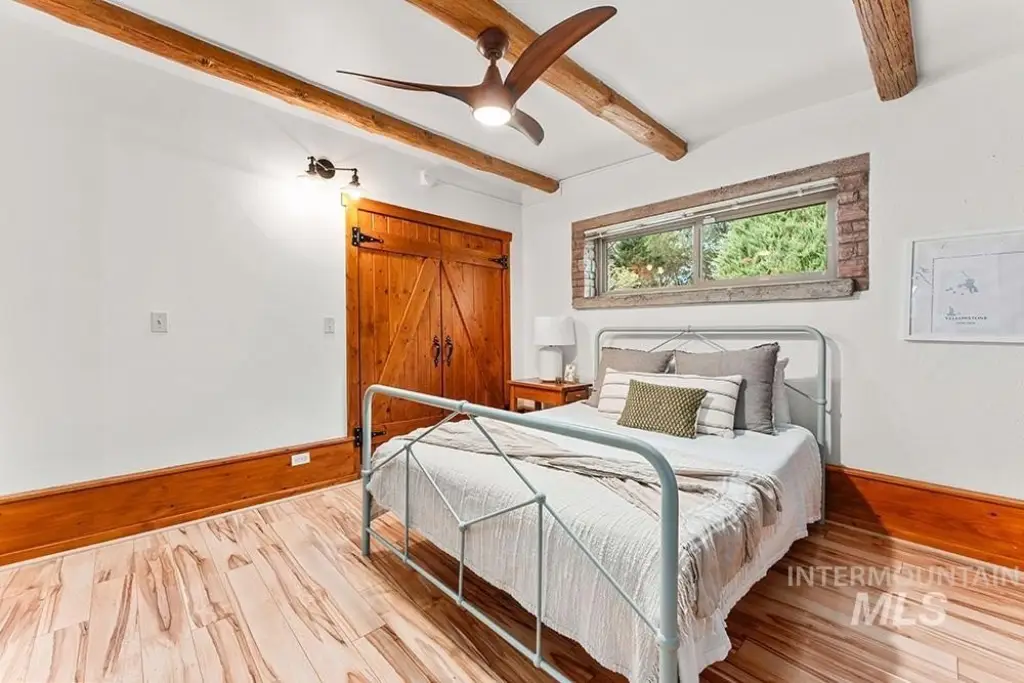
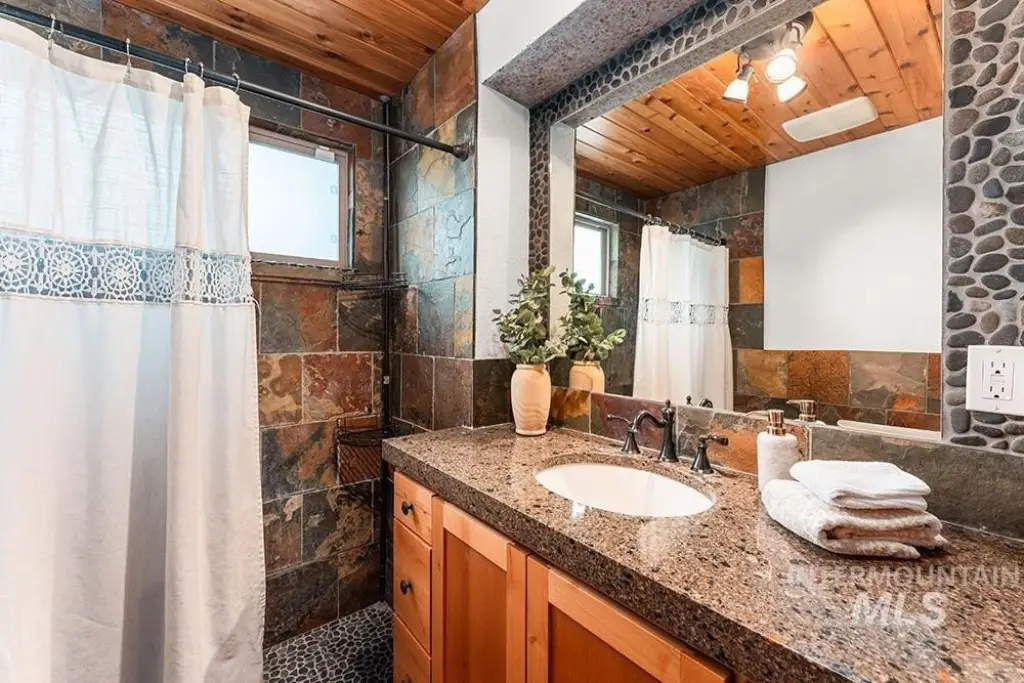
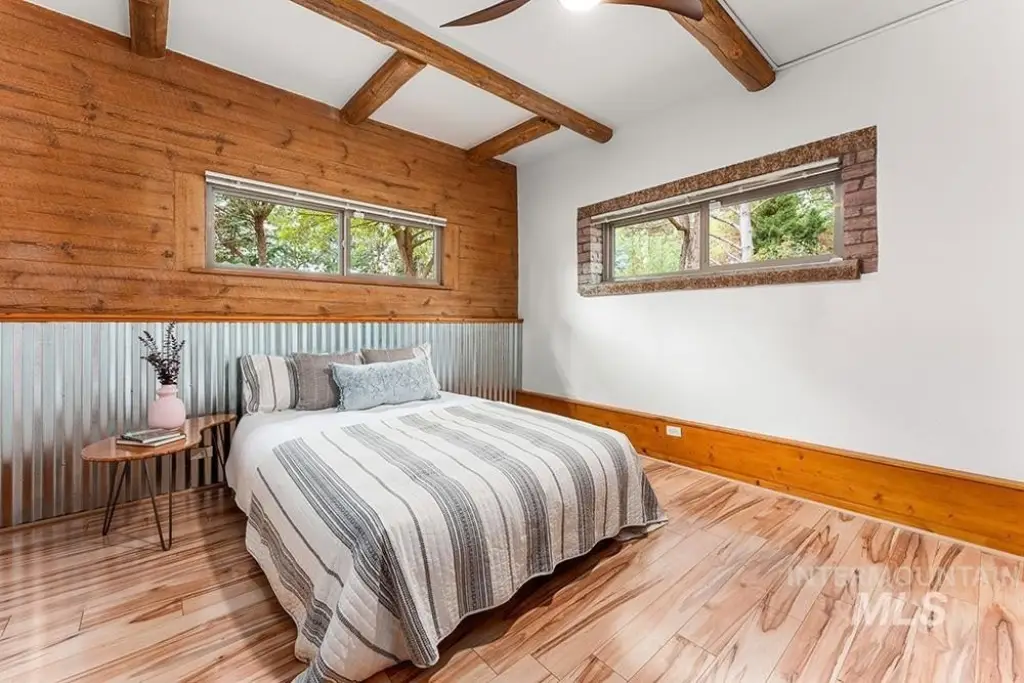
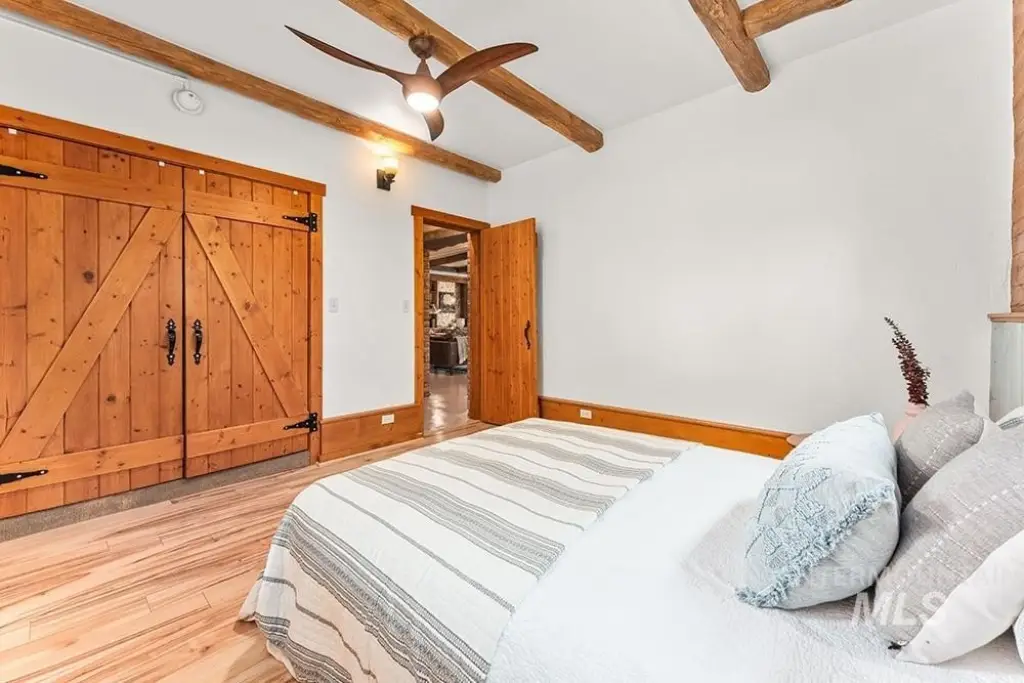
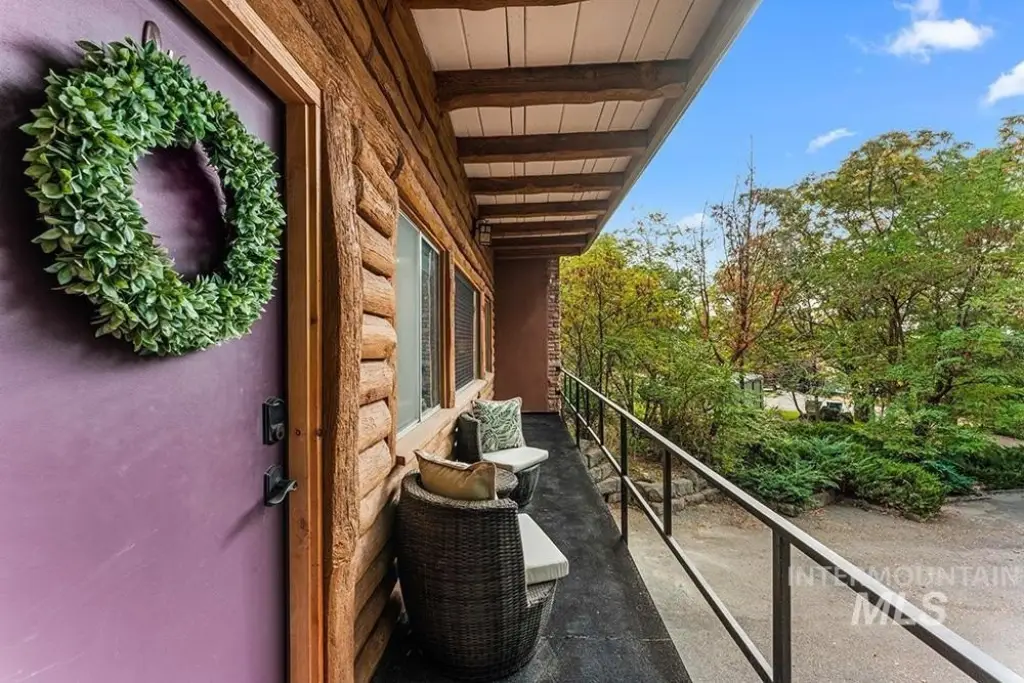
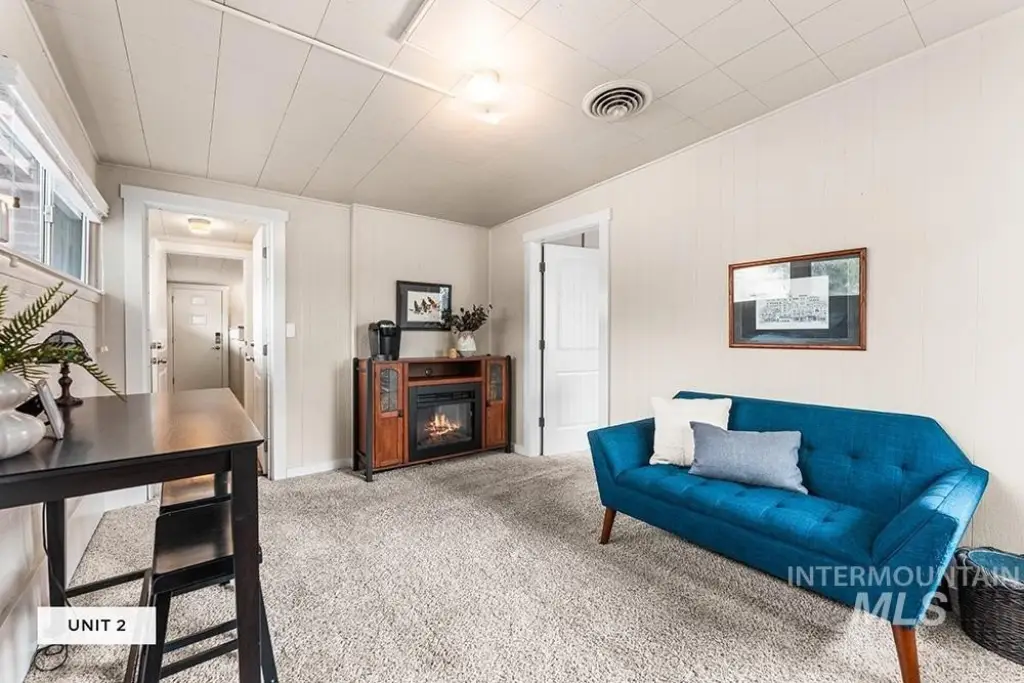
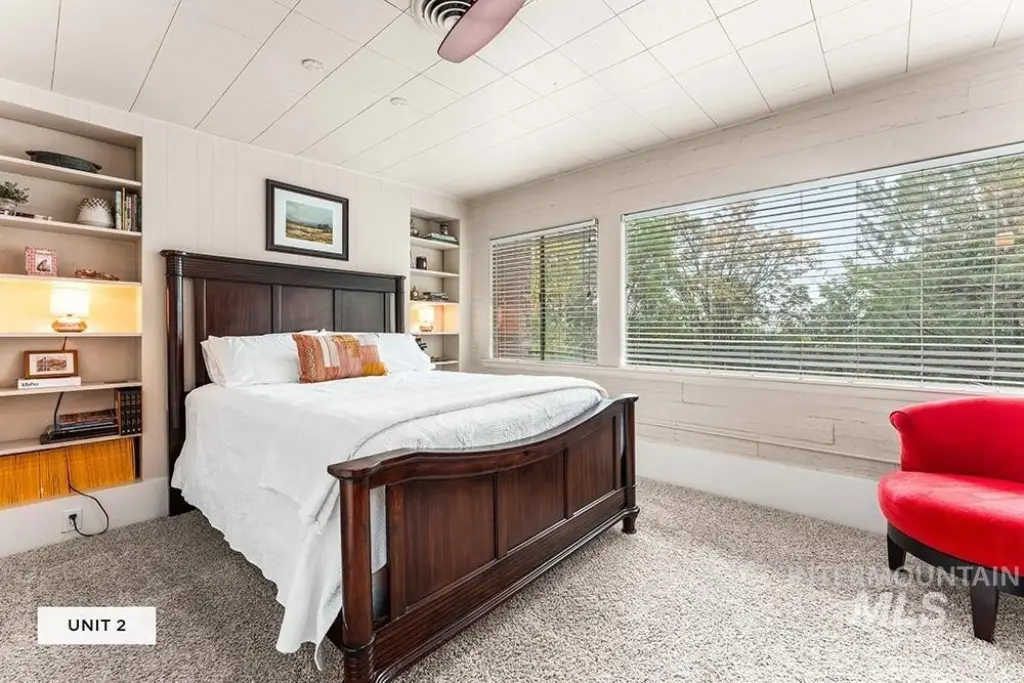
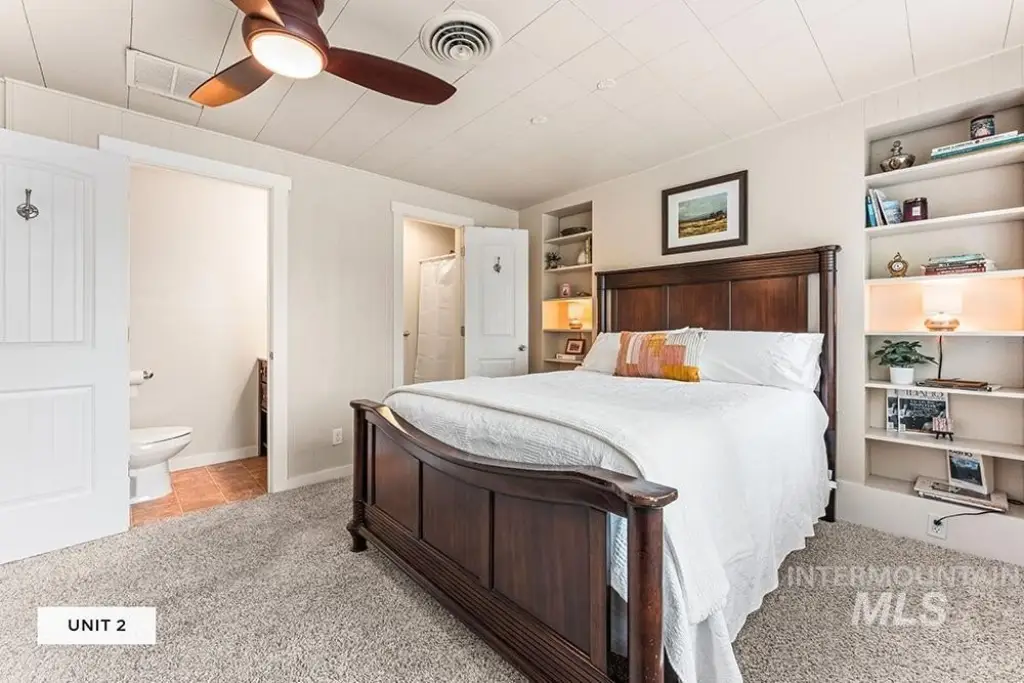
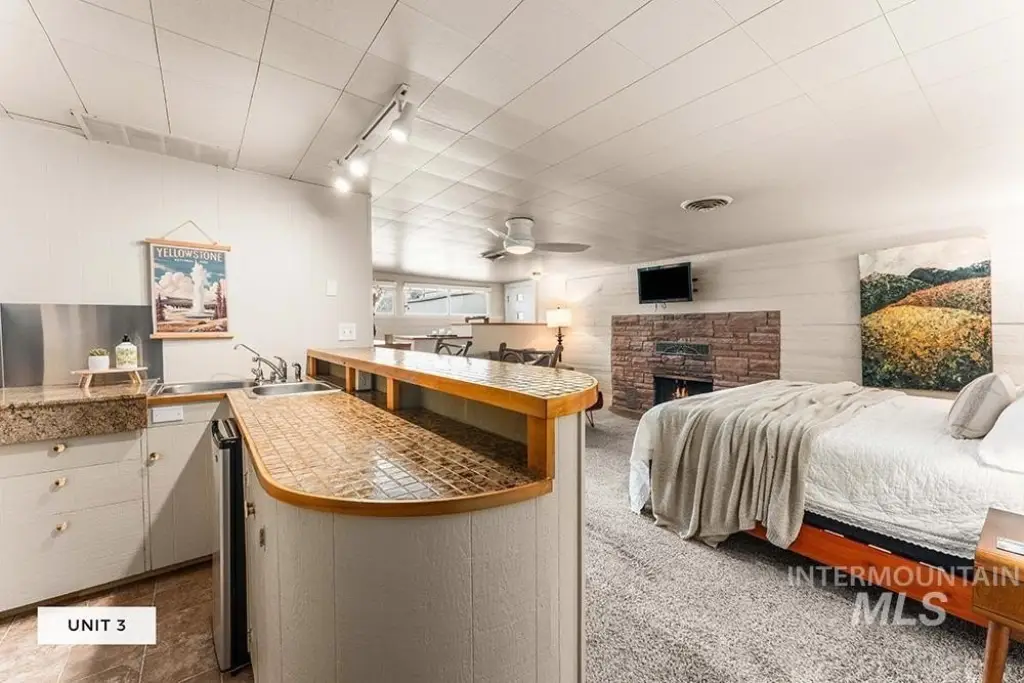
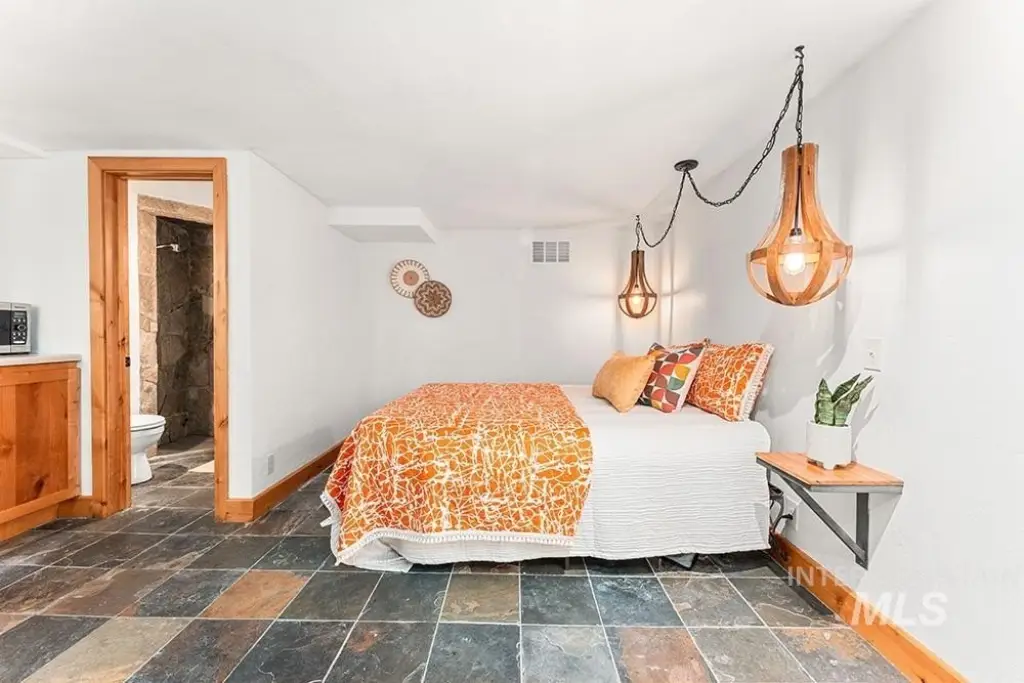
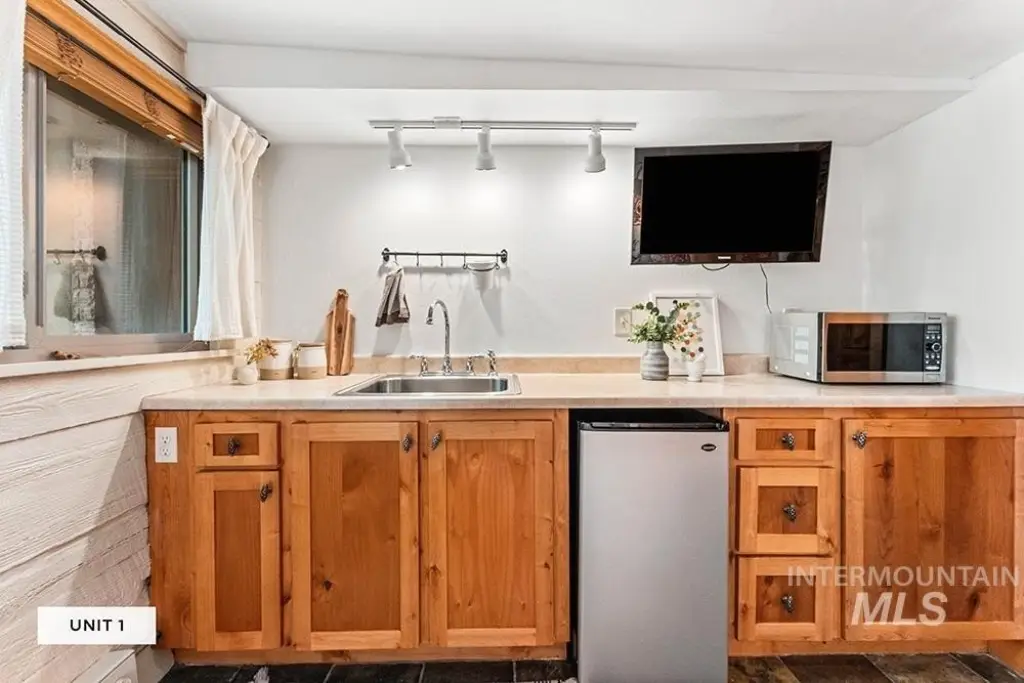
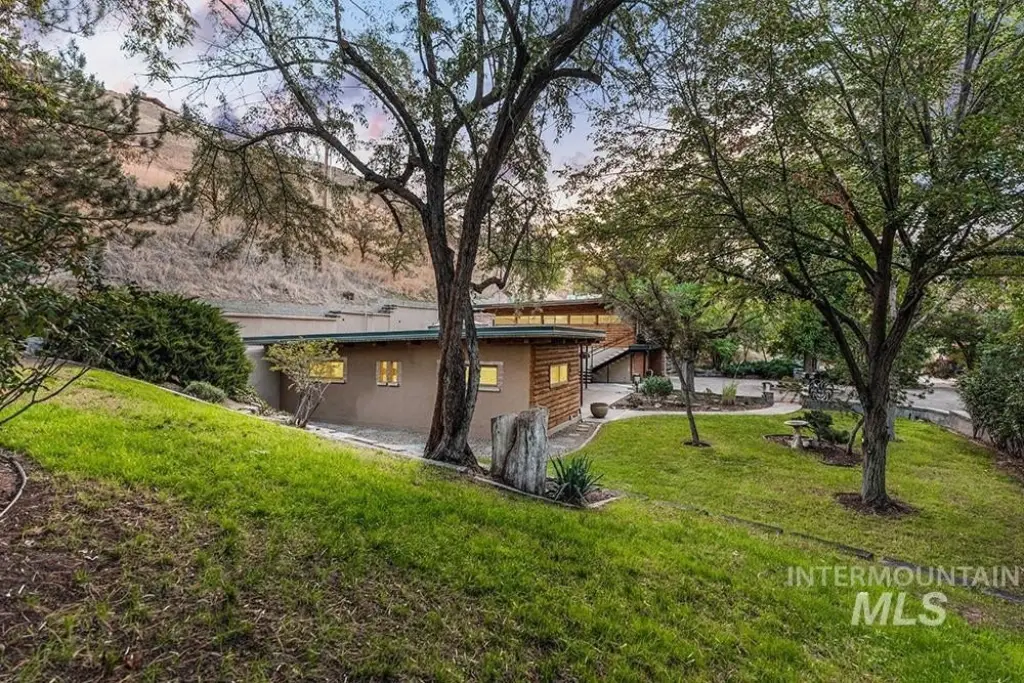
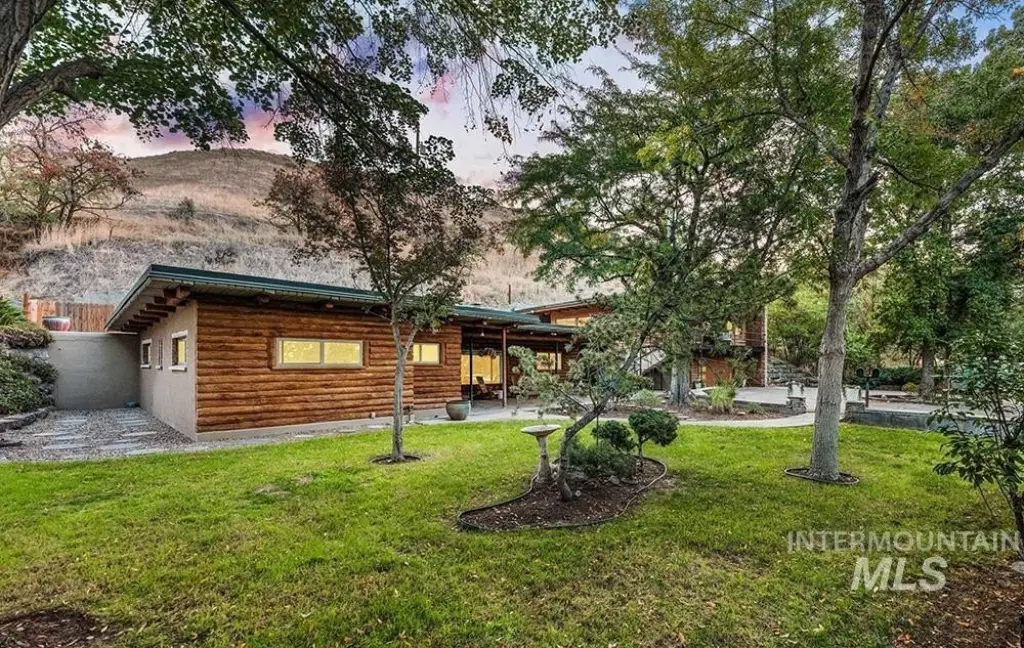
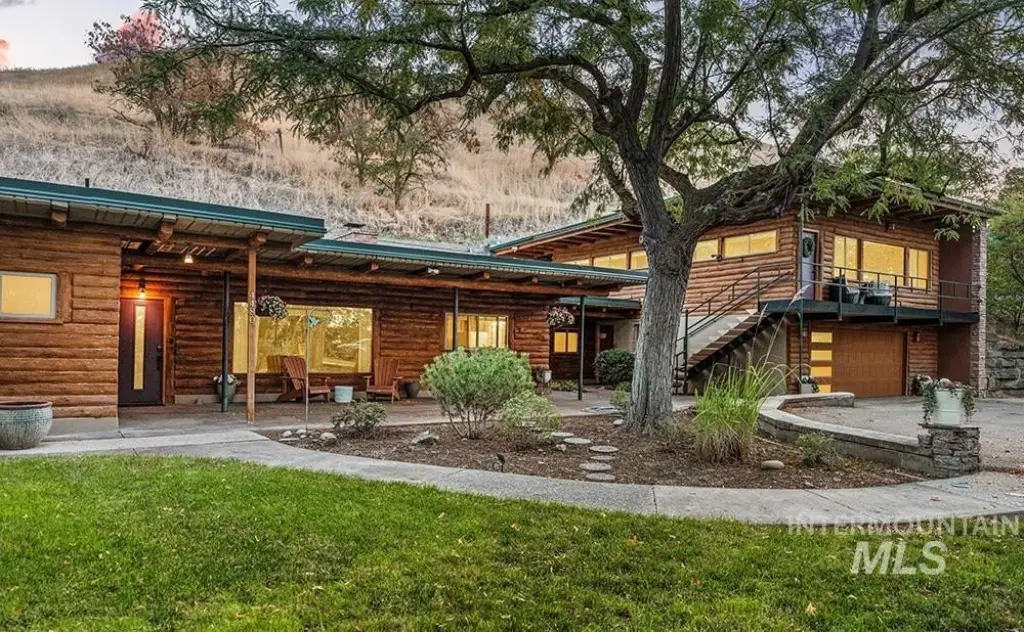
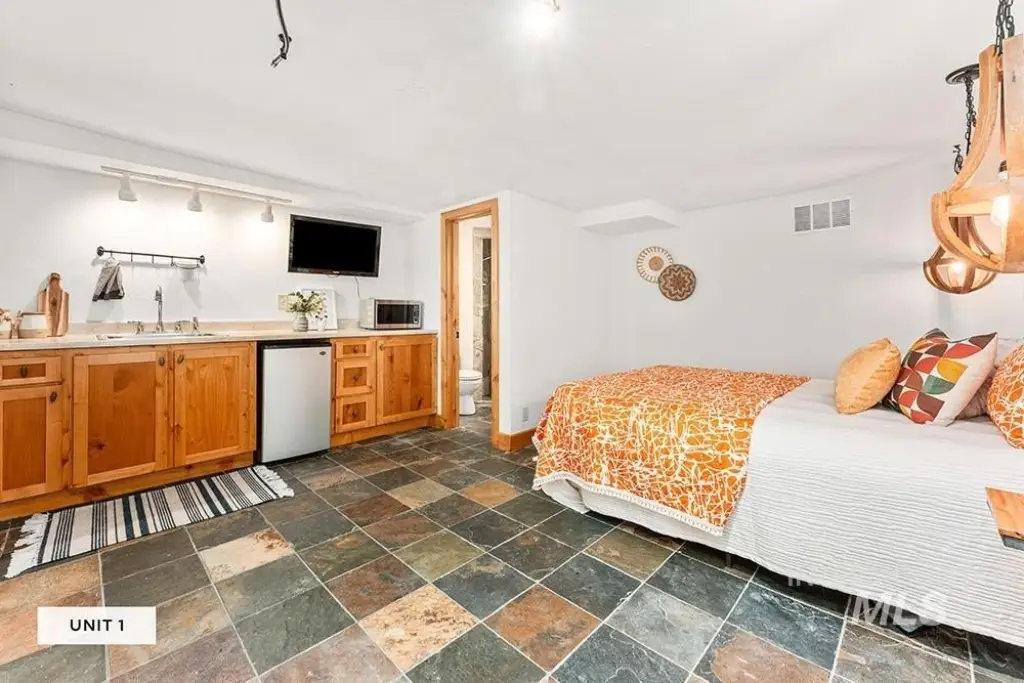
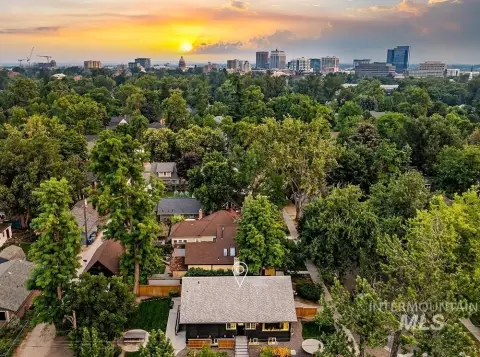
This 4-unit residential income property occupies 2,729 square feet on 0.51 acres and dates to 1954. Its mid-century design includes flat rooflines, stone fireplaces, log-beamed ceilings, notable windows, and log construction. The layout includes a 2-bedroom main-level unit, a studio, and an upper-level 2-bedroom, 2-bath unit with a private lock-off that can be configured as two units. The property also includes RV parking.
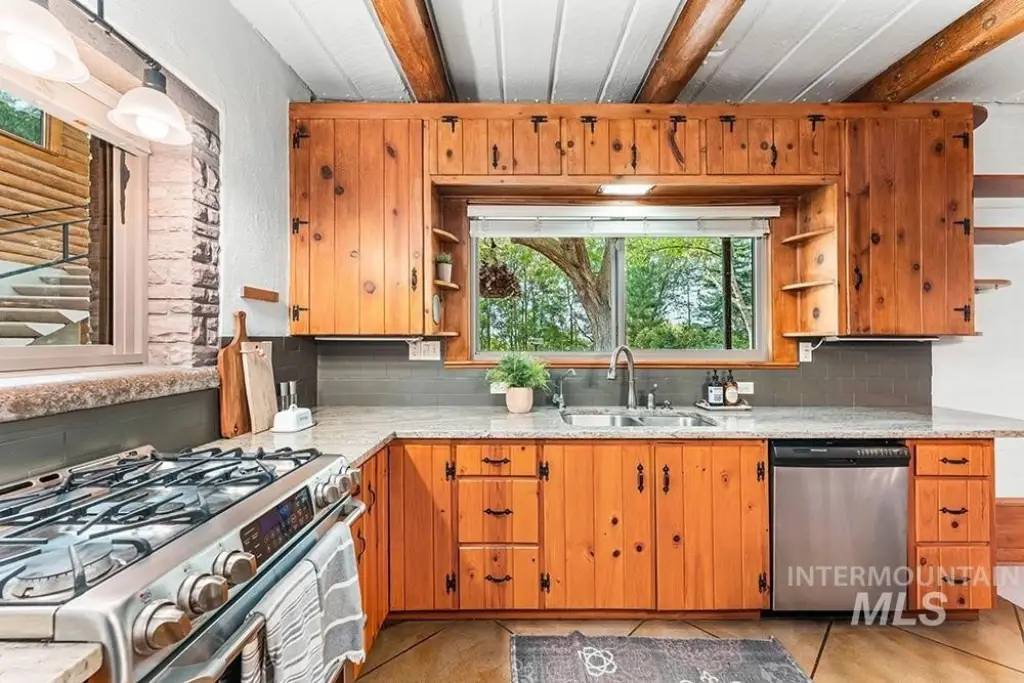
Renovations completed in 2011 addressed the roof, windows, plumbing, electrical, radiant flooring, and kitchen. Heating features include hot water, forced air, baseboard, radiant systems, and fireplaces, while cooling is provided by wall or window units. A connection to City Water is scheduled for 2026.
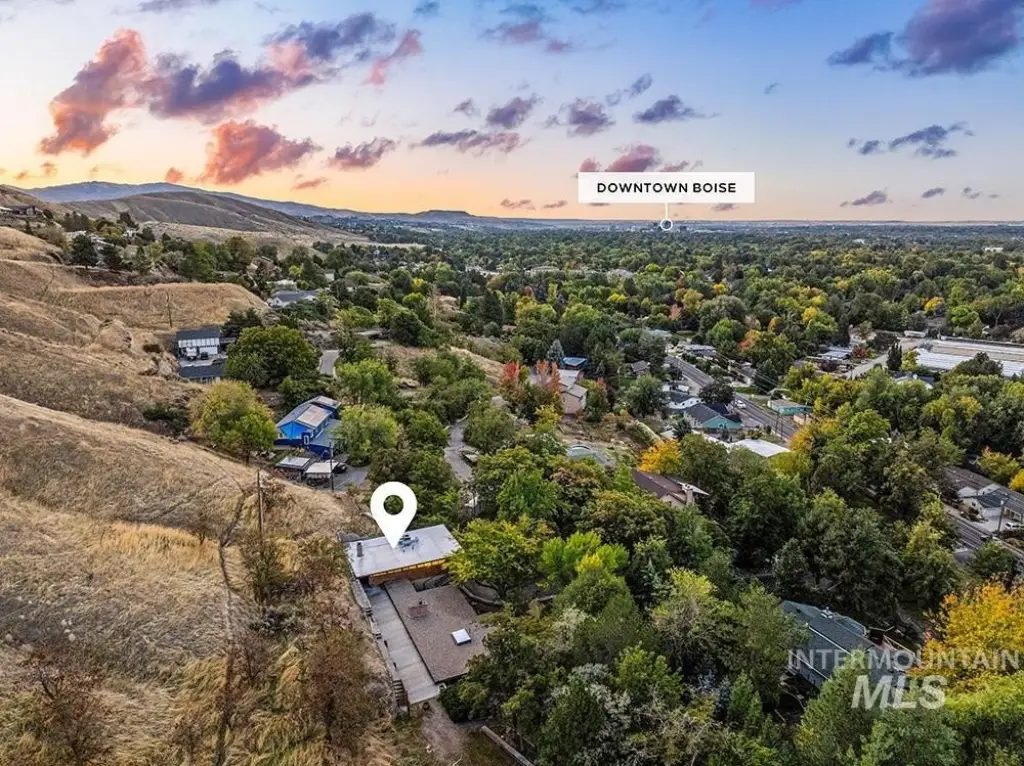
Located at 4480 N Kitsap Way in Boise, the property is described as minutes from downtown Boise, Hyde Park, and the North End. The existing configuration supports continued short-term rental use or an owner-occupant arrangement with additional units available for rent, as stated in the property information.
Renovations completed in 2011 addressed the roof, windows, plumbing, electrical, radiant flooring, and kitchen. Heating features include hot water, forced air, baseboard, radiant systems, and fireplaces, while cooling is provided by wall or window units. A connection to City Water is scheduled for 2026.
Located at 4480 N Kitsap Way in Boise, the property is described as minutes from downtown Boise, Hyde Park, and the North End. The existing configuration supports continued short-term rental use or an owner-occupant arrangement with additional units available for rent, as stated in the property information.
Key Highlights
- Four‑unit configuration with a 2‑bedroom main‑level unit, studio, and upper 2‑bedroom, 2‑bath unit
- 2,729 square feet on 0.51 acres at 4480 N Kitsap Way, Boise, ID 83703
- 1954 construction with mid‑century design, log construction, stone fireplaces, and log‑beamed ceilings
Financial Insights
Estimated NOI and Cap Rate
NOI / Yr
$32,894
Cap Rate
3.66%
Suggested Prices Based on Cap Rates
Cap Rate 5%
$657,880
$657.9K
Cap Rate 7%
$469,914
$469.9K
Cap Rate 9%
$365,489
$365.5K
Market Conditions
NOI Build-Up for 2,729 SF
Gross rent
$47.5K $17.40/SF
− Vacancy
−$494 −$0.18/SF
EGI
$47.0K $17.22/SF
− OpEx
−$14.1K −$5.17/SF
NOI
$32.9K $12.05/SF
Area
Ada County, ID
Vacancy
1.04%
Lease Rate
$17.40 /SF/Yr
Expense Ratio
30.00%
Simulate Cap Rate and NOI
Suggested Prices Based on Cap Rates
Cap Rate 5%
$657,880
Cap Rate 7%
$469,914
Cap Rate 9%
$365,489
Alternative Uses
Best Use
Multifamily LT 5
$469.9K
$411.2K – $548.2K
NOI $32,894 @ 7.0% cap · market cap 3.66%
Second Best
Apartment 5plus
$409.7K
$358.5K – $478.0K
NOI $28,682 @ 7.0% cap · market cap 3.19%
Theoretical Best
Office A
$753.7K
$659.5K – $879.3K
NOI $52,757 @ 7.0% cap · market cap 5.86%
Zoning and permitted uses should be independently verified with authorities.
Property Analytics
Unlock full access to Insights
Subscribe to Realmo Intelligence
Open Analytics
Current Use
Lease Details
4
Residential units
Location Intelligence
Trade Area within ½ mile
183
Businesses Nearby
Explore this area
Business Placement
Demographics for 83703, ID
18,163
Population
7,971
Households
2.3
Avg Household Size
40
Median Age
54%
College-Educated
97%
High-School Grad
8.1 sq mi
ZIP Area
2,242
Density / Sq Mi
$74,415
Median Household Income
$41,938
Median Earnings
$1,336
Median Rent
$477,000
Median Home Value
Check the figures for this property
Cap Rate, Value Estimation, Potential NOI and more
View Realmo Analytics
Market
Vacancy Rate% for Multifamily in West region

Questions? Ask Rey
Realmo’s AI knows this listing — price, zoning, demand, history. Ask anything.




Frequently Asked Questions
What type of property is this?
Quadplex - Distinctive mid-century property with flexible unit configurations, updated systems, and proximity to downtown Boise.
Where is this quadplex located?
The property is located at 4480 N Kitsap Way Boise, ID.
What is the asking price?
The asking price for this property is $899,900.
What are key features of this property?
This property features: Four‑unit configuration with a 2‑bedroom main‑level unit, studio, and upper 2‑bedroom, 2‑bath unit; 2,729 square feet on 0.51 acres at 4480 N Kitsap Way, Boise, ID 83703; 1954 construction with mid‑century design, log construction, stone fireplaces, and log‑beamed ceilings



