Mixed-Use Property Near Texas
For Sale
Contact for pricing
2700-2908 Finfeather Road, Bryan, TX 77803
Fully leased mixed-use property with redevelopment potential near Texas A&M.
Property Size59,362 SF
Price / SF$102
Days on Market154
Property Features for 2700-2908 Finfeather Road
General Information
Standard status
Active
Size
59,362 SF
Property subtype
Retail, Office, Industrial
Zoning
C-3
Occupancy
100%
Investment Type
Institutional
Net Operating Income
$317,909
Listing Agency:
Conlee Real Estate
Listed By:
Craig Conlee · License #00572256
Source:
Crexi
Added: May 13
Changed: Oct 9
Last Checked: Oct 12 at 9:17PM
Displayed information is deemed reliable but is not guaranteed and should be independently verified. All listing content including descriptions, pricing, images are the copyrighted material of Conlee Real Estate
Investment Insights
Based on property information with market context.
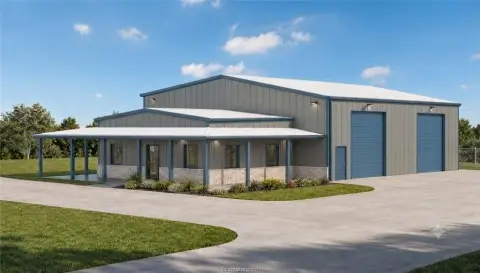
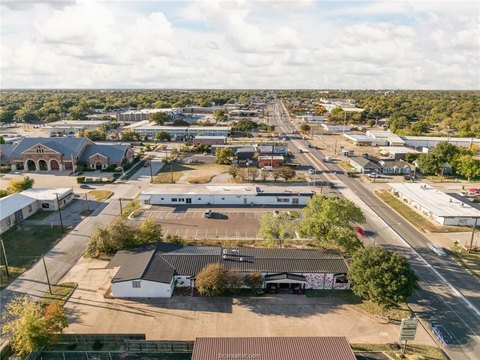
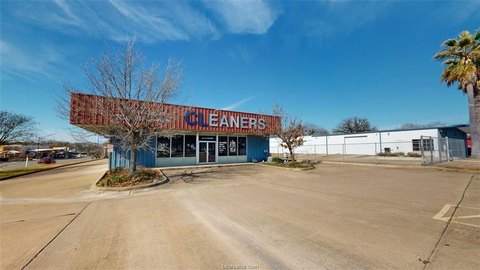
This mixed-use property is situated midway between Texas A&M University, the RELLIS Campus, and Historic Downtown Bryan, providing access to traffic flowing between the cities and the campus. The property encompasses over 35 rental units, totaling 55,000 square feet, and is currently 100% leased. It can be sold in 4 separate parcels or as one transaction. The property features a mix of small (1250 square feet) office/warehouse units, each with overhead doors that open to a back alley, as well as larger spaces, including one occupied by Cen-Tex Countertops for custom milling of marble and granite. The location is centrally located between Bryan and College Station, offering easy access to Texas A&M University, Historic Downtown Bryan, RELLIS Campus, the Bio Tech Corridor next to Traditions, and Easterwood Regional Airport. The new Midtown Park, featuring Top Golf, Legends Event Facilities, outdoor baseball fields, and a planned movie/gaming/indoor activity park, is located across the street. This property, situated on a 59,362 square foot lot, could be suitable for a hotel or conference center in the future.
Key Highlights
- 100% leased with over 35 rental units covering 55,000 SF
- Located midway between Texas A&M University, RELLIS Campus, and Historic Downtown Bryan
- Potential for future Hotel/Conference Center development due to proximity to Midtown Park
Financial Insights
Estimated NOI and Cap Rate
NOI / Yr
$432,322
Cap Rate
7.14%
Suggested Prices Based on Cap Rates
Cap Rate 5%
$8,646,440
$8.6M
Cap Rate 7%
$6,176,029
$6.2M
Cap Rate 9%
$4,803,578
$4.8M
Market Conditions
NOI Build-Up for 59,362 SF
Gross rent
$534.3K $9.00/SF
− Vacancy
−$25.6K −$0.43/SF
EGI
$508.6K $8.57/SF
− OpEx
−$76.3K −$1.29/SF
NOI
$432.3K $7.28/SF
Area
Brazos County, TX
Vacancy
4.80%
Lease Rate
$9.00 /SF/Yr
Expense Ratio
15.00%
Simulate Cap Rate and NOI
Suggested Prices Based on Cap Rates
Cap Rate 5%
$8,646,440
Cap Rate 7%
$6,176,029
Cap Rate 9%
$4,803,578
Alternative Uses
Best Use
Office B
$11.15M
$9.76M – $13.01M
NOI $780,685 @ 7.0% cap · market cap 12.89%
Second Best
Mixed Use
$9.26M
$8.10M – $10.80M
NOI $648,233 @ 7.0% cap · market cap 10.71%
Theoretical Best
Office A
$14.62M
$12.79M – $17.05M
NOI $1,023,211 @ 7.0% cap · market cap 16.90%
Zoning and permitted uses should be independently verified with authorities.
How Realmo checks its estimates
Property Analytics
Unlock full access to Insights
Subscribe to Realmo Intelligence
Open Analytics
Current Use
Location Intelligence
Trade Area within ½ mile
307
Businesses Nearby
Explore this area
Business Placement
Demographics for 77803, TX
30,533
Population
10,586
Households
2.9
Avg Household Size
32
Median Age
11%
College-Educated
72%
High-School Grad
13.6 sq mi
ZIP Area
2,245
Density / Sq Mi
$50,953
Median Household Income
$28,651
Median Earnings
$1,106
Median Rent
$141,000
Median Home Value
Check the figures for this property
Cap Rate, Value Estimation, Potential NOI and more
View Realmo Analytics
Market
Vacancy Rate% for Office in South region

Questions? Ask Rey
Realmo’s AI knows this listing — price, zoning, demand, history. Ask anything.





Frequently Asked Questions
What type of property is this?
Mixed-use property - Fully leased mixed-use property with redevelopment potential near Texas A&M.
Where is this mixed-use property located?
The property is located at 2700-2908 Finfeather Road Bryan, TX.
What is the asking price?
The asking price for this property is $6,054,924.
What are key features of this property?
This property features: 100% leased with over 35 rental units covering 55,000 SF; Located midway between Texas A&M University, RELLIS Campus, and Historic Downtown Bryan; Potential for future Hotel/Conference Center development due to proximity to Midtown Park


