Vacancy and Credit Loss in Underwriting

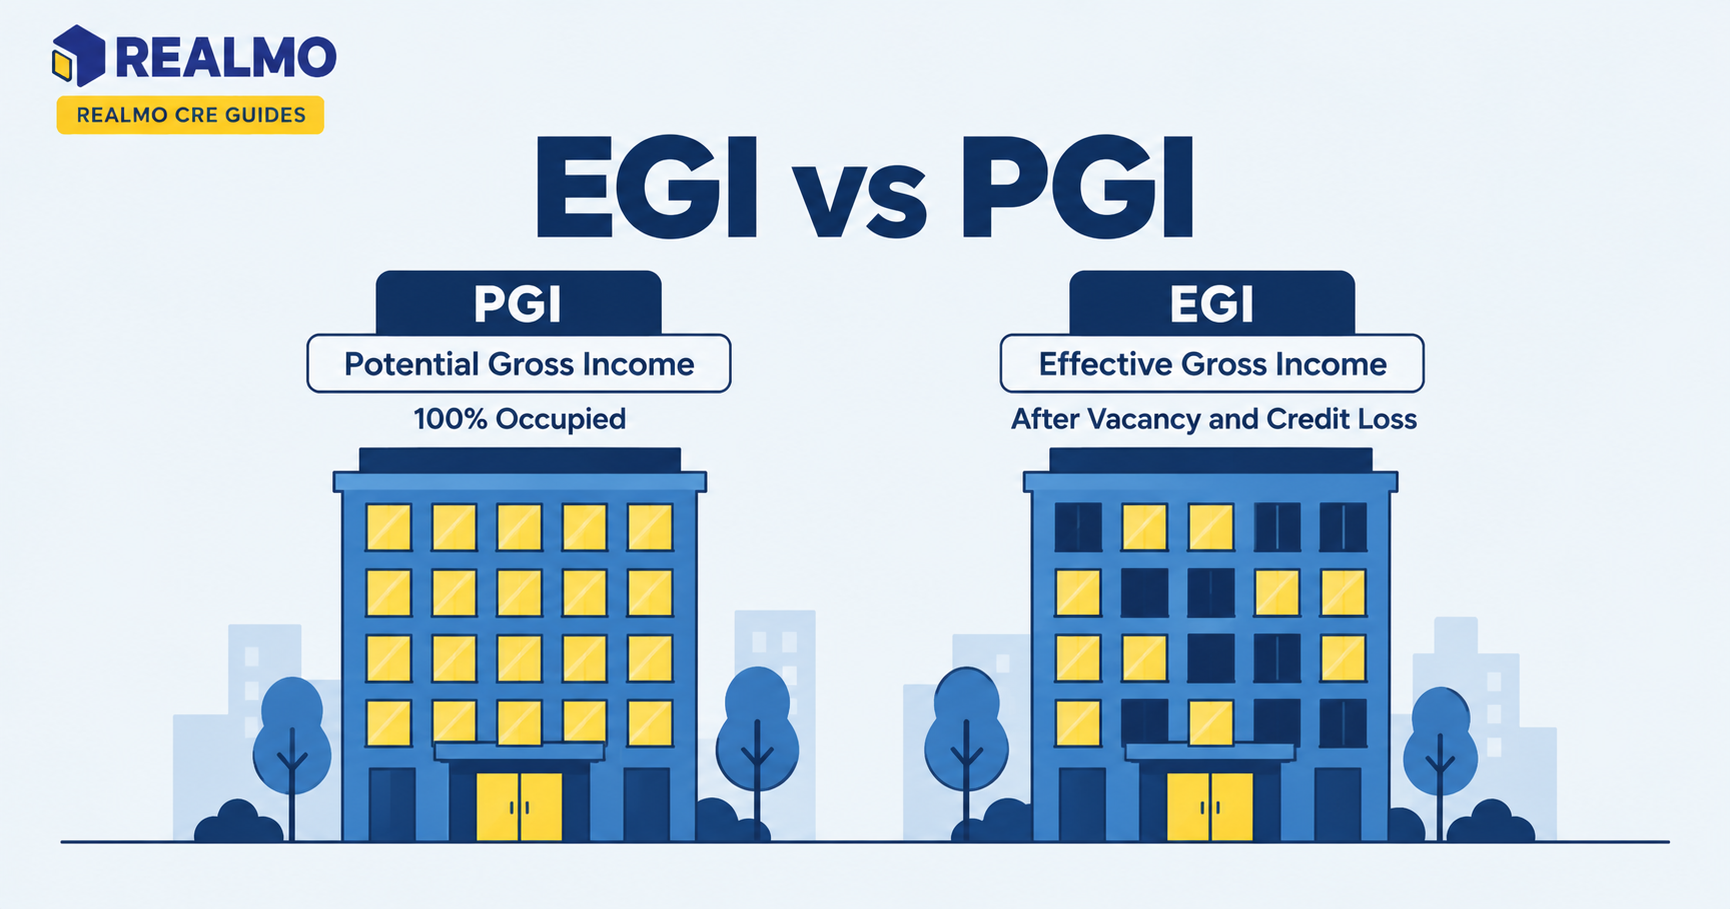
Vacancy and credit loss is the deduction an underwriter takes from a property’s potential gross income to account for space that sits empty and for rent that is billed but never collected. Subtracting it produces effective gross income, the top line that drives net operating income, loan proceeds, and value.
Why this one line decides your basis
An investor tours a five-tenant retail strip that is fully leased and collecting on time. The broker’s setup shows a 3% vacancy factor because that is what the property has run for the past two years. The problem is the lease expiration schedule: two tenants covering 40% of the building roll within eighteen months, and neither has renewal options. Underwriting 3% assumes those tenants stay and that no suite ever sits dark between leases.
Push the assumption to a level that reflects rollover and the deal changes character. Net operating income falls, the direct capitalization value falls with it, and the lender’s proceeds fall. This is because debt service coverage is calculated on the underwritten number rather than the trailing one. The gap between a seller’s vacancy factor and a defensible one is the entire negotiating spread on price.
What the vacancy and credit loss line measures
Underwriting starts with potential gross income: every square foot leased at its contract or market rent, plus expense reimbursements, plus other income such as parking, storage, or antenna rent. That figure assumes perfect physical occupancy and perfect collections, which no property delivers.
The vacancy and credit loss deduction reconciles that assumption to reality. It is usually expressed as a percentage of potential gross income and shown as a single combined line, though sophisticated models split it. What remains is effective gross income, from which operating expenses are subtracted to reach net operating income.
Because the deduction sits at the top of the stack, an error there flows straight through to value at the reciprocal of the cap rate. A dollar of overstated income is roughly fourteen dollars of overstated value at a 7% cap.
Vacancy loss and credit loss are not the same
Vacancy loss covers space that generates no rent: suites currently dark, downtime between a tenant leaving and a replacement paying, and free rent granted as a concession. That last item is why practitioners separate physical vacancy from economic vacancy. A building can be 100% physically leased while a full floor sits in an abatement period contributing nothing.
Credit loss, sometimes called collection loss, covers rent that a paying tenant owes but does not pay. It shows up as bad debt write-offs, partial payments during a workout, or a balance abandoned when a tenant skips. Credit loss tracks tenant quality rather than market conditions, which is why a fully occupied property with weak local operators can carry a meaningful collection deduction while a single-tenant building leased to an investment-grade credit carries almost none.
Keeping the two separate matters because they respond to different fixes. Vacancy improves with leasing and capital; credit loss improves only with a different tenant.
Where the vacancy assumption comes from
Four inputs usually set it. The property’s own operating history, adjusted for anything nonrecurring. The submarket’s occupancy history for buildings of the same class and size, not the metro average, which blends product types that do not compete. The rent roll’s rollover profile, since a year with heavy expirations should carry more downtime than a year with none. And the tenant credit mix, which drives the collection portion.
Underwriters then apply judgment about stabilization. Buying a property at 80% occupancy does not mean underwriting 20% vacancy forever. It means modeling an absorption period and a stabilized level thereafter, with the lease-up cost carried separately as tenant improvements and leasing commissions. Reviewing nearby comparable listings and ownership records helps you see how long similar suites have actually taken. To lease rather than how long a broker says they should take.
Worked example: a five-tenant retail strip
Illustrative figures, rounded for clarity.
| Line | Amount |
|---|---|
| Base rent (20,000 SF at $20/SF) | $400,000 |
| Expense reimbursements | $80,000 |
| Potential gross income | $480,000 |
| Vacancy at 7% | ($33,600) |
| Credit loss at 1% | ($4,800) |
| Effective gross income | $441,600 |
| Operating expenses | ($120,000) |
| Net operating income | $321,600 |
Now stress the assumption. Raise the combined deduction from 8% to 12% to reflect the two expiring leases and the downtime a replacement search would require. The deduction becomes $57,600, effective gross income falls to $422,400, and net operating income falls to $302,400. At an illustrative 7% capitalization rate, that four-point change moves value roughly $274,000 on a property worth about $4.6 million.
Interpretation: each point of vacancy on this deal is worth roughly $69,000 of value. That is the number to hold in your head during price negotiation, because it converts a modeling argument into dollars.
The frequent error in this build is applying the deduction to base rent only. A vacant suite stops paying its share of taxes, insurance, and common area maintenance as well, so 8% of the $80,000 reimbursement line, about $6,400 of income, disappears from the model if you skip it.
How lenders and appraisers treat the same line
Lenders rarely accept a seller’s factor. Loan underwriting commonly applies the greater of actual vacancy, submarket vacancy, or an internal minimum floor, and applies that floor even to a fully leased single-tenant building on the theory that no lease is permanent. That is why a deal can pencil at the purchase price and still come back undersized on proceeds after the lender’s own debt service coverage ratio test.
Appraisers work the same line for the income approach, and their conclusion becomes the number of record in the loan file. Where a market has thin comparable data, expect the appraiser to lean on general market surveys. This can differ from what a local leasing broker sees on the ground.
Mistakes that quietly inflate underwritten NOI
- Treating current occupancy as stabilized occupancy. A property leased today at full occupancy still faces rollover. Skipping downtime in expiration years produces a value that no lender or exit buyer will confirm.
- Applying the deduction to base rent only. Recoveries and other income vanish with the tenant. Omitting them overstates effective gross income by the reimbursement share of the vacant space.
- Double-counting the same empty suite. Taking a blanket percentage and also modeling explicit downtime for a specific vacancy deducts the loss twice. This understates value and can cost you a deal you should have won.
- Borrowing the submarket average for a building that does not compete in it. An older asset with small suites and no parking will not hold the occupancy of new construction two blocks away.
- Recording free rent as an expense. Concessions are economic vacancy. Classifying them below the line inflates collected rent and makes the property look stronger than comparable assets underwritten correctly.
Related terms: Effective gross income · Potential gross income · Economic vs. physical occupancy · Lease rollover risk · Tenant credit analysis · Pro forma vs. trailing twelve
FAQ
Is vacancy and credit loss one line or two?
Either. Many models combine them into a single percentage of potential gross income, and lenders quote it that way. Splitting them is more informative, because vacancy responds to leasing and market conditions while credit loss reflects tenant quality. Separate lines make it clear which problem a business plan is actually solving.
What is the difference between physical and economic vacancy?
Physical vacancy measures empty square footage. Economic vacancy measures uncollected income, so it also captures free rent, concessions, tenants paying below contract rent, and delinquent accounts. Economic vacancy is usually the higher figure, and it is the one that actually affects net operating income.
How much does one point of vacancy affect value?
Divide one percent of potential gross income by the capitalization rate. On a property with $480,000 of potential gross income at a 7% cap, one point equals $4,800 of income. And roughly $69,000 of value. The multiplier grows as cap rates compress.