Levered vs Unlevered IRR: What the Difference Tells You About a Deal
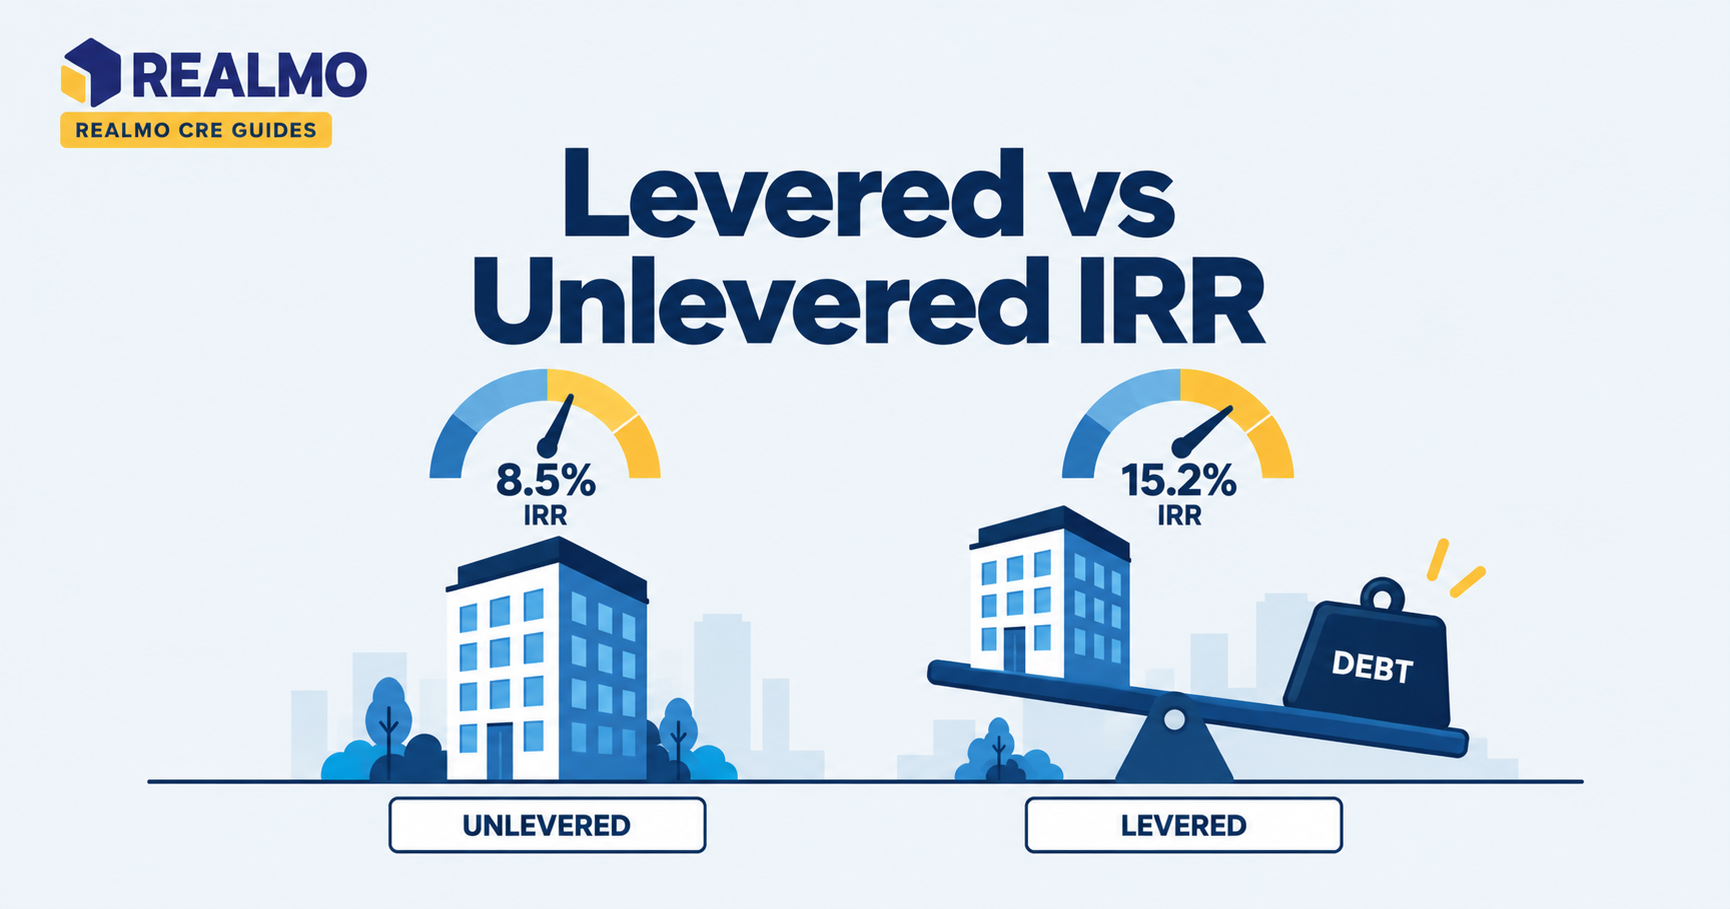
Levered vs unlevered IRR is the comparison between a property’s return with debt in the cash flow and its return without it. Unlevered IRR measures the asset’s own performance. Levered IRR measures what the equity earns after debt service, loan proceeds, and payoff run through the model.
Why the two IRRs answer different questions
An investor reviewing a value-add retail strip receives an offering memorandum quoting a 19% IRR. That number is levered, built on 70% loan-to-cost financing at an assumed rate. Strip the debt out and the same deal might return 11%. Neither figure is wrong, and neither is sufficient alone.
The unlevered number tells the investor whether the real estate works: whether the rent roll, the lease-up plan, and the exit assumption produce enough cash to justify the price. The levered number tells the investor what the equity check earns given a specific loan. If the sponsor’s rate assumption misses by 150 basis points, or the lender sizes the loan on a debt yield test rather than the sponsor’s LTV target, the levered return moves substantially while the unlevered return does not move at all. Investors who screen deals on levered IRR alone end up comparing financing packages when they think they are comparing buildings.
How unlevered IRR is built
Unlevered IRR discounts the property’s cash flows before any debt. The cash flow line starts with net operating income, subtracts capital expenditures, tenant improvements, and leasing commissions, and ends with net sale proceeds at exit. Purchase price and closing costs sit in year zero as the full outflow. No interest, no principal, no loan proceeds, no financing fees.
Because the entire purchase price is treated as equity, unlevered IRR is sometimes called the property-level or asset-level return. It answers a clean question: what does this real estate yield to a buyer who pays all cash? That makes it the right metric for comparing two assets in different markets, or for testing whether a business plan creates value independent of the capital markets. It also travels well through time. A model built five years ago with the same rent and capital assumptions produces the same unlevered IRR today, while its levered IRR would be unrecognizable.
How levered IRR is built
Levered IRR runs the same property cash flows and then layers financing on top. Year zero shrinks to the equity contribution: purchase price plus closing costs and financing fees, minus loan proceeds. Interim years subtract debt service. The exit year subtracts the outstanding loan balance, including any prepayment penalty or defeasance cost, from gross sale proceeds.
The result is a return on a much smaller denominator. That is the entire point of leverage, and also the source of its risk. When the property’s unlevered return exceeds the cost of debt, leverage lifts equity returns , positive leverage. When the borrowing cost exceeds the property’s return, leverage drags equity down , negative leverage. The relationship is not linear and it is not stable across the hold, since interest-only periods, amortization schedules, and floating-rate exposure all change the shape of the equity cash flow without touching the asset.
Worked example: the same building, two returns
All figures below are illustrative and rounded for clarity.
An investor buys an industrial building for $10,000,000 with $200,000 in closing costs. NOI runs $700,000 in year one and grows to $800,000 by year five after modest rent bumps. Capital spending is nominal. The building sells at the end of year five for $12,000,000 net of costs.
Unlevered cash flows: Year 0: −$10,200,000. Years 1 through 4: $700,000, $725,000, $750,000, $775,000. Year 5: $800,000 operating plus $12,000,000 net sale = $12,800,000. The IRR on that stream is roughly 10.5%.
Levered cash flows: The investor borrows $6,500,000 at 6% interest-only, paying $50,000 in loan fees. Annual debt service is $390,000. Year 0 equity is $10,200,000 + $50,000 − $6,500,000 = −$3,750,000. Years 1 through 4: $310,000, $335,000, $360,000, $385,000. Year 5: $800,000 − $390,000 + $12,000,000 − $6,500,000 = $5,910,000. The IRR on that stream is roughly 16%.
How to read it: The asset returns about 10.5%; debt costs 6%. The spread is positive, so leverage amplifies the equity return by roughly five and a half points. Run the same model at a 12% borrowing cost and the levered IRR falls below the unlevered figure , the deal still works as real estate, but the capital stack destroys equity value.
The common error: Investors compare a levered IRR to an unlevered target return, or benchmark a levered deal against an unlevered index. Comparing across the two is meaningless. Fix the debt assumption first, then compare like to like.
What leverage does to risk, not just return
A higher levered IRR is not a better deal; it is a different deal. Debt service is a fixed obligation against variable income, so leverage widens the distribution of outcomes in both directions. A 10% shortfall in NOI reduces unlevered return modestly. The same shortfall against a heavy debt load can eliminate distributable cash entirely, trip a debt service coverage ratio covenant, or force a capital call.
Timing risk compounds this. Loans mature on a fixed date; business plans do not. A deal that needs eighteen more months to stabilize but faces a maturity in six can be forced into a refinancing or sale at the worst possible moment. That risk lives entirely in the levered return and is invisible in the unlevered one.
When to use each metric
Use unlevered IRR to underwrite the asset, compare opportunities across markets and property types, evaluate a business plan on its merits, and set an internal hurdle that financing cannot manufacture. Use levered IRR to size an equity check, evaluate a specific loan package, test the deal against a partnership waterfall, and stress the outcome under different rate and structure assumptions.
Institutional underwriting requires both, along with equity multiple and cash-on-cash return. This is because IRR alone rewards speed and says nothing about the size of the profit. A one-year flip and a ten-year hold can produce identical IRRs on very different dollar outcomes.
Common mistakes
- Benchmarking levered IRR against unlevered comps. The comparison flatters a leveraged deal and hides whether the underlying real estate is competitive. Investors overpay on this basis routinely.
- Treating the debt assumption as fixed. Sponsors model financing they have not yet secured. If the loan sizes smaller or prices higher at closing, the marketed levered IRR was never available. Ask what the return looks like at a lower proceeds level.
- Ignoring exit debt costs. Prepayment penalties, defeasance (collateral substitution), and yield maintenance (a make-whole penalty) can consume a meaningful share of equity proceeds. Models that subtract only the loan balance overstate levered returns.
- Reading a large gap as a strong deal. A wide spread between levered and unlevered IRR reflects leverage volume, not asset quality. It should prompt questions about downside, not confidence.
- Confusing project-level and LP-level returns. After promote and fees, the limited partner’s IRR sits below the levered project IRR. Confirm which layer of the waterfall a quoted number describes.
- Investors screening acquisitions can pull ownership records, valuation estimates, and cap rate context on Realmo before building either model. This shortens the gap between a listing and a defensible set of underwriting inputs.
Related terms: Internal Rate of Return (IRR), Cash-on-Cash Return, Equity Multiple, Debt Service Coverage Ratio, Loan-to-Value Ratio, Net Operating Income, Positive and Negative Leverage, Equity Waterfall
FAQs
Is levered or unlevered IRR higher?
Levered IRR is higher whenever the property’s unlevered return exceeds the all-in cost of debt, a condition called positive leverage. When borrowing costs rise above the asset’s return, the relationship inverts and levered IRR falls below unlevered IRR.
Which IRR do sponsors quote in an offering memorandum?
Almost always levered, and at the project level rather than the LP level. Confirm which one you are reading, and ask for the unlevered figure alongside it to judge the real estate separately from the financing.
Does unlevered IRR include capital expenditures?
Yes. Unlevered cash flow subtracts capital expenditures, tenant improvements, and leasing commissions from NOI. It excludes only financing items: loan proceeds, interest, principal, financing fees, and payoff costs.
Can a deal have a good unlevered IRR and a bad levered IRR?
Yes. Expensive debt, a short maturity that forces an early exit, or heavy prepayment costs can turn a sound asset into a poor equity outcome. This is the main reason to run both.
What is a good levered IRR for commercial real estate?
There is no fixed threshold. Required returns vary by property type, risk profile, hold period, and prevailing capital costs. Core stabilized assets carry lower targets than ground-up development, and any benchmark must be set against current alternatives rather than a static number.