Fully Improved Office Building with
For Sale
Contact for pricing
9150 Galleria Court, Naples, FL 34109
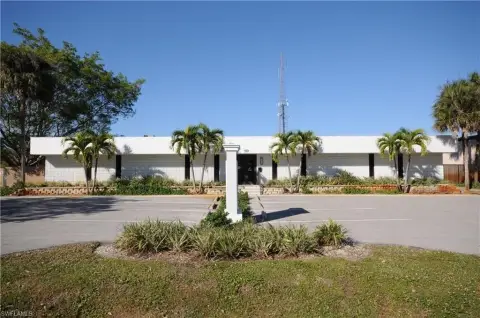
Partially vacant, fully improved office building with immediate occupancy opportunity within The Plaza at the Galleria.
Property Size10,352 SF
Price / SF$410.55
Days on Market127
Property Features for 9150 Galleria Court
General Information
Standard status
Active
Size
10,352 SF
Total Parking Spaces
2
Property subtype
Office
Zoning
PUD
Lease Type
NNN
Investment Type
Owner/User
Building Details
Year Built
2000
Tenancy
Multi
Listing Agency:
Investment Properties Corporation of Naples
Listed By:
Clint Sherwood · License #FL 3033224
Source:
Crexi
Added: Jun 8
Changed: Oct 5
Last Checked: Oct 11 at 5:33AM
Displayed information is deemed reliable but is not guaranteed and should be independently verified. All listing content including descriptions, pricing, images are the copyrighted material of Investment Properties Corporation of Naples
Investment Insights
Based on property information with market context.
This fully improved office building contains approximately 10,352± square feet. The first floor is fully leased, while Unit 201, totaling approximately 6,150± square feet, is currently vacant. The available unit provides an owner-user or investor the option to secure immediate occupancy within the existing building configuration.
Located off Vanderbilt Beach Road in The Plaza at the Galleria, the property is within walking distance to The Shoppes at Vanderbilt. The surrounding area includes medical, retail, and residential communities, supporting everyday convenience for both staff and clients.
For tenants and buyers evaluating space requirements inside an established office setting, the combination of a leased first floor and a vacant second-floor unit can simplify planning around timing and occupancy. Unit 201’s current availability may be especially relevant for an owner-user seeking to move in without waiting for space to turn. Please call for additional details on the available unit and the building’s leasing situation.
Located off Vanderbilt Beach Road in The Plaza at the Galleria, the property is within walking distance to The Shoppes at Vanderbilt. The surrounding area includes medical, retail, and residential communities, supporting everyday convenience for both staff and clients.
For tenants and buyers evaluating space requirements inside an established office setting, the combination of a leased first floor and a vacant second-floor unit can simplify planning around timing and occupancy. Unit 201’s current availability may be especially relevant for an owner-user seeking to move in without waiting for space to turn. Please call for additional details on the available unit and the building’s leasing situation.
Key Highlights
- 10,352± SF fully improved office building in The Plaza at the Galleria, built in 2000
- First floor is fully leased
- Unit 201 offers 6,150± SF and is currently vacant for immediate occupancy
Financial Insights
Estimated NOI and Cap Rate
NOI / Yr
$213,122
Cap Rate
5.01%
Suggested Prices Based on Cap Rates
Cap Rate 5%
$4,262,440
$4.3M
Cap Rate 7%
$3,044,600
$3.0M
Cap Rate 9%
$2,368,022
$2.4M
Market Conditions
NOI Build-Up for 10,352 SF
Gross rent
$310.6K $30.00/SF
− Vacancy
−$26.4K −$2.55/SF
EGI
$284.2K $27.45/SF
− OpEx
−$71.0K −$6.86/SF
NOI
$213.1K $20.59/SF
Area
Collier County, FL
Vacancy
8.50%
Lease Rate
$30.00 /SF/Yr
Expense Ratio
25.00%
Simulate Cap Rate and NOI
Suggested Prices Based on Cap Rates
Cap Rate 5%
$4,262,440
Cap Rate 7%
$3,044,600
Cap Rate 9%
$2,368,022
Alternative Uses
Best Use
Office B
$3.04M
$2.66M – $3.55M
NOI $213,122 @ 7.0% cap · market cap 5.01%
Second Best
—
—
no second resolved use
Theoretical Best
Office A
$4.15M
$3.64M – $4.85M
NOI $290,831 @ 7.0% cap · market cap 6.84%
Zoning and permitted uses should be independently verified with authorities.
How Realmo checks its estimates
Property Analytics
Unlock full access to Insights
Subscribe to Realmo Intelligence
Open Analytics
Current Use
Location Intelligence
Trade Area within ½ mile
1,397
Businesses Nearby
Explore this area
Business Placement
Demographics for 34109, FL
26,102
Population
16,027
Households
1.6
Avg Household Size
55
Median Age
50%
College-Educated
97%
High-School Grad
12.5 sq mi
ZIP Area
2,088
Density / Sq Mi
$91,073
Median Household Income
$57,422
Median Earnings
$1,873
Median Rent
$628,700
Median Home Value
Check the figures for this property
Cap Rate, Value Estimation, Potential NOI and more
View Realmo Analytics
Market
Vacancy Rate% for Office in South region

Questions? Ask Rey
Realmo’s AI knows this listing — price, zoning, demand, history. Ask anything.




Frequently Asked Questions
What type of property is this?
Office building - Partially vacant, fully improved office building with immediate occupancy opportunity within The Plaza at the Galleria.
Where is this office building located?
The property is located at 9150 Galleria Court Naples, FL.
What is the asking price?
The asking price for this property is $4,250,000.
What are key features of this property?
This property features: 10,352± SF fully improved office building in The Plaza at the Galleria, built in 2000; First floor is fully leased; Unit 201 offers 6,150± SF and is currently vacant for immediate occupancy


