Prime Commercial Land
12295 Pellicano Dr El Paso, TX 79936
For Sale
Contact for pricing
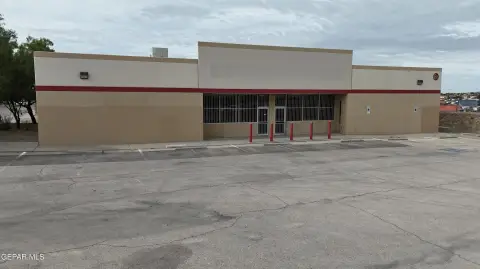
3.66-acre commercial land for development in El Paso, TX.
Lot Size3.66 Acres
Days on Market1485
Property Features for 12295 Pellicano Dr
General Information
- Standard status
- Active
- Lot size
- 3.66 Acres
- Property subtype
- Land
Listing Agency:
REP Commercial Real Estate
(915) 422-2242
Listed By:
Sergio Tinajero · License #TX 0486273
Source:
Crexi
Added: Jun 30, 2022
Changed: Jul 6
Last Checked: Jul 23 at 9:23AM
Displayed information is deemed reliable but is not guaranteed and should be independently verified. All listing content including descriptions, pricing, images are the copyrighted material of REP Commercial Real Estate
Investment Insights
Based on property information with market context.
This 3.66-acre commercial land development opportunity is located at 12295 PELLICANO DR, EL PASO, TX 79938. The property benefits from its location at the intersection of Joe Battle, Pellicano, and Bob Hop Dr., providing convenient access to Interstate 10 and the Zaragoza International Border Crossing. The surrounding area features residential, apartment, and commercial developments. The seller is open to subdividing the lot. A new Alamo Drafthouse Cinema has recently opened across the street at the Monteverde development. The location benefits from high traffic counts, with Pellicano Dr. recording 26,380 vehicles per day (VPD) and Joe Battle Blvd. recording 92,940 VPD. The surrounding demographics within a 3-mile radius include a population of 82,336 and an average household income of $81,900.
Key Highlights
- Prime commercial land development opportunity at the intersection of Joe Battle, Pellicano, and Bob Hop Dr.
- Easy access to Interstate 10 and the Zaragoza International Border Crossing.
- High traffic counts: Pellicano Dr. at 26,380 VPD and Joe Battle Blvd. at 92,940 VPD.
Property Analytics
Property Profile
Location Intelligence
Current Use by Public Records
Luis A. Terrazas, DVM
Veterinary Clinic
Vogue Hair Salon
Hair Salon
Ocean Nails
Nail Salon
Murphy Express
Gas Station
Bee's Pastry Café
Restaurant


FAQs
What type of property is this?
Commercial land - 3.66-acre commercial land for development in El Paso, TX.
Where is this commercial land located?
The property is located at 12295 Pellicano Dr El Paso, TX.
What are key features of this property?
This property features: Prime commercial land development opportunity at the intersection of Joe Battle, Pellicano, and Bob Hop Dr.; Easy access to Interstate 10 and the Zaragoza International Border Crossing.; **High traffic counts:** Pellicano Dr. at 26,380 VPD and Joe Battle Blvd. at 92,940 VPD.