Commercial Land in Growing
For Sale
Contact for pricing
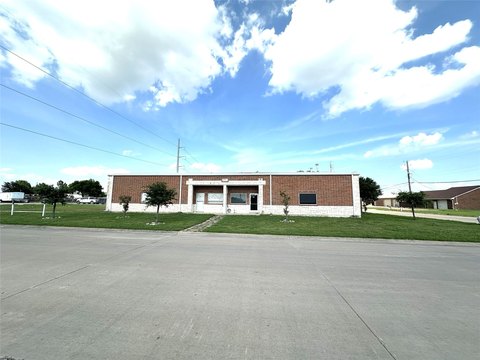
2605 Country Club Rd, Wylie, TX 75098
Located in a rapidly growing area with high development potential.
Property Size8,278 SF
Price / SF$269.13
Days on Market1916
Property Features for 2605 Country Club Rd
General Information
Standard status
Active
Size
8,278 SF
Class
A
Property subtype
Retail, Land, Office
Zoning
PD (retail)
Lease Type
NNN
Building Details
Year Built
2026
Buildings
1
Stories
1
Units
6
Tenancy
Multi
Listing Agency:
Imperium Holdings LP
Listed By:
Stephen Schattner · License #TX 0502217
Source:
Crexi
Added: Jul 10, 2021
Changed: Sep 25
Last Checked: Oct 7 at 10:26AM
Displayed information is deemed reliable but is not guaranteed and should be independently verified. All listing content including descriptions, pricing, images are the copyrighted material of Imperium Holdings LP
Investment Insights
Based on property information with market context.
Located approximately 36 minutes north of downtown Dallas, this commercial property is situated at the southwest corner of FM 1378 and FM 2514 in Wylie, Texas. The area has experienced rapid population growth. Both roads have been widened into six-lane thoroughfares. The property is located at the signalized intersection of two major regional thoroughfares, bordered by the City of Wylie to the southwest, the Town of Lucas to the northwest, and the Town of Saint Paul to the southeast and northeast. The property will be shadow-anchored by a new Tom Thumb grocery store at the northwest corner. The Tom Thumb development is planned to include a 130,000-square-foot shopping center anchored by Tom Thumb and a 25,000-square-foot restaurant village with 15 pad sites and a community park. Construction for the Tom Thumb is expected to begin in the fourth quarter of 2025 and be completed in 2026. The neighboring community of Parker prohibits commercial development, limiting retail competition up to five miles west. High barriers to entry have historically limited commercial development in the area. The property is a commercial island, offering business owners an opportunity to capture consumers within an expansive trade area. Limited retail services exist for two miles south, five miles west, three miles east up to the edge of Lake Lavon, and ten miles north, approximately half the distance to US 380. The intersection is surrounded by several thousand existing high-density residential homes to the south, with several thousand more lots planned immediately north and east. A CVS has been constructed and is currently operating. The site, zoned Planned Development, PD-10, is suitable for fuel operations and banks, retail and professional services, automotive businesses, and drive-through and sit-down restaurants. All utilities are on site. The property size is 8278 square meters.
Key Highlights
- Shadow‑anchored by a new Tom Thumb and a 25,000‑square‑foot restaurant village with 15 pad sites and a community park (construction expected Q4 2025‑2026).
- Located at the signalized intersection of FM 1378 and FM 2514, two major six‑lane thoroughfares in a rapidly growing region north of Dallas.
- High barriers to entry and limited retail competition due to Parker prohibiting commercial development.
Financial Insights
Estimated NOI and Cap Rate
NOI / Yr
$133,197
Cap Rate
5.98%
Suggested Prices Based on Cap Rates
Cap Rate 5%
$2,663,940
$2.7M
Cap Rate 7%
$1,902,814
$1.9M
Cap Rate 9%
$1,479,967
$1.5M
Market Conditions
NOI Build-Up for 8,278 SF
Gross rent
$199.7K $24.12/SF
− Vacancy
−$9.4K −$1.13/SF
EGI
$190.3K $22.99/SF
− OpEx
−$57.1K −$6.90/SF
NOI
$133.2K $16.09/SF
Area
Collin County, TX
Vacancy
4.70%
Lease Rate
$24.12 /SF/Yr
Expense Ratio
30.00%
Simulate Cap Rate and NOI
Suggested Prices Based on Cap Rates
Cap Rate 5%
$2,663,940
Cap Rate 7%
$1,902,814
Cap Rate 9%
$1,479,967
Alternative Uses
Best Use
Industrial
$8.23M
$7.20M – $9.60M
NOI $575,787 @ 7.0% cap · market cap 25.84%
Second Best
Retail
$1.90M
$1.66M – $2.22M
NOI $133,197 @ 7.0% cap · market cap 5.98%
Theoretical Best
—
—
same as Best Use
Zoning and permitted uses should be independently verified with authorities.
Property Analytics
Unlock full access to Insights
Subscribe to Realmo Intelligence
Open Analytics
Current Use
Location Intelligence
Trade Area within ½ mile
905
Businesses Nearby
Explore this area
Business Placement
Demographics for 75098, TX
67,212
Population
22,080
Households
3
Avg Household Size
35
Median Age
41%
College-Educated
91%
High-School Grad
32.0 sq mi
ZIP Area
2,100
Density / Sq Mi
$115,587
Median Household Income
$53,163
Median Earnings
$1,979
Median Rent
$362,900
Median Home Value
Check the figures for this property
Cap Rate, Value Estimation, Potential NOI and more
View Realmo Analytics
Market
Vacancy Rate% for Office in South region

Questions? Ask Rey
Realmo’s AI knows this listing — price, zoning, demand, history. Ask anything.


Frequently Asked Questions
What type of property is this?
Commercial land - Located in a rapidly growing area with high development potential.
Where is this commercial land located?
The property is located at 2605 Country Club Rd Wylie, TX.
What is the asking price?
The asking price for this property is $2,227,864.
What are key features of this property?
This property features: Shadow‑anchored by a new Tom Thumb and a 25,000‑square‑foot restaurant village with 15 pad sites and a community park (construction expected Q4 2025‑2026).; Located at the signalized intersection of FM 1378 and FM 2514, two major six‑lane thoroughfares in a rapidly growing region north of Dallas.; High barriers to entry and limited retail competition due to Parker prohibiting commercial development.