Restaurant with Event
For Sale
$3,250,000
735 E Interstate 10, Seguin, TX 78155
CommercialSale, Seguin, TX
Property Size23,800 SF
Lot Size3.30 Acres
Price / SF$136.55
Days on Market49
Property Features for 735 E Interstate 10
General Information
Property type
Commercial Sale
Property subtype
Other
Zoning
comm
Parking features
Driveway
Exterior features
Lighting
Lot features
Three To Five Acres, City Lot, Level
Elementary school district
Seguin ISD
Middle school district
Seguin ISD
High school district
Seguin ISD
Directions
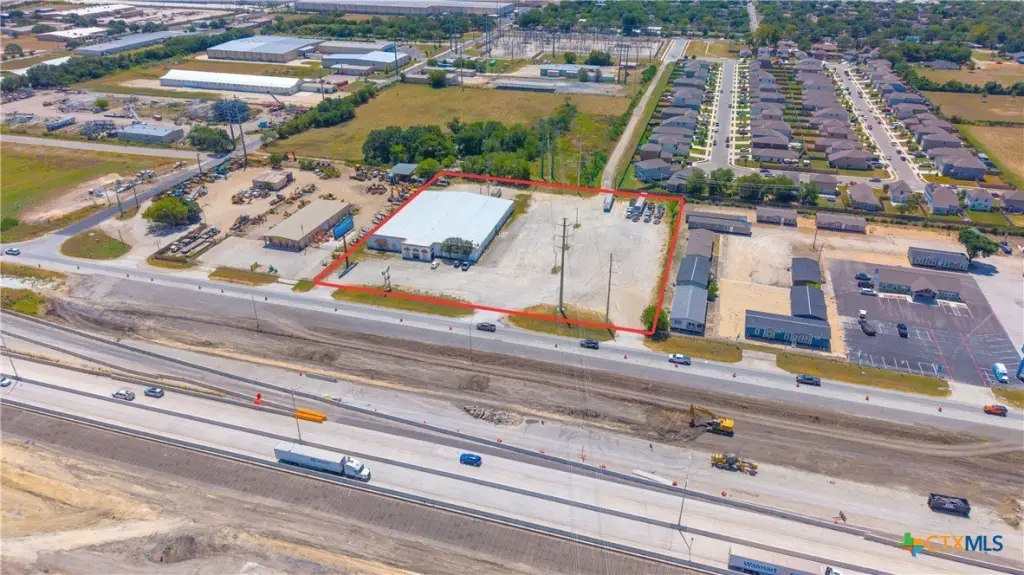
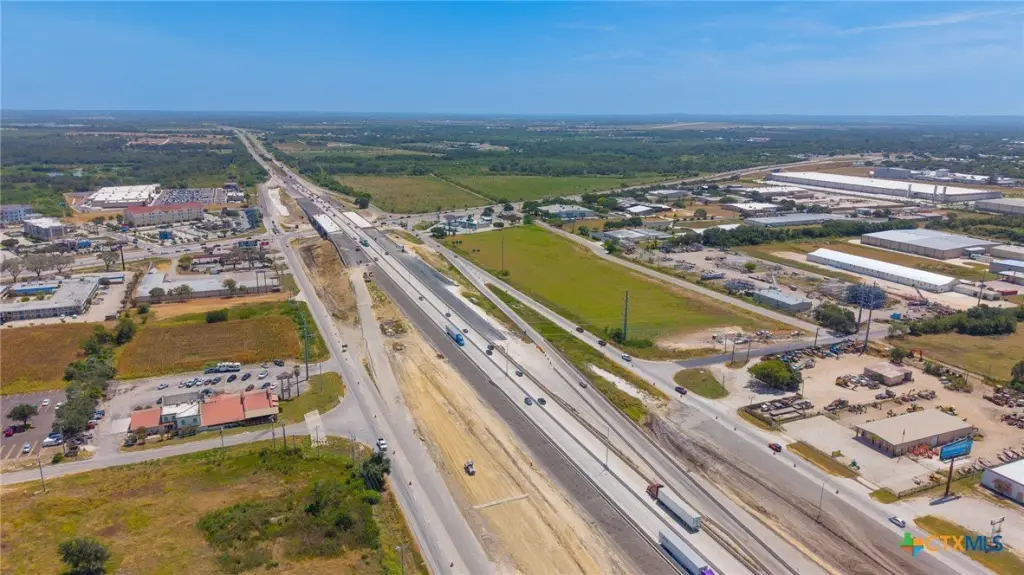
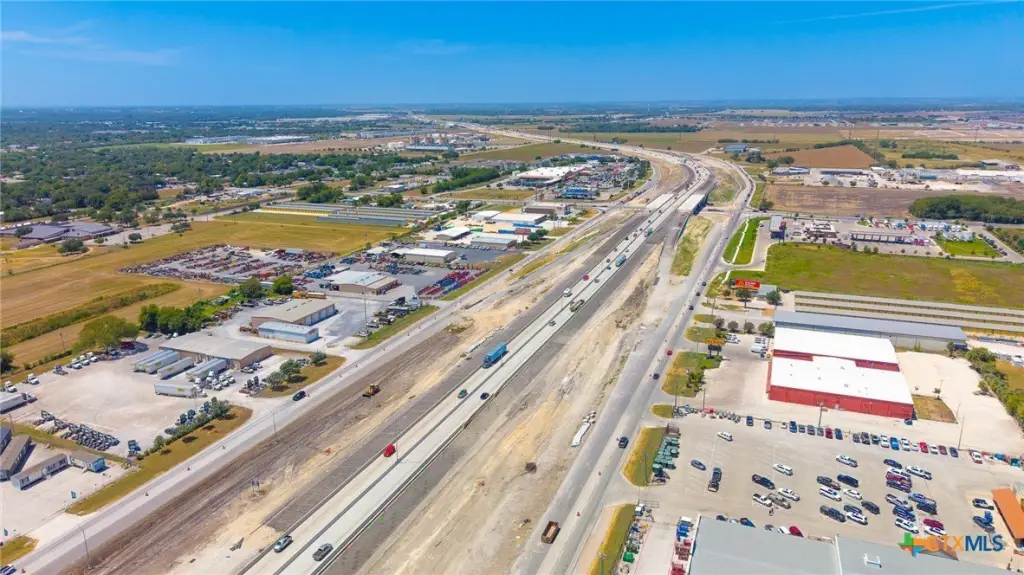
ALONG INTERSTATE 10. SOUTH SIDE OF IH 10. BEWEEN AUSTIN ST. AND HWY 123.
Standard status
Active
APN
51534
Size
23,800 SF
Lot size
3.30 Acres
Taxes and HOA fees
Tax Year
2026
Tax Description
ABS: 6 SUR: H BRANCH 3.3000 AC.
Tax Annual Amount
21785
Legal Description
ABS: 6 SUR: H BRANCH 3.3000 AC.
Utilities
Sewer type
Public Sewer
Heating system
Central
Cooling system
Window Unit(s), Central Air
Water source
Public
Building Details
Year built
1976
Floors in Building
1
Flooring type
Concrete, Tile, Parquet Wood
Building materials
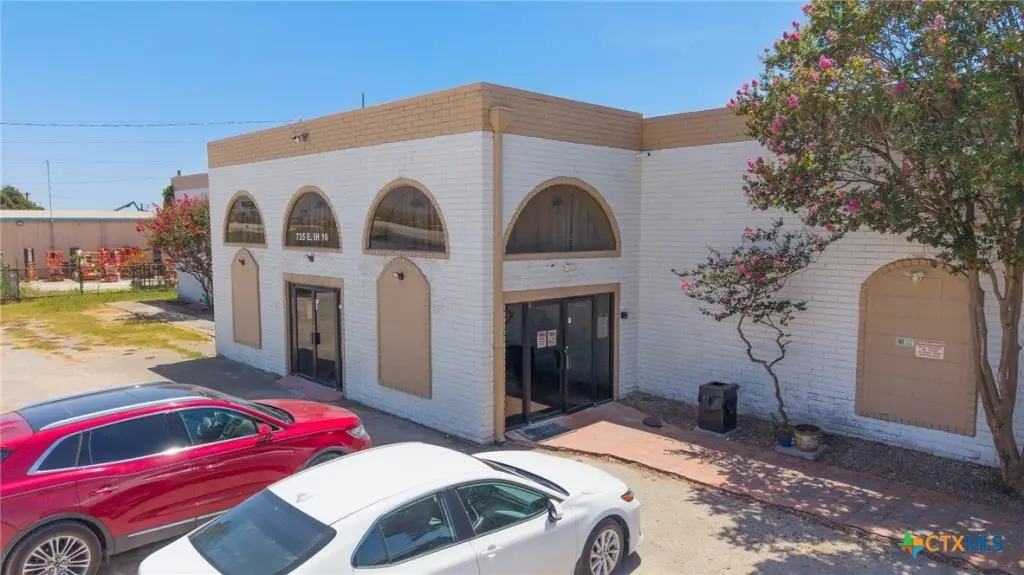
Brick, MetalSiding
Roof type
Metal
Listing Agency:
Anders Pierce Realty, LLC
(830) 214-6002
Listed By:
Heath Anders · License #0498440
(830) 534-8811
Added: Aug 26
Changed: Sep 13
Last Checked: Oct 13 at 10:06PM
MLS# 623440
Copyright © 2026 Central Texas Multiple Listing Service. All rights reserved. All information provided by the listing agent/broker is deemed reliable but is not guaranteed and should be independently verified.
Investment Insights
Based on property information with market context.
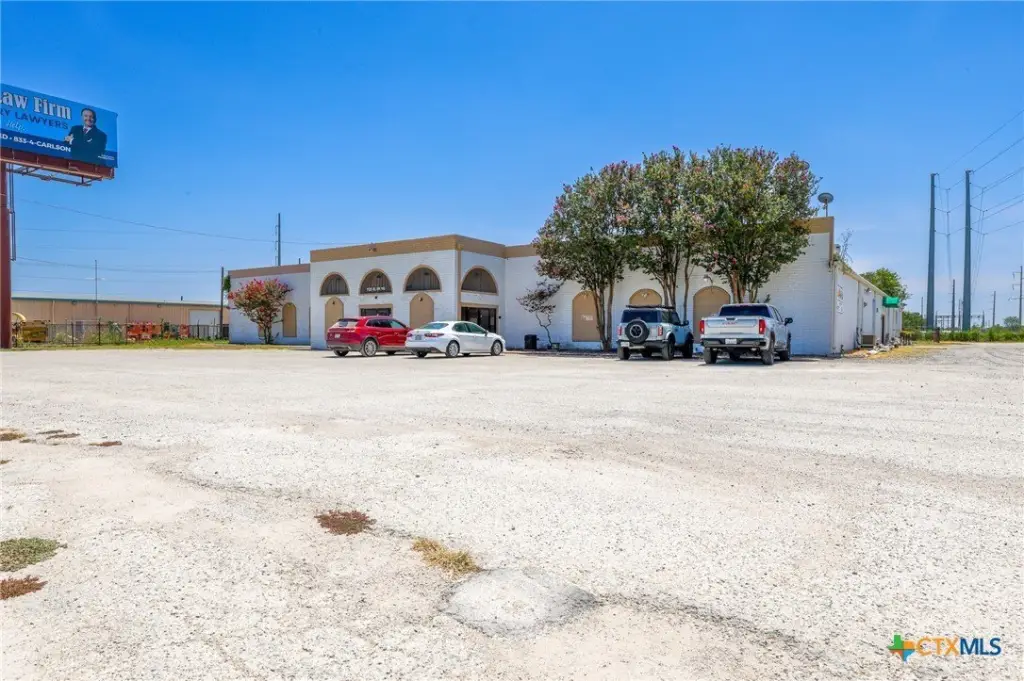
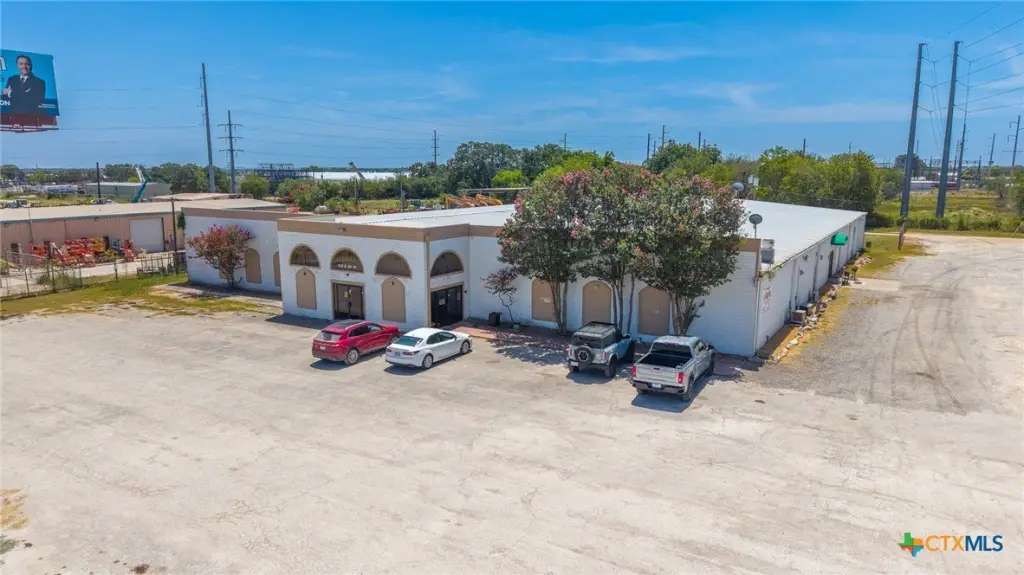
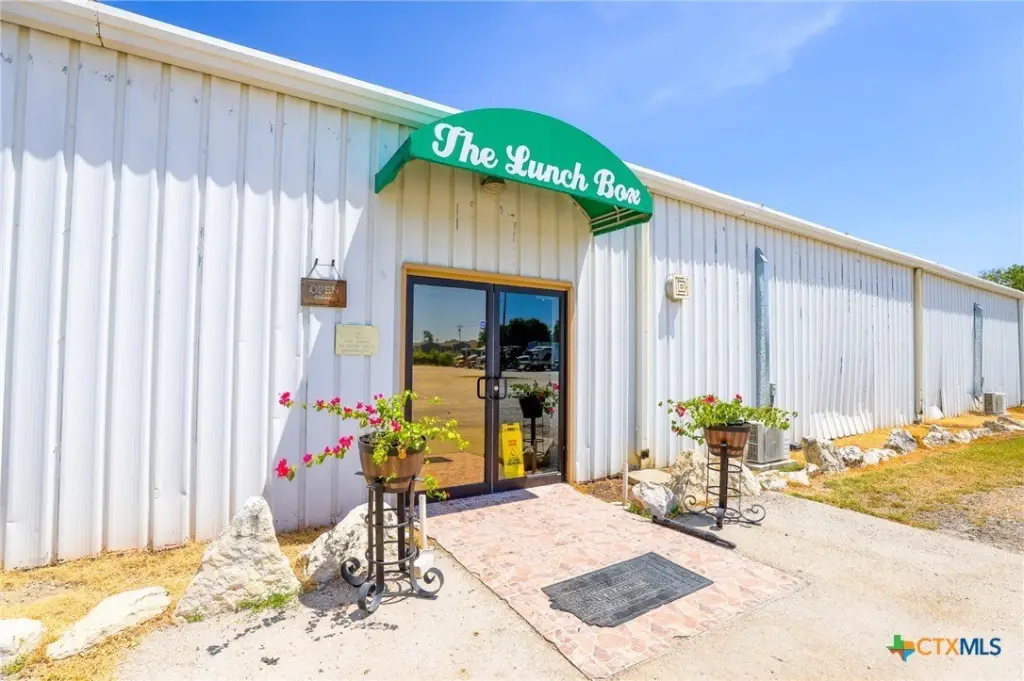
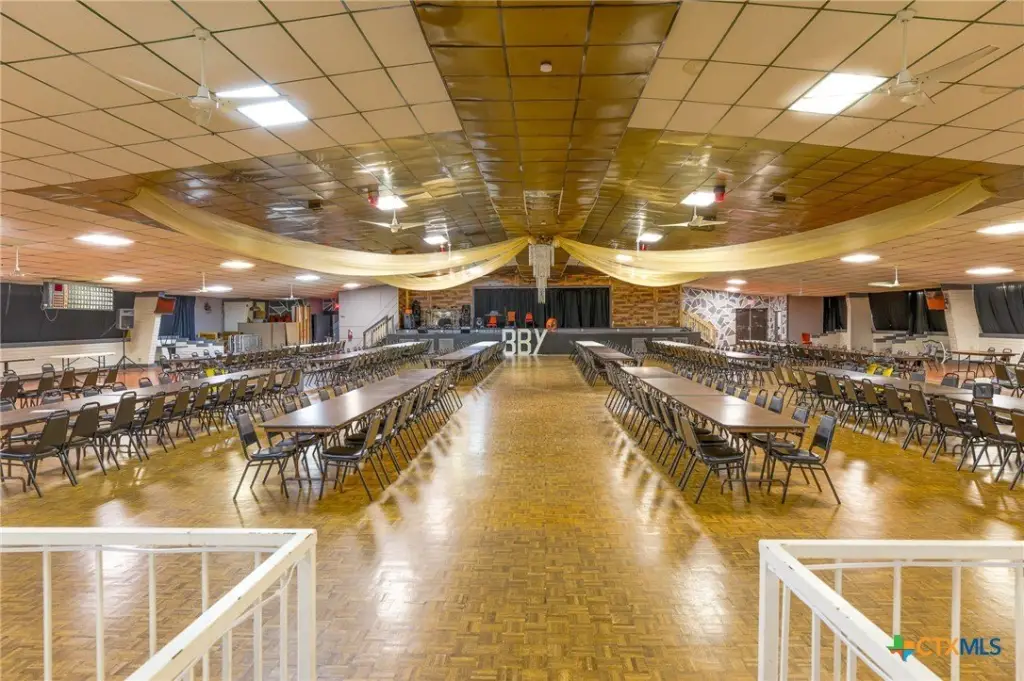
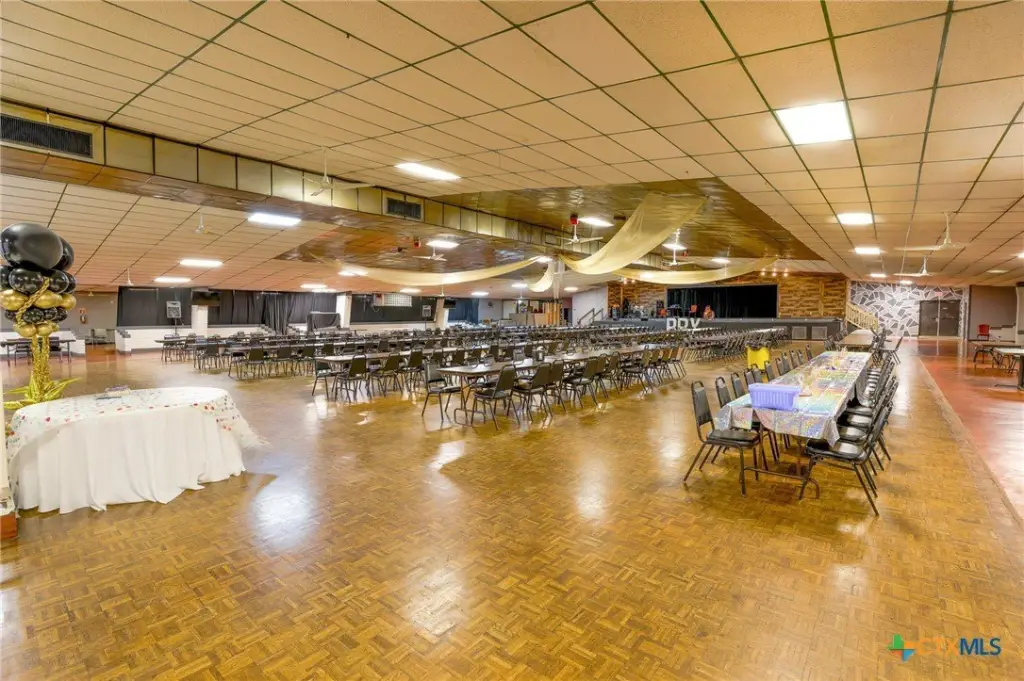
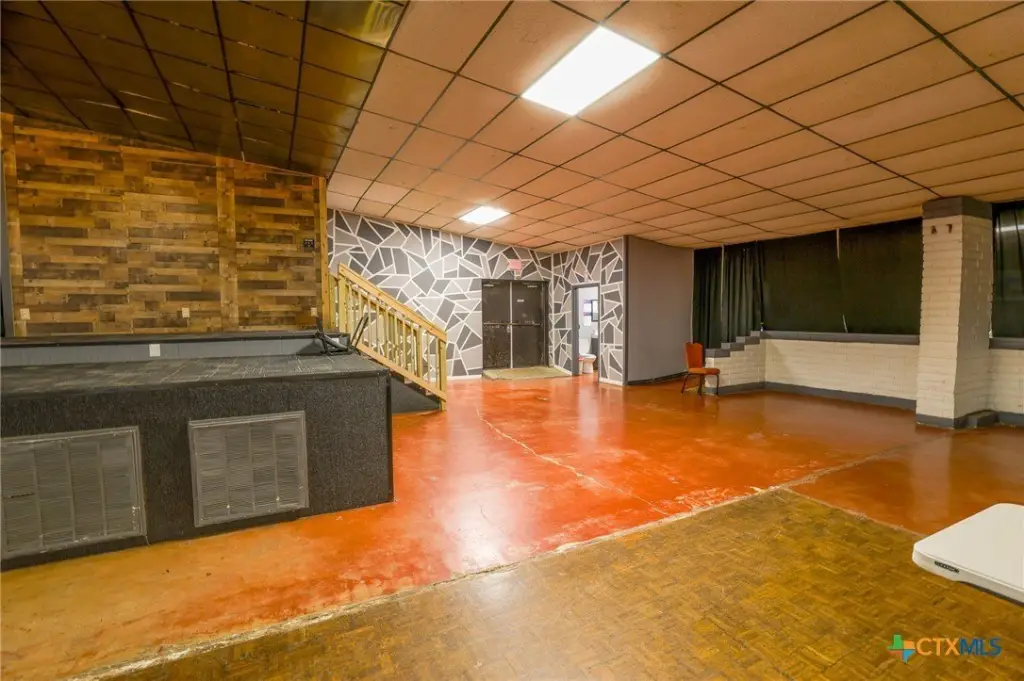
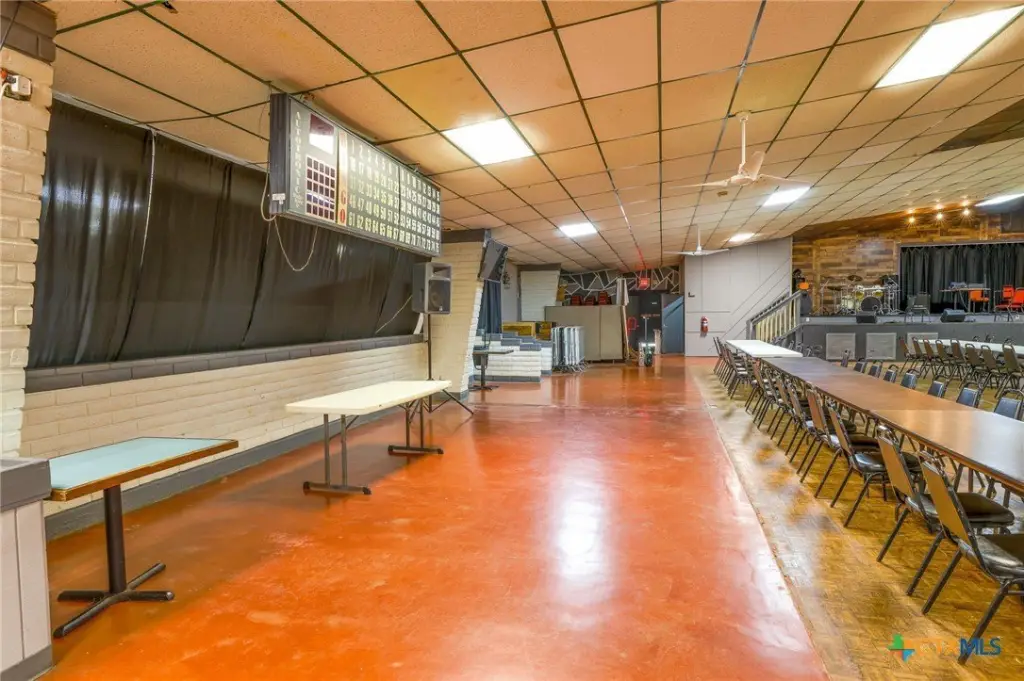
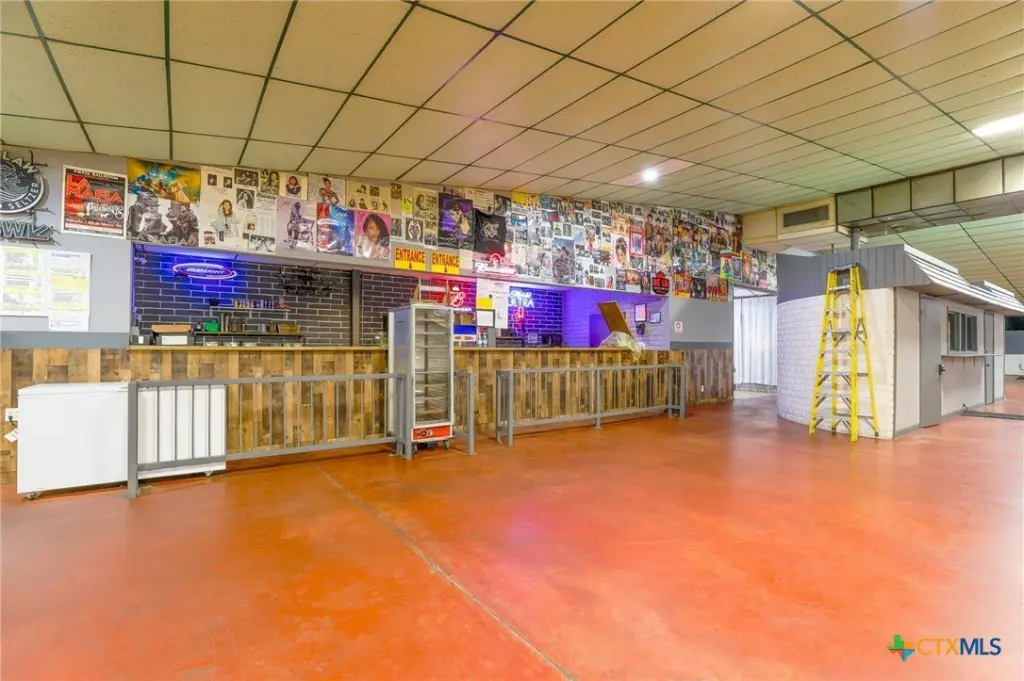
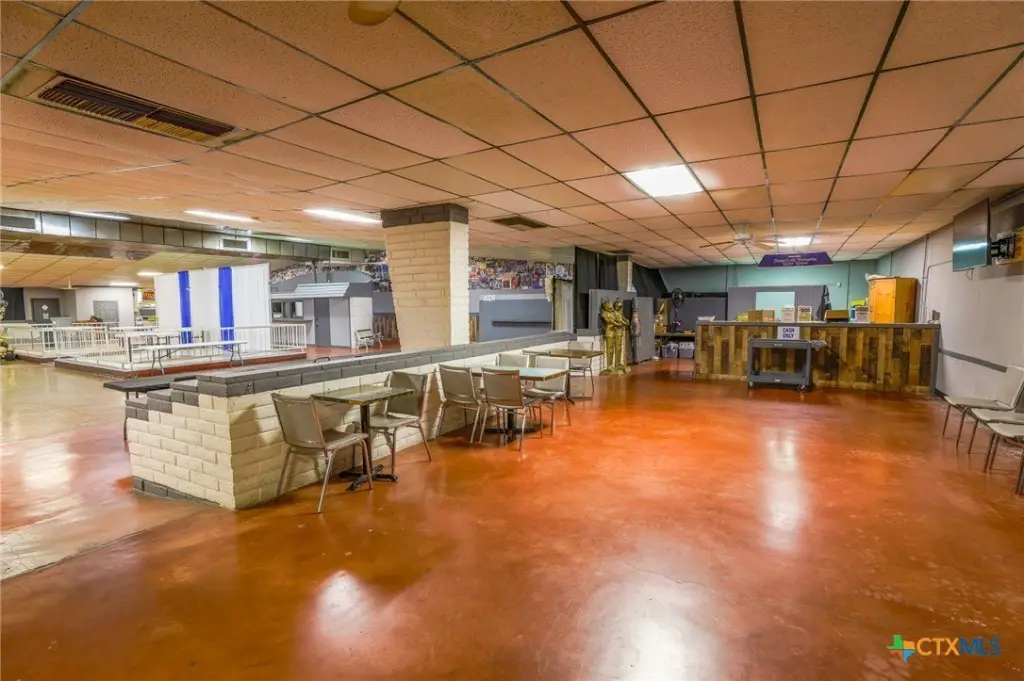
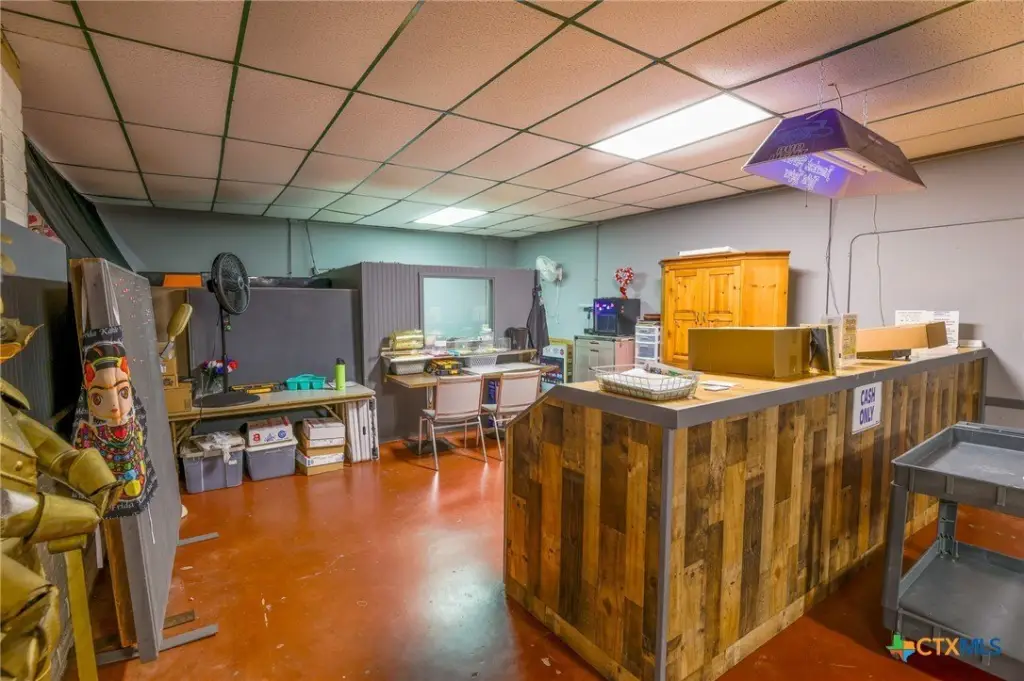
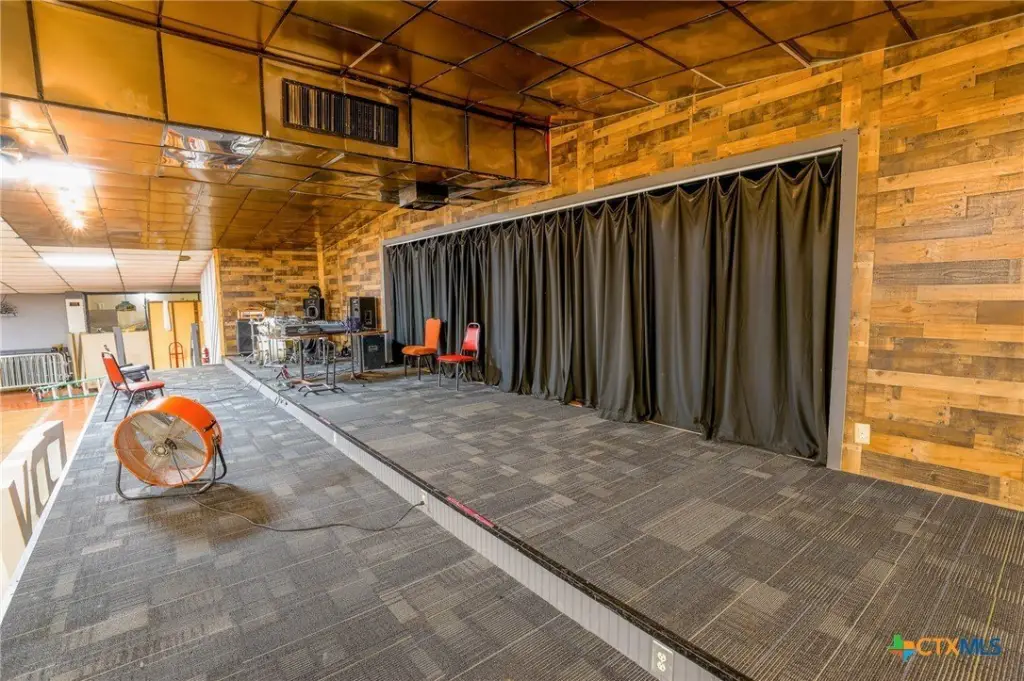
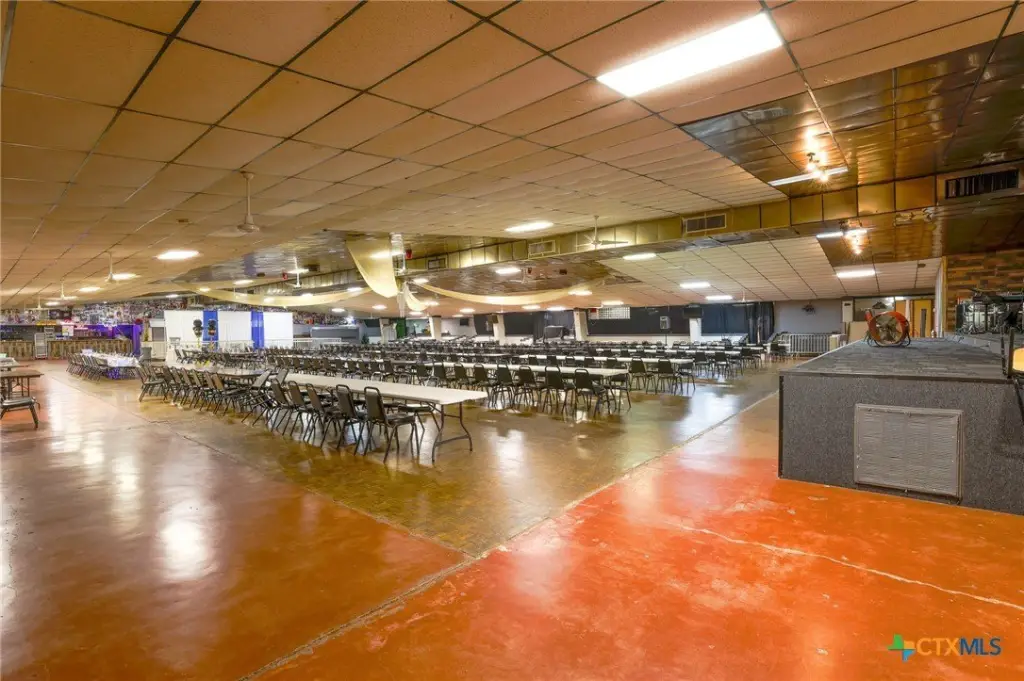
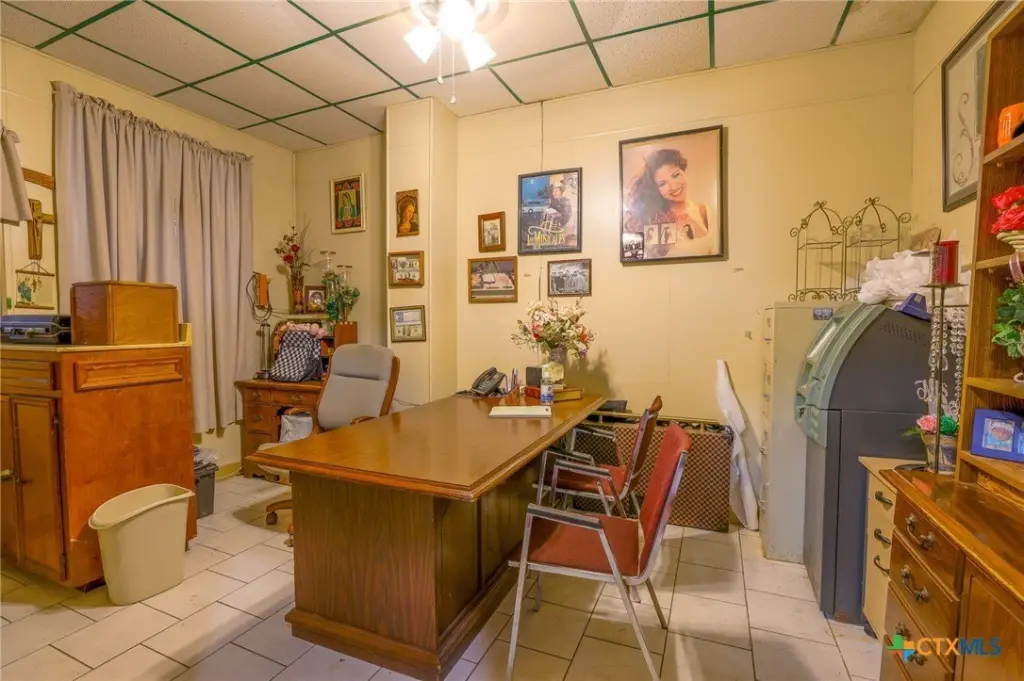
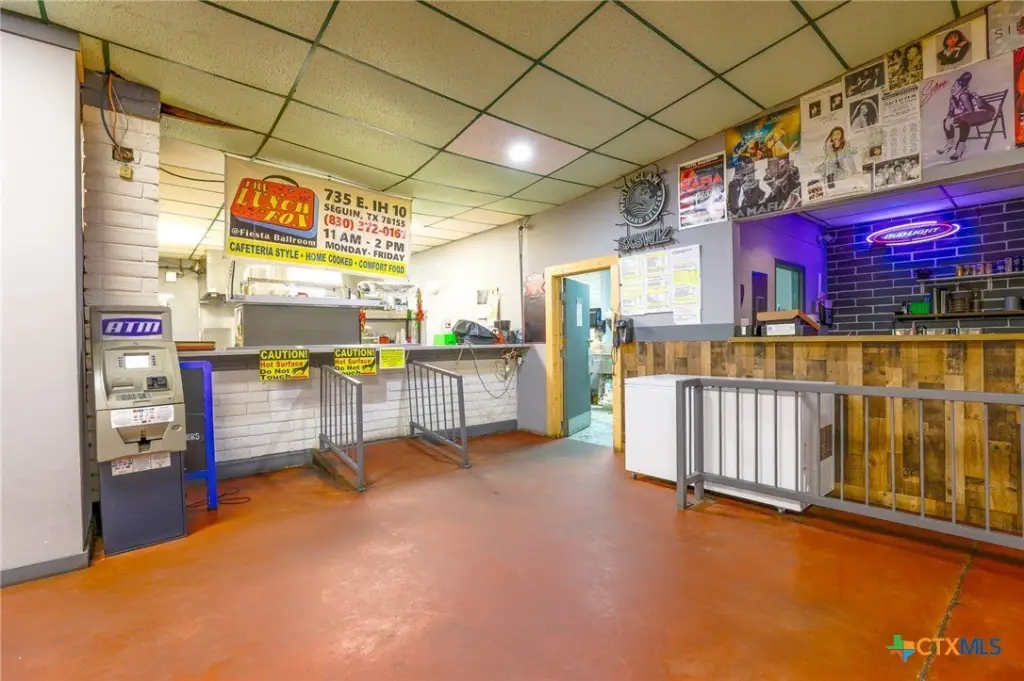
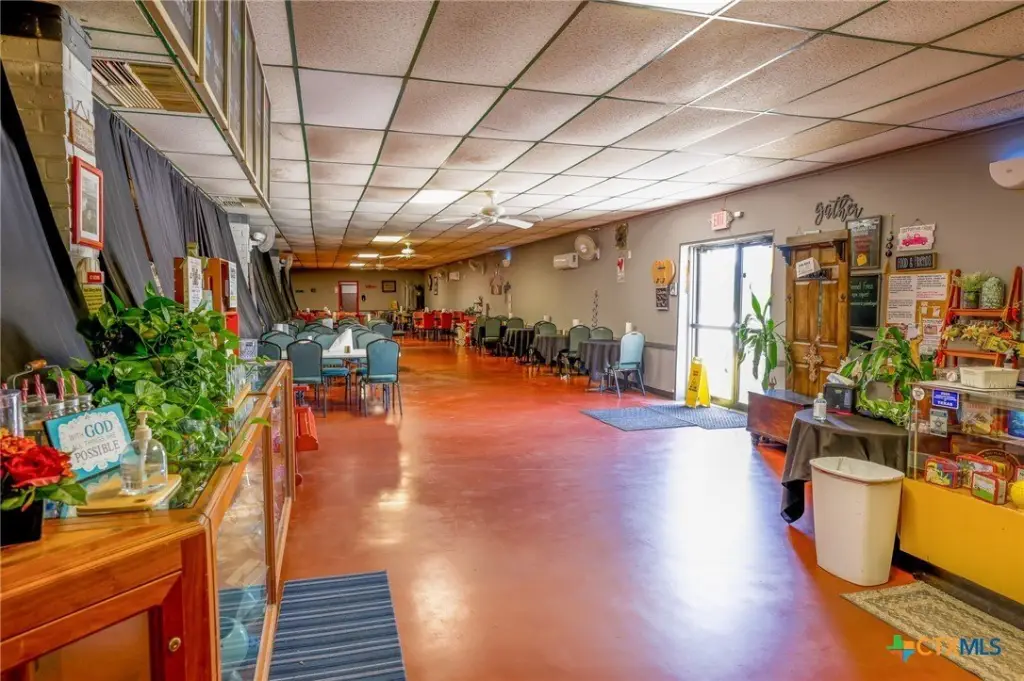
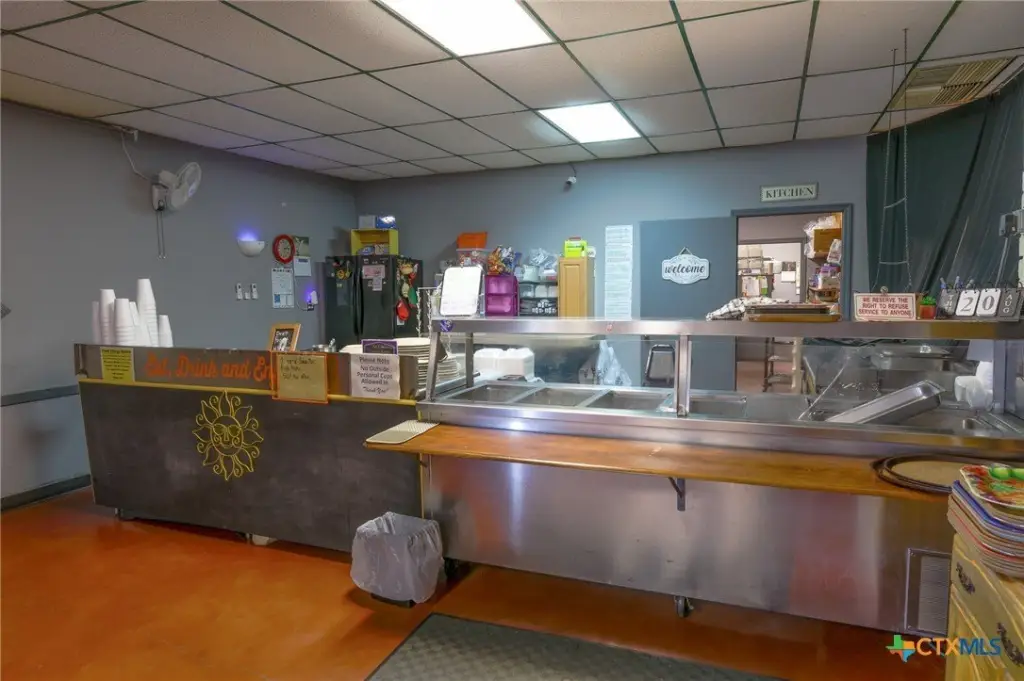
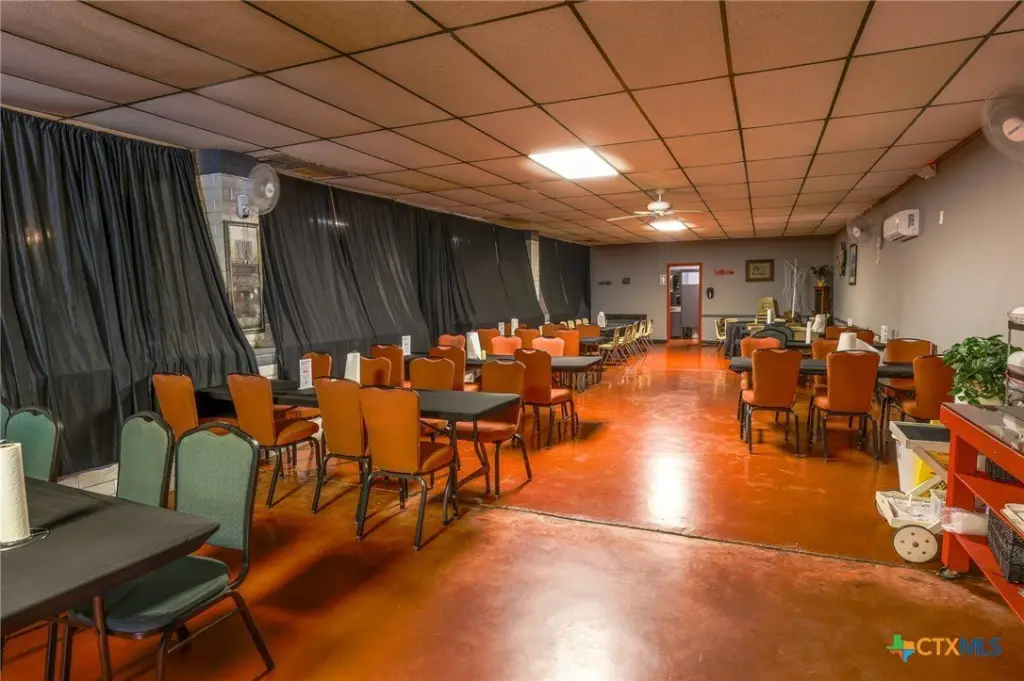
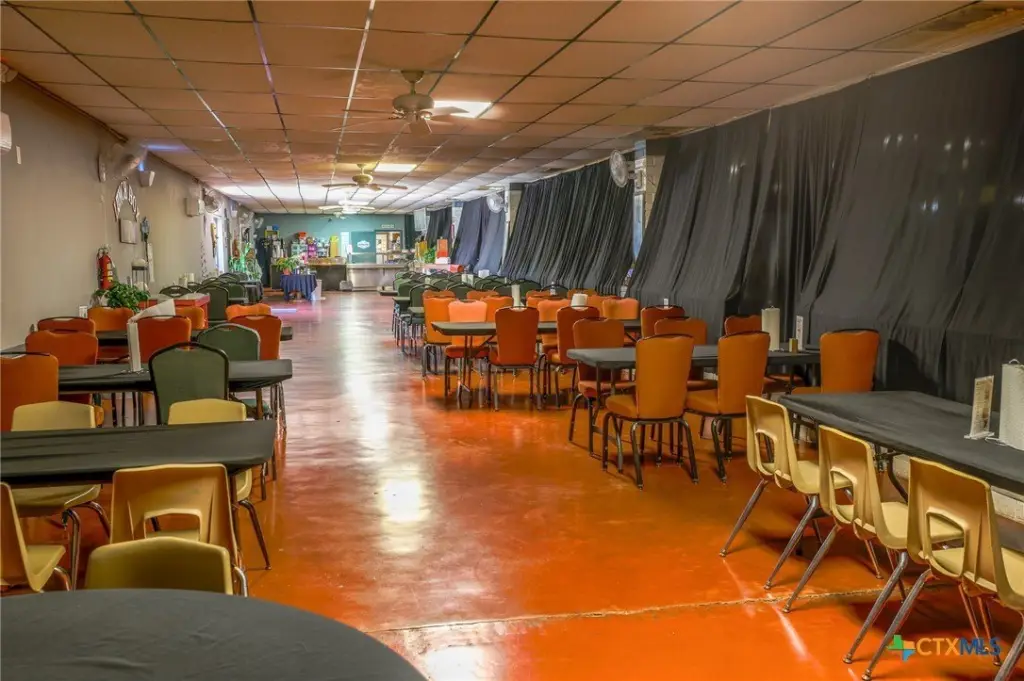
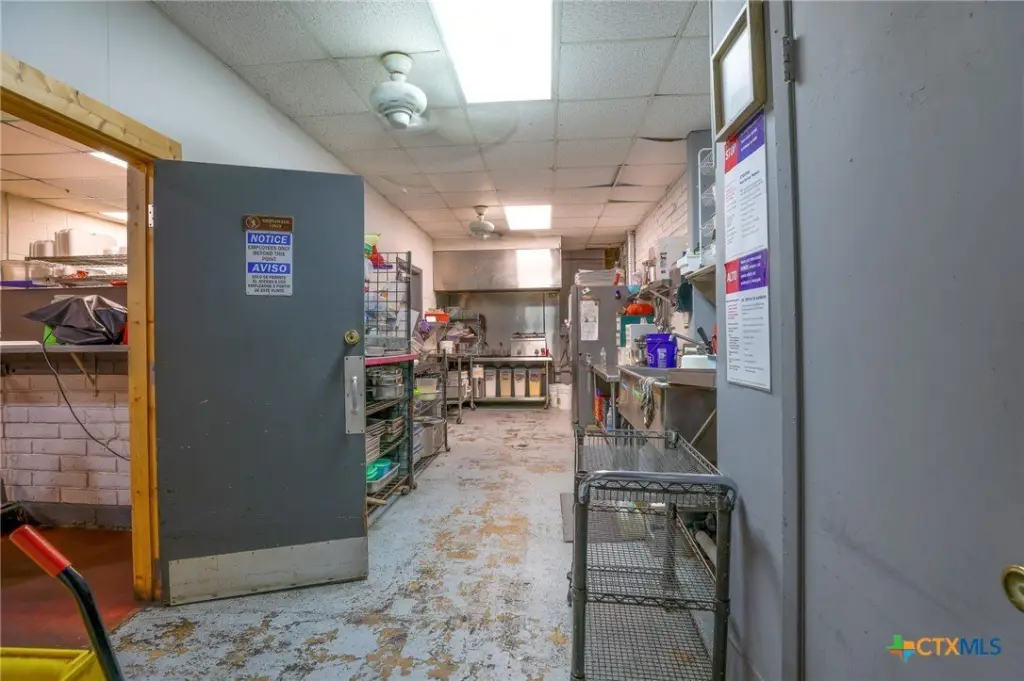
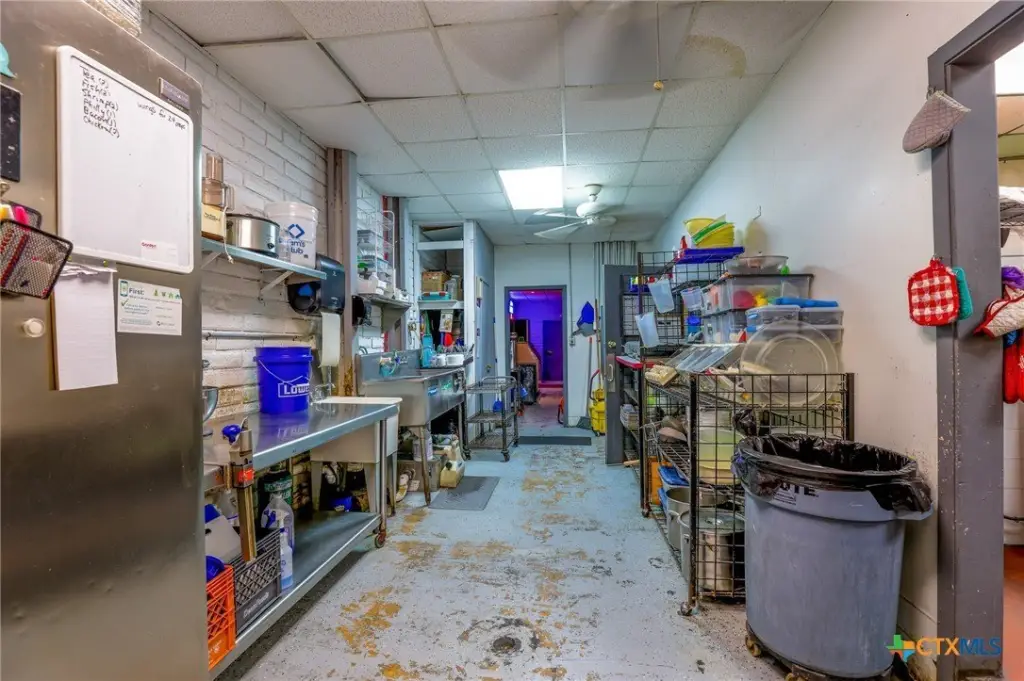
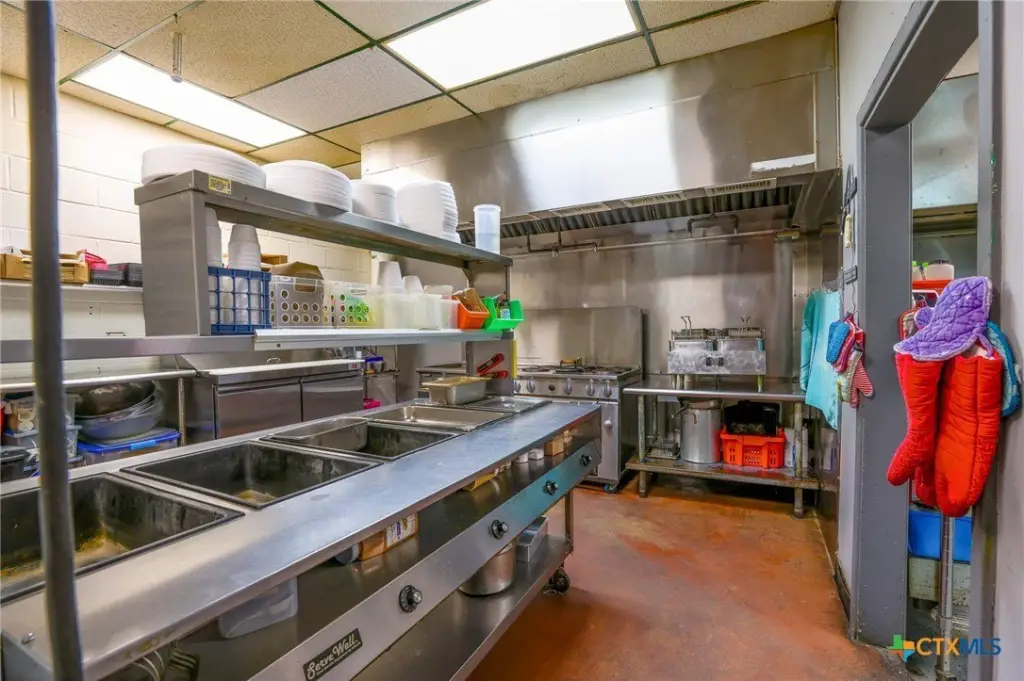
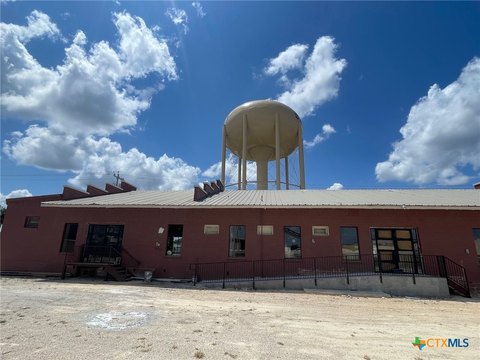
This 23,800-square-foot restaurant property occupies 3.3 acres along Interstate 10 in Seguin. The building currently accommodates a Monday-through-Friday lunch restaurant along with an event and dance hall. Food-service improvements include a commercial kitchen, two walk-in coolers, and one walk-in freezer. The property also has four downstairs restrooms and an additional restroom serving an upstairs office.
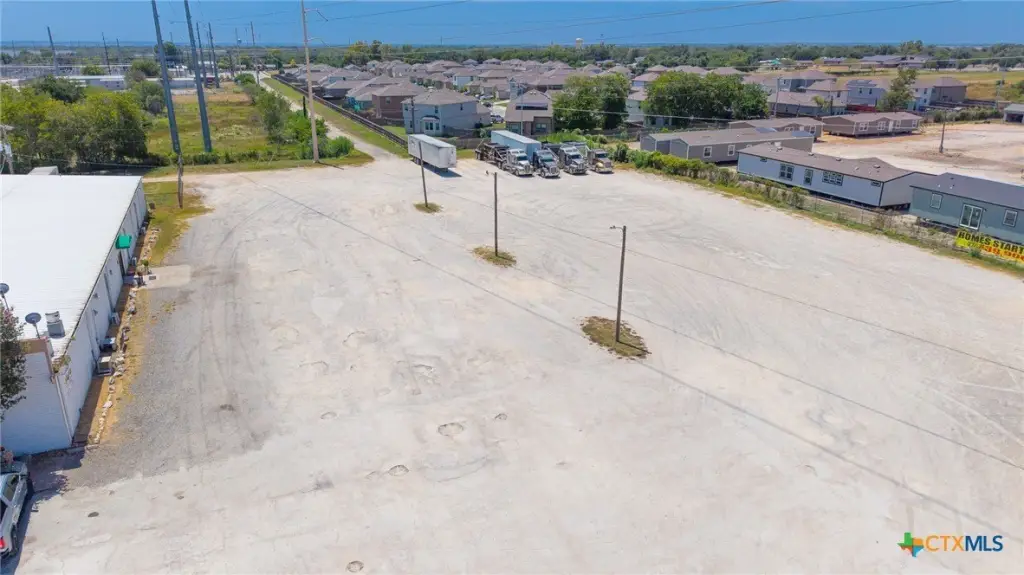
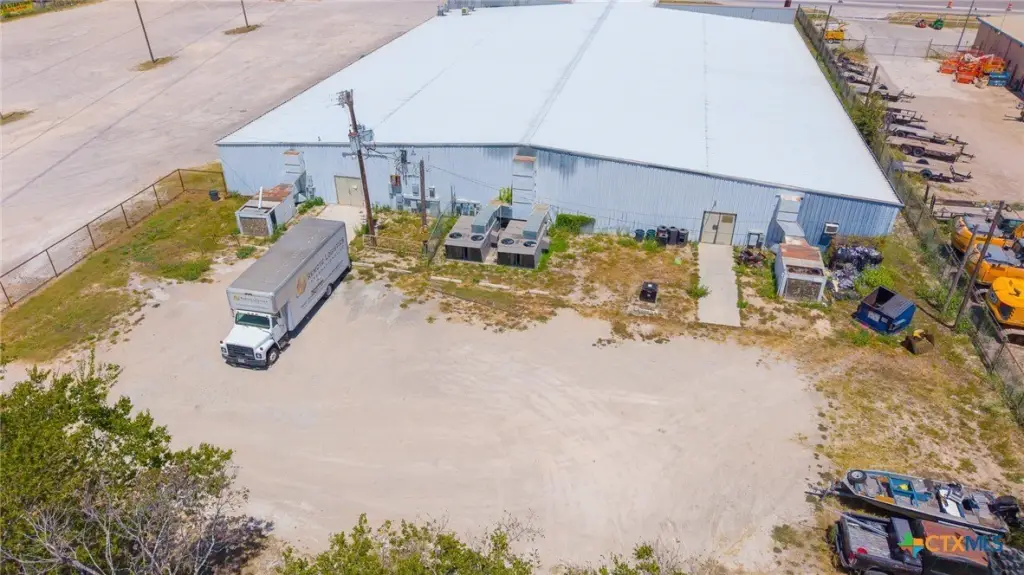
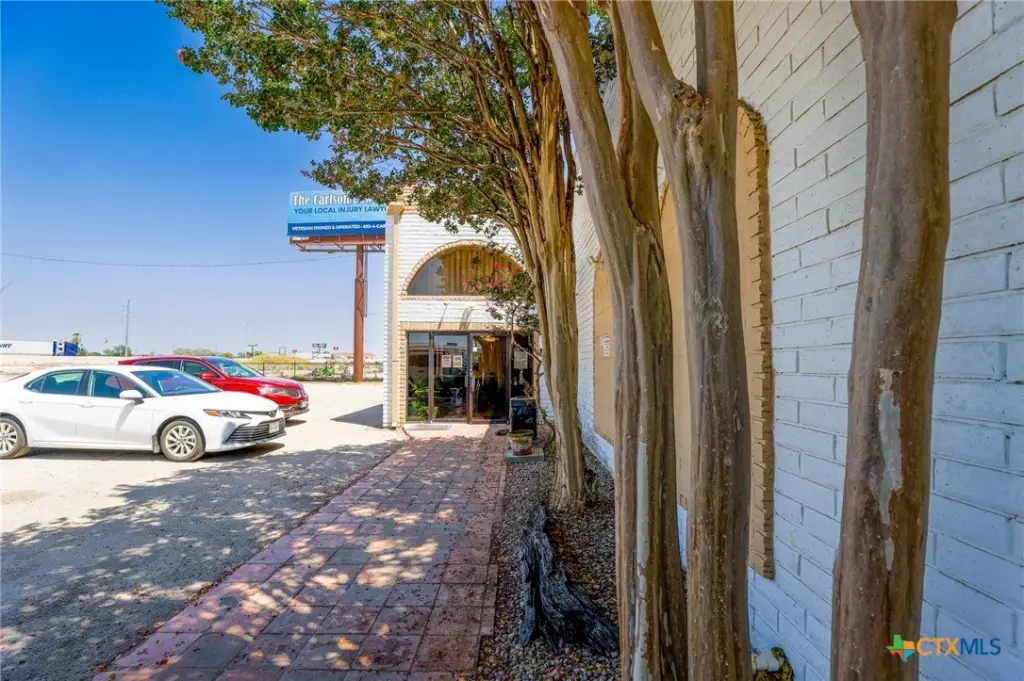
Approximately 1.5 acres are dedicated to parking, with a fenced secure area behind the building. Access is provided by three entrances from the IH 10 frontage road, between State Highway 123 and North Austin Street. HVAC service includes five mini-split units, five central units, and two window wall units. Brick and metal siding, tile, concrete, and parquet wood are among the building materials and finishes. Kitchen equipment and other non-realty items may be negotiated with the sale.
Approximately 1.5 acres are dedicated to parking, with a fenced secure area behind the building. Access is provided by three entrances from the IH 10 frontage road, between State Highway 123 and North Austin Street. HVAC service includes five mini-split units, five central units, and two window wall units. Brick and metal siding, tile, concrete, and parquet wood are among the building materials and finishes. Kitchen equipment and other non-realty items may be negotiated with the sale.
Key Highlights
- 23,800‑square‑foot building on 3.3 acres along Interstate 10
- Approximately 1.5 acres of parking plus a fenced secure area behind the building
- Three entrances from the IH10 frontage road
Financial Insights
Estimated NOI and Cap Rate
NOI / Yr
$142,443
Cap Rate
4.38%
Suggested Prices Based on Cap Rates
Cap Rate 5%
$2,848,860
$2.8M
Cap Rate 7%
$2,034,900
$2.0M
Cap Rate 9%
$1,582,700
$1.6M
Market Conditions
NOI Build-Up for 23,800 SF
Gross rent
$214.2K $9.00/SF
− Vacancy
−$10.7K −$0.45/SF
EGI
$203.5K $8.55/SF
− OpEx
−$61.0K −$2.56/SF
NOI
$142.4K $5.98/SF
Area
Guadalupe County, TX
Vacancy
5.00%
Lease Rate
$9.00 /SF/Yr
Expense Ratio
30.00%
Simulate Cap Rate and NOI
Suggested Prices Based on Cap Rates
Cap Rate 5%
$2,848,860
Cap Rate 7%
$2,034,900
Cap Rate 9%
$1,582,700
Alternative Uses
Best Use
Specialty Retail
$4.88M
$4.27M – $5.69M
NOI $341,349 @ 7.0% cap · market cap 10.50%
Second Best
Industrial
$2.03M
$1.78M – $2.37M
NOI $142,443 @ 7.0% cap · market cap 4.38%
Theoretical Best
Office A
$6.24M
$5.46M – $7.28M
NOI $436,968 @ 7.0% cap · market cap 13.45%
Zoning and permitted uses should be independently verified with authorities.
How Realmo checks its estimates
Property Analytics
Unlock full access to Insights
Subscribe to Realmo Intelligence
Open Analytics
Current Use
Lease Details
Yes
Highway access
Yes
Paved road access
Location Intelligence
Trade Area within ½ mile
186
Businesses Nearby
Balanced
Demand for This Use
Explore this area
Business Placement
Demographics for 78155, TX
51,772
Population
21,791
Households
2.4
Avg Household Size
40
Median Age
22%
College-Educated
85%
High-School Grad
355.5 sq mi
ZIP Area
146
Density / Sq Mi
$71,367
Median Household Income
$38,985
Median Earnings
$1,149
Median Rent
$246,000
Median Home Value
Check the figures for this property
Cap Rate, Value Estimation, Potential NOI and more
View Realmo Analytics
Market
Vacancy Rate% for Retail in South region

Questions? Ask Rey
Realmo’s AI knows this listing — price, zoning, demand, history. Ask anything.




Frequently Asked Questions
What type of property is this?
Conventional restaurant - Commercial kitchen, walk-in cold storage, and substantial parking support food-service operations.
Where is this conventional restaurant located?
The property is located at 735 E Interstate 10 Seguin, TX.
What is the asking price?
The asking price for this property is $3,250,000.
What are key features of this property?
This property features: 23,800‑square‑foot building on 3.3 acres along Interstate 10; Approximately 1.5 acres of parking plus a fenced secure area behind the building; Three entrances from the IH10 frontage road


