Mixed-Use Live-Work
For Sale
$1,795,000
Pending
67-71 Haight Street, San Francisco, CA 94102
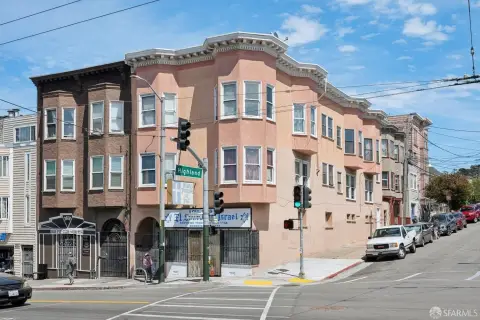
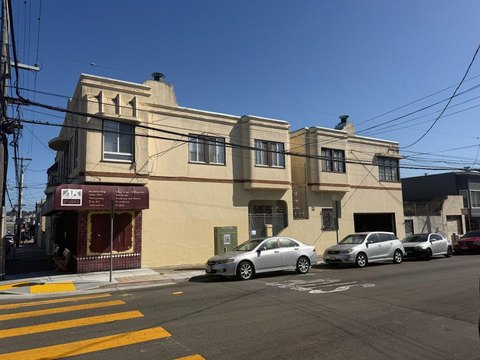
Two-unit building with an upper remodeled residence and a ground-floor retail or office space with 16-foot ceilings.
Property Size2,450 SF
Days on Market563
Property Features for 67-71 Haight Street
General Information
Standard status
Pending
Size
2,450 SF
Property subtype
Mixed Use
Additional Details
Clear Height
16 ft
Building Details
Building Size
2,450 SF
Year Built
1952
Listing Agency:
Compass Commercial
Listed By:
Davis Nguyen · License #01509978
(415) 345-3000
Source:
Elevationrealestate
Added: Apr 7, 2025
Changed: Oct 11
Last Checked: Oct 21 at 5:33AM
Displayed information is deemed reliable but is not guaranteed and should be independently verified. All listing content including descriptions, pricing, images are the copyrighted material of Compass Commercial

Ask AI about this property
Review the available facts, identify missing information and prepare questions for the agent.
Investment Insights
Based on property information with market context.
This mixed-use building consists of two units totaling approximately 2,450 square feet. The upper unit is an 800-square-foot one-bedroom, one-bath residential flat that has been remodeled with modern finishes and designed for abundant natural light. The ground floor offers approximately 1,650 square feet of retail or office space with soaring 16-foot ceilings, creating a flexible interior for a range of uses.
The property is for sale and will be delivered vacant upon close of escrow. This allows an owner-occupant or investor to take immediate possession of both levels.
The layout supports a cohesive live-and-work configuration with residential quarters upstairs and commercial space below, with the added option to generate rental income from both units. The remarks also note long-term development potential subject to an 85-X height limit.
The property is for sale and will be delivered vacant upon close of escrow. This allows an owner-occupant or investor to take immediate possession of both levels.
The layout supports a cohesive live-and-work configuration with residential quarters upstairs and commercial space below, with the added option to generate rental income from both units. The remarks also note long-term development potential subject to an 85-X height limit.
Key Highlights
- Two‑unit mixed‑use building built in 1952 with approx. 2,450 SF total space
- Upper unit: remodeled 800 SF 1‑bedroom, 1‑bath residential flat
- Ground‑floor space: approx. 1,650 SF retail or office with soaring 16‑foot ceilings
Financial Insights
Estimated NOI and Cap Rate
NOI / Yr
$60,369
Cap Rate
3.36%
Suggested Prices Based on Cap Rates
Cap Rate 5%
$1,207,380
$1.2M
Cap Rate 7%
$862,414
$862.4K
Cap Rate 9%
$670,767
$670.8K
Market Conditions
NOI Build-Up for 2,450 SF
Gross rent
$107.9K $44.04/SF
− Vacancy
−$27.4K −$11.19/SF
EGI
$80.5K $32.85/SF
− OpEx
−$20.1K −$8.21/SF
NOI
$60.4K $24.64/SF
Area
San Francisco, CA
Vacancy
25.40%
Lease Rate
$44.04 /SF/Yr
Expense Ratio
25.00%
Simulate Cap Rate and NOI
Suggested Prices Based on Cap Rates
Cap Rate 5%
$1,207,380
Cap Rate 7%
$862,414
Cap Rate 9%
$670,767
Alternative Uses
Best Use
Retail
$11.17M
$9.77M – $13.03M
NOI $781,860 @ 7.0% cap · market cap 43.56%
Second Best
Office B
$862.4K
$754.6K – $1.01M
NOI $60,369 @ 7.0% cap · market cap 3.36%
Theoretical Best
Specialty Retail
$11.97M
$10.47M – $13.96M
NOI $837,707 @ 7.0% cap · market cap 46.67%
Zoning and permitted uses should be independently verified with authorities.
How Realmo checks its estimates
Property Analytics
Current Use
Lease Details
16 ft
Clear height
Location Intelligence
Trade Area within ½ mile
9,263
Businesses Nearby
Explore this area
Business Placement
Demographics for 94102, CA
39,432
Population
23,153
Households
1.7
Avg Household Size
40
Median Age
42%
College-Educated
81%
High-School Grad
0.7 sq mi
ZIP Area
56,331
Density / Sq Mi
$64,781
Median Household Income
$55,873
Median Earnings
$1,517
Median Rent
$996,300
Median Home Value
Market
Vacancy Rate% for Office in San Francisco, CA




Frequently Asked Questions
What type of property is this?
Live-work space - Two-unit building with an upper remodeled residence and a ground-floor retail or office space with 16-foot ceilings.
Where is this live-work space located?
The property is located at 67-71 Haight Street San Francisco, CA.
What is the asking price?
The asking price for this property is $1,795,000.
What are key features of this property?
This property features: Two‑unit mixed‑use building built in 1952 with approx. 2,450 SF total space; Upper unit: remodeled 800 SF 1‑bedroom, 1‑bath residential flat; Ground‑floor space: approx. 1,650 SF retail or office with soaring 16‑foot ceilings


