Renovated
For Sale
$900,000
6548 Specht AVE, Bell Gardens, CA 90201
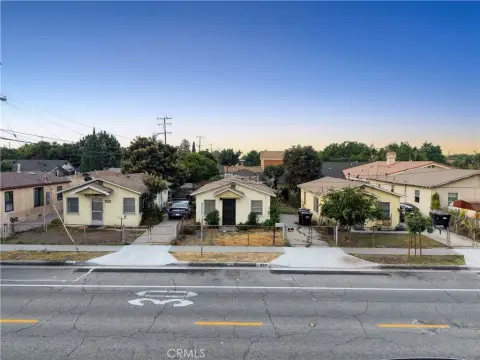
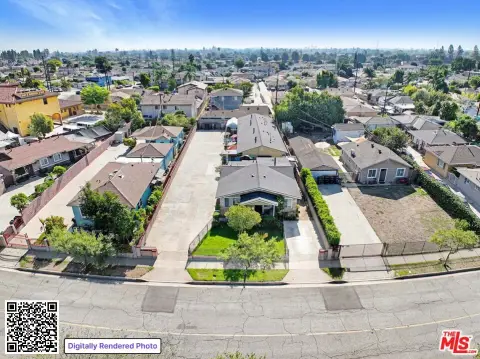
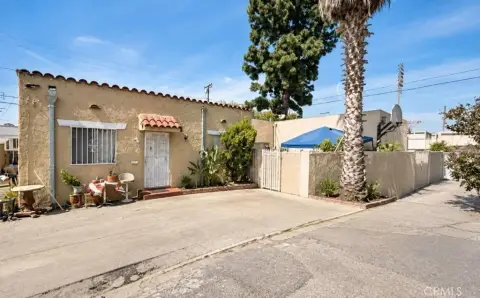
Two detached buildings provide updated interiors, assigned parking, and a large yard.
Property Size1,936 SF
Days on Market68
Property Features for 6548 Specht AVE
General Information
Standard status
Active
Size
1,936 SF
Property subtype
MULTI_FAMILY
Building Details
Building Size
1,936 SF
Year Built
1950
Listing Agency:
IRN Realty
Listed By:
Bing Hou · License #01026586
(626) 786-2143
Source:
Milsteinestates
Added: Aug 14
Changed: Oct 17
Last Checked: Oct 19 at 1:19PM
Displayed information is deemed reliable but is not guaranteed and should be independently verified. All listing content including descriptions, pricing, images are the copyrighted material of IRN Realty

Ask AI about this property
Review the available facts, identify missing information and prepare questions for the agent.
Investment Insights
Based on property information with market context.
Built in 1950, this quadplex comprises two detached buildings with fully updated interiors, a large yard, and one open assigned parking space for each unit. The property is configured as a four-unit residential income asset and is being offered together with 6544 Specht.
Most occupants are long-term Section 8 tenants, and the property is described as exempt from local rent control limits. Bell Gardens positioning provides access to major freeways, shopping centers, and local dining. The surrounding area is rated Very Walkable with a Walk Score of 79 and Bikeable with a Bike Score of 57.
Most occupants are long-term Section 8 tenants, and the property is described as exempt from local rent control limits. Bell Gardens positioning provides access to major freeways, shopping centers, and local dining. The surrounding area is rated Very Walkable with a Walk Score of 79 and Bikeable with a Bike Score of 57.
Key Highlights
- Four‑unit quadplex built in 1950
- Two detached buildings with fully updated interiors
- Large yard and one open assigned parking space per unit
Financial Insights
Estimated NOI and Cap Rate
NOI / Yr
$33,810
Cap Rate
3.76%
Suggested Prices Based on Cap Rates
Cap Rate 5%
$676,200
$676.2K
Cap Rate 7%
$483,000
$483.0K
Cap Rate 9%
$375,667
$375.7K
Market Conditions
NOI Build-Up for 1,936 SF
Gross rent
$52.3K $27.00/SF
− Vacancy
−$4.0K −$2.05/SF
EGI
$48.3K $24.95/SF
− OpEx
−$14.5K −$7.48/SF
NOI
$33.8K $17.46/SF
Area
Los Angeles County, CA
Vacancy
7.60%
Lease Rate
$27.00 /SF/Yr
Expense Ratio
30.00%
Simulate Cap Rate and NOI
Suggested Prices Based on Cap Rates
Cap Rate 5%
$676,200
Cap Rate 7%
$483,000
Cap Rate 9%
$375,667
Alternative Uses
Best Use
Multifamily LT 5
$483.0K
$422.6K – $563.5K
NOI $33,810 @ 7.0% cap · market cap 3.76%
Second Best
Apartment 5plus
$445.0K
$389.4K – $519.2K
NOI $31,152 @ 7.0% cap · market cap 3.46%
Theoretical Best
Office A
$1.04M
$907.0K – $1.21M
NOI $72,557 @ 7.0% cap · market cap 8.06%
Zoning and permitted uses should be independently verified with authorities.
How Realmo checks its estimates
Property Analytics
Unlock full access to Insights
Subscribe to Realmo Intelligence
Open Analytics
Location Intelligence
Trade Area within ½ mile
929
Businesses Nearby
Explore this area
Business Placement
Demographics for 90201, CA
95,810
Population
24,989
Households
3.8
Avg Household Size
32
Median Age
7%
College-Educated
55%
High-School Grad
6.0 sq mi
ZIP Area
15,968
Density / Sq Mi
$56,824
Median Household Income
$30,264
Median Earnings
$1,623
Median Rent
$542,800
Median Home Value
Check the figures for this property
Cap Rate, Value Estimation, Potential NOI and more
View Realmo Analytics
Market
Vacancy Rate% for Multifamily in West region





Frequently Asked Questions
What type of property is this?
Quadplex - Two detached buildings provide updated interiors, assigned parking, and a large yard.
Where is this quadplex located?
The property is located at 6548 Specht AVE Bell Gardens, CA.
What is the asking price?
The asking price for this property is $900,000.
What are key features of this property?
This property features: Four‑unit quadplex built in 1950; Two detached buildings with fully updated interiors; Large yard and one open assigned parking space per unit


