Residential Income Property with Central
For Sale
$244,900
Pending
63 Redwing Drive, Santa Rosa, CA 95409
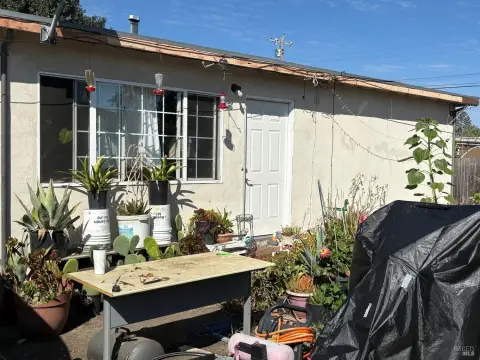
Built in 2020 with a covered exterior area and a kitchen equipped for everyday residential use.
Property Size1,040 SF
Days on Market94
Property Features for 63 Redwing Drive
General Information
Standard status
Pending
Size
1,040 SF
Total Parking Spaces
2
Property subtype
Manufactured In Park
Additional Details
Highway Access
Yes
Amenities
Ceiling Fan(s), Central Air
Central
Dishwasher, Free-Standing Gas Range, Free-Standing Refrigerator, Gas Water Heater, Microwave
Kitchen Island, Laminate Counters
Covered
Building Details
Year Built
2020
Listing Agency:
Full Spectrum Properties, Inc.
Listed By:
Rick Wells · License #01364860
(707) 328-4129
Source:
Evrealestate
Added: Jul 21
Changed: Oct 20
Last Checked: Oct 20 at 8:53PM
Displayed information is deemed reliable but is not guaranteed and should be independently verified. All listing content including descriptions, pricing, images are the copyrighted material of Full Spectrum Properties, Inc.

Ask AI about this property
Review the available facts, identify missing information and prepare questions for the agent.
Investment Insights
Based on property information with market context.
This residential income property offers 1,040 square feet of interior space and was constructed in 2020. Interior features include central air, ceiling fans, a dishwasher, free-standing gas range, refrigerator, microwave, gas water heater, kitchen island, and laminate countertops. A covered exterior area adds to the property’s usable features.
The property is located at 63 Redwing Drive in Santa Rosa, Sonoma County. Access is provided from Hwy 12 through the park, continuing right toward Redwing.
The property is located at 63 Redwing Drive in Santa Rosa, Sonoma County. Access is provided from Hwy 12 through the park, continuing right toward Redwing.
Key Highlights
- 1,040 square feet of interior space
- Constructed in 2020
- Central air and ceiling fans
Financial Insights
Estimated NOI and Cap Rate
NOI / Yr
$18,166
Cap Rate
7.42%
Suggested Prices Based on Cap Rates
Cap Rate 5%
$363,320
$363.3K
Cap Rate 7%
$259,514
$259.5K
Cap Rate 9%
$201,844
$201.8K
Market Conditions
NOI Build-Up for 1,040 SF
Gross rent
$34.7K $33.36/SF
− Vacancy
−$1.7K −$1.60/SF
EGI
$33.0K $31.76/SF
− OpEx
−$14.9K −$14.29/SF
NOI
$18.2K $17.47/SF
Area
Santa Rosa, CA
Vacancy
4.80%
Lease Rate
$33.36 /SF/Yr
Expense Ratio
45.00%
Simulate Cap Rate and NOI
Suggested Prices Based on Cap Rates
Cap Rate 5%
$363,320
Cap Rate 7%
$259,514
Cap Rate 9%
$201,844
Alternative Uses
Best Use
Apartment 5plus
$259.5K
$227.1K – $302.8K
NOI $18,166 @ 7.0% cap · market cap 7.42%
Second Best
—
—
no second resolved use
Theoretical Best
Multifamily LT 5
$288.9K
$252.8K – $337.1K
NOI $20,226 @ 7.0% cap · market cap 8.26%
Zoning and permitted uses should be independently verified with authorities.
How Realmo checks its estimates
Property Analytics
Contact the owner directly
Get the owner's phone numbers and email
Open Analytics
Lease Details
Yes
Highway access
Location Intelligence
Trade Area within ½ mile
603
Businesses Nearby
Explore this area
Business Placement
Demographics for 95409, CA
27,741
Population
12,499
Households
2.2
Avg Household Size
53
Median Age
50%
College-Educated
95%
High-School Grad
35.0 sq mi
ZIP Area
793
Density / Sq Mi
$105,736
Median Household Income
$59,003
Median Earnings
$2,346
Median Rent
$807,800
Median Home Value
Check the figures for this property
Cap Rate, Value Estimation, Potential NOI and more
View Realmo Analytics




Frequently Asked Questions
What type of property is this?
Residential income property - Built in 2020 with a covered exterior area and a kitchen equipped for everyday residential use.
Where is this residential income property located?
The property is located at 63 Redwing Drive Santa Rosa, CA.
What is the asking price?
The asking price for this property is $244,900.
What are key features of this property?
This property features: 1,040 square feet of interior space; Constructed in 2020; Central air and ceiling fans


