Adjacent Historic Office
For Sale
Contact for pricing
429 Walker Street, Augusta, GA 30901
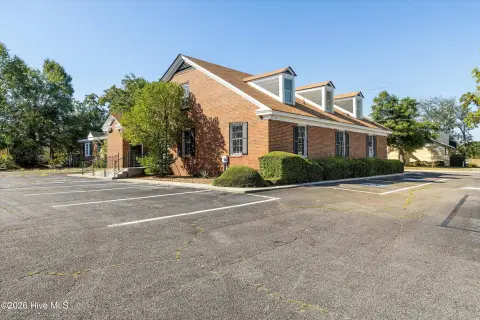
Two fully leased historic office buildings with multiple long-term tenants and recent renovations.
Property Size5,472 SF
Price / SF$167.21
Days on Market97
Property Features for 429 Walker Street
General Information
Standard status
Active
Size
5,472 SF
Class
B
Property subtype
Office
Zoning
B-2
Occupancy
100%
Net Operating Income
$64,218
Additional Details
Cap Rate
10.65%
Highway Access
Yes
Building Details
Year Built
1896
Year Renovated
2024
Buildings
2
Stories
2
Units
2
Tenancy
Multi
Listing Agency:
Sherman & Hemstreet Real Estate Company
Listed By:
Joe Edge · License #GA 282262
(706) 288-1077
Source:
Crexi
Added: Jul 6
Changed: Aug 28
Last Checked: Oct 9 at 4:33PM
Displayed information is deemed reliable but is not guaranteed and should be independently verified. All listing content including descriptions, pricing, images are the copyrighted material of Sherman & Hemstreet Real Estate Company
Investment Insights
Based on property information with market context.
This offering includes two adjacent historic office buildings. 431 Walker Street features a renovated basement with four private office suites and additional restroom facilities, plus a main floor with private offices, reception and waiting area, and shared kitchenette and restrooms. The second floor offers two large offices, with access to the attic and HVAC equipment. 429 Walker Street has multiple historic renovations and is set up for modern office use, including a daylight basement with five private offices, a storage room, and a common hallway providing access to a rear loading ramp. The main floor is occupied by a long-established law firm, with access to a shared conference room, while the second and third floors and a small portion of the first floor are leased to another long-term law firm.
Located in downtown Augusta within established professional and government office districts, 429 Walker Street is within walking distance of the Richmond County Judicial Center, the Federal Justice Center, and the Augusta Municipal Building, along with numerous law firms and professional offices.
Collectively, the buildings present stable tenancy backed by long-term occupants and updated improvements, while maintaining historic architectural character.
Located in downtown Augusta within established professional and government office districts, 429 Walker Street is within walking distance of the Richmond County Judicial Center, the Federal Justice Center, and the Augusta Municipal Building, along with numerous law firms and professional offices.
Collectively, the buildings present stable tenancy backed by long-term occupants and updated improvements, while maintaining historic architectural character.
Key Highlights
- Two adjacent historic downtown Augusta office buildings, both fully leased to multiple long‑term tenants
- 431 Walker Street (3,905 SF) renovated in 2024 with a complete remodel of basement office suites
- 431 Walker Street features main‑floor private offices plus reception/waiting, shared kitchenette, and shared restrooms for 1st/2nd floors
Financial Insights
Estimated NOI and Cap Rate
NOI / Yr
$83,722
Cap Rate
9.15%
Suggested Prices Based on Cap Rates
Cap Rate 5%
$1,674,440
$1.7M
Cap Rate 7%
$1,196,029
$1.2M
Cap Rate 9%
$930,244
$930.2K
Market Conditions
NOI Build-Up for 5,472 SF
Gross rent
$131.3K $24.00/SF
− Vacancy
−$19.7K −$3.60/SF
EGI
$111.6K $20.40/SF
− OpEx
−$27.9K −$5.10/SF
NOI
$83.7K $15.30/SF
Area
Augusta, GA
Vacancy
15.00%
Lease Rate
$24.00 /SF/Yr
Expense Ratio
25.00%
Simulate Cap Rate and NOI
Suggested Prices Based on Cap Rates
Cap Rate 5%
$1,674,440
Cap Rate 7%
$1,196,029
Cap Rate 9%
$930,244
Alternative Uses
Best Use
Office B
$1.20M
$1.05M – $1.40M
NOI $83,722 @ 7.0% cap · market cap 9.15%
Second Best
—
—
no second resolved use
Theoretical Best
Office A
$1.73M
$1.51M – $2.02M
NOI $120,903 @ 7.0% cap · market cap 13.21%
Zoning and permitted uses should be independently verified with authorities.
Property Analytics
Unlock full access to Insights
Subscribe to Realmo Intelligence
Open Analytics
Current Use
Lease Details
Multi-tenant
Tenancy
Yes
Highway access
Location Intelligence
Trade Area within ½ mile
609
Businesses Nearby
Explore this area
Business Placement
Demographics for 30901, GA
15,978
Population
8,848
Households
1.8
Avg Household Size
38
Median Age
13%
College-Educated
76%
High-School Grad
17.6 sq mi
ZIP Area
908
Density / Sq Mi
$23,019
Median Household Income
$24,349
Median Earnings
$805
Median Rent
$92,200
Median Home Value
Check the figures for this property
Cap Rate, Value Estimation, Potential NOI and more
View Realmo Analytics
Market
Vacancy Rate% for Office in South region

Questions? Ask Rey
Realmo’s AI knows this listing — price, zoning, demand, history. Ask anything.



Frequently Asked Questions
What type of property is this?
Office building - Two fully leased historic office buildings with multiple long-term tenants and recent renovations.
Where is this office building located?
The property is located at 429 Walker Street Augusta, GA.
What is the asking price?
The asking price for this property is $915,000.
What are key features of this property?
This property features: Two adjacent historic downtown Augusta office buildings, both fully leased to multiple long‑term tenants; 431 Walker Street (3,905 SF) renovated in 2024 with a complete remodel of basement office suites; 431 Walker Street features main‑floor private offices plus reception/waiting, shared kitchenette, and shared restrooms for 1st/2nd floors


