Flex Building with Garage Door
For Sale
Contact for pricing
417 E Hill Ave, Valdosta, GA 31601
Versatile flex and office layout with rear garage door access, designed for service operations and customer-facing functions.
Property Size5,750 SF
Lot Size0.61 Acres
Price / SF$52.16
Days on Market110
Property Features for 417 E Hill Ave
General Information
Standard status
Active
Size
5,750 SF
Total Parking Spaces
10
Lot size
0.61 Acres
Property subtype
Office
Zoning
CH
Site & Location
Traffic Count
11,000 vehicles/day
Highway Access
Yes
Warehouse & Industrial
Drive-In Doors
1
Heavy Power
Yes
Building Details
Year Built
1984
Listing Agency:
Mercer Hughes Real Estate Group Inc
Listed By:
Larry Mercer · License #GA
(229) 292-6456
Source:
Crexi
Added: Jun 19
Changed: Oct 1
Last Checked: Oct 5 at 7:03PM
Displayed information is deemed reliable but is not guaranteed and should be independently verified. All listing content including descriptions, pricing, images are the copyrighted material of Mercer Hughes Real Estate Group Inc
Investment Insights
Based on property information with market context.
This freestanding flex building offers approximately 5,750 square feet on a 0.61-acre lot fronting US Hwy 84 (Hill Ave). The front portion measures roughly 50 by 32 and includes an office/reception counter, a large open area suitable for display or other uses, a public bath, a private bath, an 8 by 12 storage room, and a 12 by 15 break room. The rear portion is about 50 by 88 and provides ample workspace for operational needs, along with a garage door for service vehicle entry.
The property is supported by a dedicated electrical setup, including three separate breaker boxes, with 220V 3-phase 400 amp power plus two additional 220V breaker boxes. Paved parking is available for 10 vehicles. The site benefits from high visibility along US Hwy 84, with an estimated traffic count of approximately 11,000 vehicles per day.
Currently used as an air conditioning and heating service company, the configuration supports a customer-facing front with dedicated amenities and a service/production-style workspace at the rear. With rear access for vehicles and substantial power capacity for equipment, the building may fit HVAC contractors or other light-service users seeking a functional office-work area arrangement.
The property is supported by a dedicated electrical setup, including three separate breaker boxes, with 220V 3-phase 400 amp power plus two additional 220V breaker boxes. Paved parking is available for 10 vehicles. The site benefits from high visibility along US Hwy 84, with an estimated traffic count of approximately 11,000 vehicles per day.
Currently used as an air conditioning and heating service company, the configuration supports a customer-facing front with dedicated amenities and a service/production-style workspace at the rear. With rear access for vehicles and substantial power capacity for equipment, the building may fit HVAC contractors or other light-service users seeking a functional office-work area arrangement.
Key Highlights
- 5,750 SF building on a 0.61‑acre lot fronting US Hwy 84 (Hill Ave)
- Front section includes office/reception counter, open display area, public bath, private bath, 8' x 12' storage, and a 12' x 15' break room
- Rear includes a 50' x 88 open work space with rear garage door access for service vehicle entry
Financial Insights
Estimated NOI and Cap Rate
NOI / Yr
$25,913
Cap Rate
8.64%
Suggested Prices Based on Cap Rates
Cap Rate 5%
$518,260
$518.3K
Cap Rate 7%
$370,186
$370.2K
Cap Rate 9%
$287,922
$287.9K
Market Conditions
NOI Build-Up for 5,750 SF
Gross rent
$40.0K $6.96/SF
− Vacancy
−$3.0K −$0.52/SF
EGI
$37.0K $6.44/SF
− OpEx
−$11.1K −$1.93/SF
NOI
$25.9K $4.51/SF
Area
Lowndes County, GA
Vacancy
7.50%
Lease Rate
$6.96 /SF/Yr
Expense Ratio
30.00%
Simulate Cap Rate and NOI
Suggested Prices Based on Cap Rates
Cap Rate 5%
$518,260
Cap Rate 7%
$370,186
Cap Rate 9%
$287,922
Alternative Uses
Best Use
Office B
$634.3K
$555.0K – $740.0K
NOI $44,402 @ 7.0% cap · market cap 14.81%
Second Best
Flex RnD
$439.7K
$384.7K – $513.0K
NOI $30,778 @ 7.0% cap · market cap 10.26%
Theoretical Best
Office A
$872.9K
$763.8K – $1.02M
NOI $61,106 @ 7.0% cap · market cap 20.38%
Zoning and permitted uses should be independently verified with authorities.
Property Analytics
Unlock full access to Insights
Subscribe to Realmo Intelligence
Open Analytics
Current Use
Lease Details
1
Drive-in doors
11,000 VPD
Traffic count
Yes
Heavy power
Yes
Highway access
Location Intelligence
Trade Area within ½ mile
1,116
Businesses Nearby
Balanced
Demand for This Use
Explore this area
Business Placement
Demographics for 31601, GA
32,331
Population
14,345
Households
2.3
Avg Household Size
33
Median Age
15%
College-Educated
82%
High-School Grad
159.0 sq mi
ZIP Area
203
Density / Sq Mi
$34,846
Median Household Income
$28,878
Median Earnings
$872
Median Rent
$112,600
Median Home Value
Check the figures for this property
Cap Rate, Value Estimation, Potential NOI and more
View Realmo Analytics
Market
Vacancy Rate% for Office in South region

Questions? Ask Rey
Realmo’s AI knows this listing — price, zoning, demand, history. Ask anything.
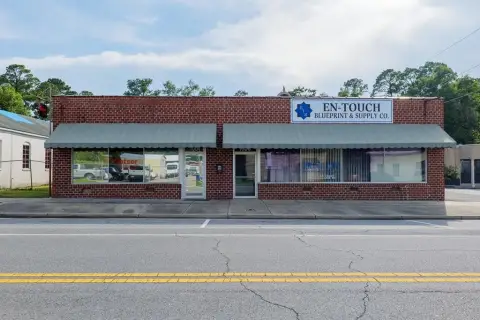
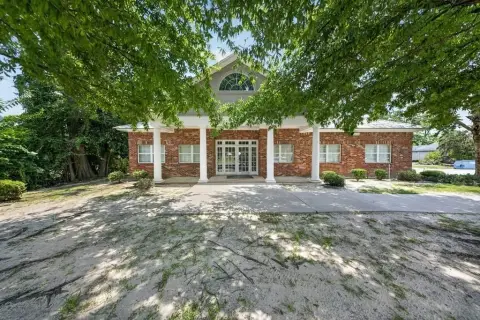
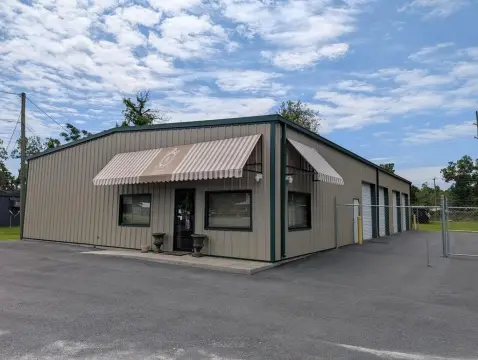
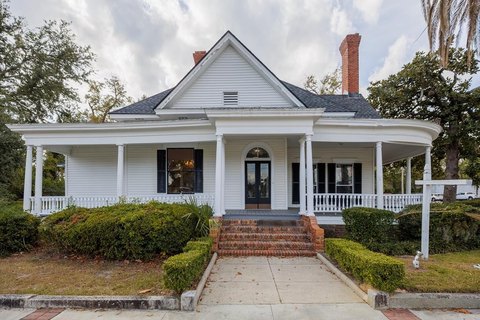
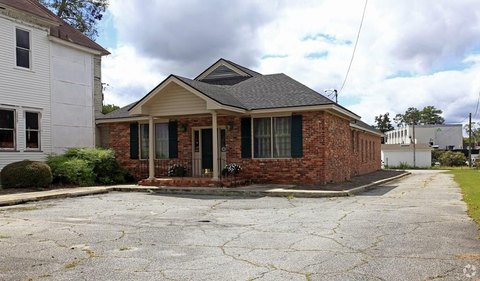
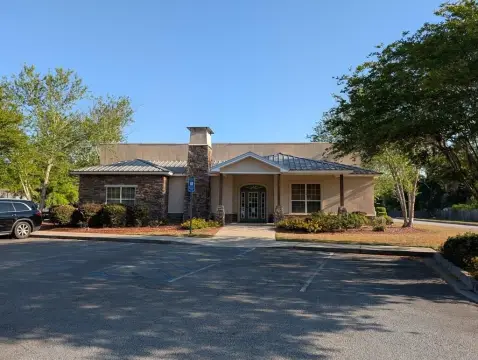
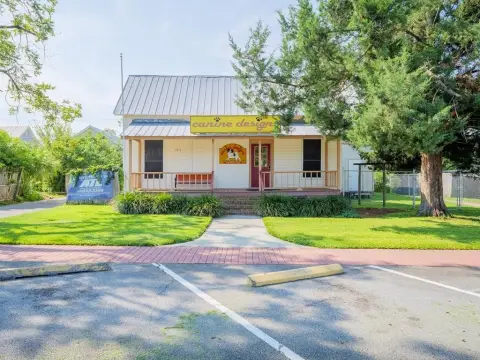
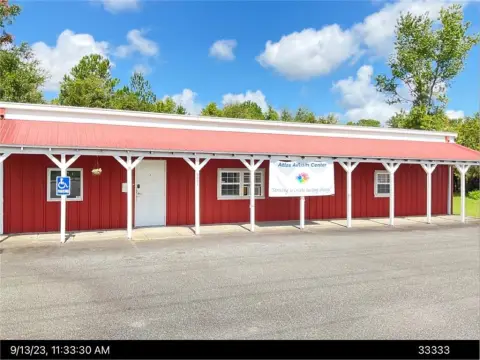
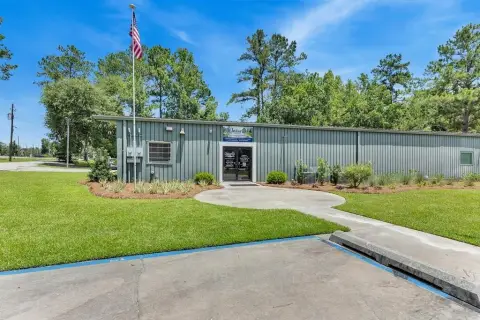
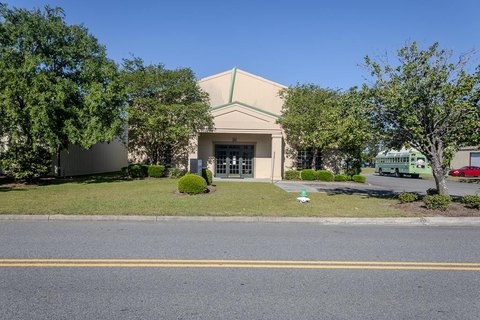
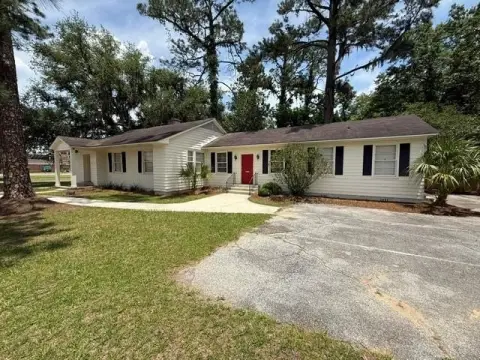
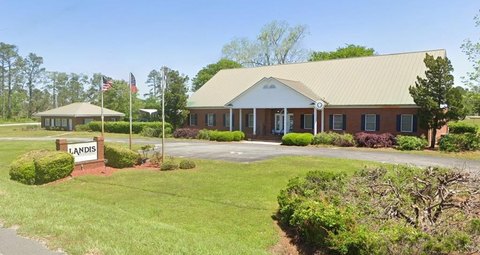
Similar Off Market Nearby
- Lavern's Catering & Creative Designz — 929 Bunche Dr, Valdosta, GA 31601
- Birdies Events & Catering — 206 n patterson st, valdosta, ga 31601
- NickAMillion — 100 N Patterson St, Valdosta, GA 31601
Frequently Asked Questions
What type of property is this?
Flex space - Versatile flex and office layout with rear garage door access, designed for service operations and customer-facing functions.
Where is this flex space located?
The property is located at 417 E Hill Ave Valdosta, GA.
What is the asking price?
The asking price for this property is $299,900.
What are key features of this property?
This property features: 5,750 SF building on a 0.61‑acre lot fronting US Hwy 84 (Hill Ave); Front section includes office/reception counter, open display area, public bath, private bath, 8' x 12' storage, and a 12' x 15' break room; Rear includes a 50' x 88 open work space with rear garage door access for service vehicle entry



