Residential Income Property with Rooftop
For Sale
$699,000
22093 MIDMOORE DRIVE, Ashburn, VA 20148
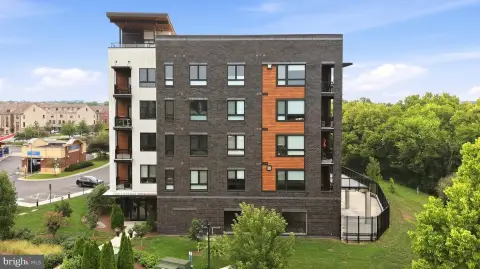
Three-bedroom residence with contemporary finishes, private outdoor space, and access to shared community amenities.
Property Size2,500 SF
Price / SF$279.60
Days on Market80
Property Features for 22093 MIDMOORE DRIVE
General Information
Standard status
Active
Size
2,500 SF
Property subtype
Unit/Flat/Apartment
Building Details
Building Size
2,500 SF
Year Built
2026
Listing Agency:
Toll Brothers Real Estate Inc.
Listed By:
Carla C Brown
(703) 623-3462
Source:
Kerishull
Added: Jul 23
Changed: Oct 6
Last Checked: Oct 10 at 1:12AM
Displayed information is deemed reliable but is not guaranteed and should be independently verified. All listing content including descriptions, pricing, images are the copyrighted material of Toll Brothers Real Estate Inc.
Investment Insights
Based on property information with market context.
This 2026-built residential income property offers approximately 2,500 square feet with three bedrooms, two-and-a-half bathrooms, and a one-car garage. The interior includes an open oak staircase, wide-plank luxury vinyl flooring, and a kitchen appointed with wood-tone cabinetry, quartz surfaces, bronze hardware, and KitchenAid stainless steel appliances. The upper-level primary suite features a tray ceiling, walk-in closet, dual-sink vanity, oversized shower, and bay-window bump-out. A dedicated laundry room includes Whirlpool front-load appliances, cabinetry, and a utility sink with quartz counters.
Outdoor space includes a north-facing rooftop terrace with neighborhood views. Community amenities include a resort-style pool, fitness center, clubhouse, and playground. The property is located near Ashburn Metro Station at 22093 Midmoore Drive in Ashburn, Virginia.
Outdoor space includes a north-facing rooftop terrace with neighborhood views. Community amenities include a resort-style pool, fitness center, clubhouse, and playground. The property is located near Ashburn Metro Station at 22093 Midmoore Drive in Ashburn, Virginia.
Key Highlights
- 2026 construction with approximately 2,500 square feet
- Three bedrooms, 2.5 bathrooms, and a one‑car garage
- North‑facing rooftop terrace with neighborhood views
Financial Insights
Estimated NOI and Cap Rate
NOI / Yr
$38,990
Cap Rate
5.58%
Suggested Prices Based on Cap Rates
Cap Rate 5%
$779,800
$779.8K
Cap Rate 7%
$557,000
$557.0K
Cap Rate 9%
$433,222
$433.2K
Market Conditions
NOI Build-Up for 2,500 SF
Gross rent
$75.9K $30.36/SF
− Vacancy
−$5.0K −$2.00/SF
EGI
$70.9K $28.36/SF
− OpEx
−$31.9K −$12.76/SF
NOI
$39.0K $15.60/SF
Area
Loudoun County, VA
Vacancy
6.60%
Lease Rate
$30.36 /SF/Yr
Expense Ratio
45.00%
Simulate Cap Rate and NOI
Suggested Prices Based on Cap Rates
Cap Rate 5%
$779,800
Cap Rate 7%
$557,000
Cap Rate 9%
$433,222
Alternative Uses
Best Use
Apartment 5plus
$557.0K
$487.4K – $649.8K
NOI $38,990 @ 7.0% cap · market cap 5.58%
Second Best
—
—
no second resolved use
Theoretical Best
Specialty Retail
$783.5K
$685.6K – $914.1K
NOI $54,844 @ 7.0% cap · market cap 7.85%
Zoning and permitted uses should be independently verified with authorities.
Property Analytics
Current Use
Location Intelligence
Trade Area within ½ mile
540
Businesses Nearby
Explore this area
Business Placement
Demographics for 20148, VA
61,793
Population
20,413
Households
3
Avg Household Size
34
Median Age
77%
College-Educated
97%
High-School Grad
19.4 sq mi
ZIP Area
3,185
Density / Sq Mi
$233,502
Median Household Income
$119,027
Median Earnings
$2,647
Median Rent
$843,800
Median Home Value

Questions? Ask Rey
Realmo’s AI knows this listing — price, zoning, demand, history. Ask anything.


Frequently Asked Questions
What type of property is this?
Residential income property - Three-bedroom residence with contemporary finishes, private outdoor space, and access to shared community amenities.
Where is this residential income property located?
The property is located at 22093 MIDMOORE DRIVE Ashburn, VA.
What is the asking price?
The asking price for this property is $699,000.
What are key features of this property?
This property features: 2026 construction with approximately 2,500 square feet; Three bedrooms, 2.5 bathrooms, and a one‑car garage; North‑facing rooftop terrace with neighborhood views


