Vacant Retail
For Sale
$285,000
218 E Jackson St., Harlingen, TX 78550
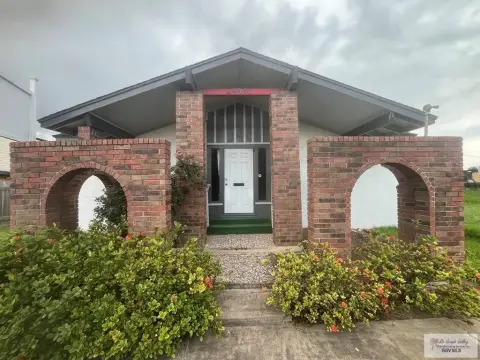
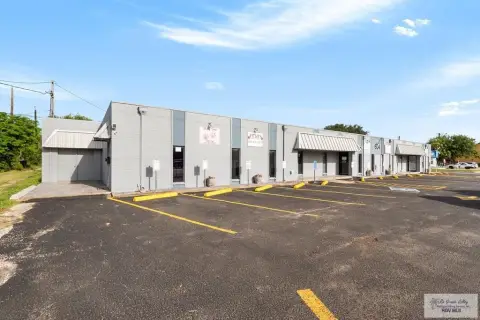
Vacant commercial storefront with an existing retail-oriented layout in Harlingen.
Property Size2,250 SF
Price / SF$126.67
Days on Market86
Property Features for 218 E Jackson St.
General Information
Standard status
Active
Size
2,250 SF
Building Details
Year Built
1937
Listing Agency:
Imperio Real Estate
Listed By:
Jorge Valdez
(956) 803-0341
Source:
Accessrealtyrgv
Added: Jul 20
Changed: Sep 13
Last Checked: Oct 7 at 3:41PM
Displayed information is deemed reliable but is not guaranteed and should be independently verified. All listing content including descriptions, pricing, images are the copyrighted material of Imperio Real Estate
Investment Insights
Based on property information with market context.
This vacant retail property includes an existing storefront configuration and was built in 1937. The space is positioned for a retail use and offers a defined commercial setting on E Jackson St. in Harlingen, Texas.
Key Highlights
- Vacant retail property
- Existing storefront configuration
- Built in 1937
Financial Insights
Estimated NOI and Cap Rate
NOI / Yr
$21,410
Cap Rate
7.51%
Suggested Prices Based on Cap Rates
Cap Rate 5%
$428,200
$428.2K
Cap Rate 7%
$305,857
$305.9K
Cap Rate 9%
$237,889
$237.9K
Market Conditions
NOI Build-Up for 2,250 SF
Gross rent
$32.4K $14.40/SF
− Vacancy
−$1.8K −$0.81/SF
EGI
$30.6K $13.59/SF
− OpEx
−$9.2K −$4.08/SF
NOI
$21.4K $9.52/SF
Area
Cameron County, TX
Vacancy
5.60%
Lease Rate
$14.40 /SF/Yr
Expense Ratio
30.00%
Simulate Cap Rate and NOI
Suggested Prices Based on Cap Rates
Cap Rate 5%
$428,200
Cap Rate 7%
$305,857
Cap Rate 9%
$237,889
Alternative Uses
Best Use
Retail
$305.9K
$267.6K – $356.8K
NOI $21,410 @ 7.0% cap · market cap 7.51%
Second Best
—
—
no second resolved use
Theoretical Best
Healthcare Medical
$387.4K
$339.0K – $452.0K
NOI $27,119 @ 7.0% cap · market cap 9.52%
Zoning and permitted uses should be independently verified with authorities.
How Realmo checks its estimates
Property Analytics
Unlock full access to Insights
Subscribe to Realmo Intelligence
Open Analytics
Current Use
Location Intelligence
Trade Area within ½ mile
1,490
Businesses Nearby
84k
Monthly Visits Nearby
Balanced
Demand for This Use
Explore this area
Business Placement
Foot Traffic Nearby
Shops & Services 60%
Dining 21%
Groceries 18%
Home Improvements & Furnishings 1%
La Michoacana Meat Market
Groceries
15,469 visits/mo
0.4 miles
Stars Drive-In
Dining
9,525 visits/mo
0.5 miles
Bank of America
Shops & Services
9,169 visits/mo
0.3 miles
Church's Chicken
Dining
8,133 visits/mo
0.5 miles
Family Dollar
Shops & Services
7,519 visits/mo
0.4 miles
Demographics for 78550, TX
56,038
Population
22,347
Households
2.5
Avg Household Size
35
Median Age
22%
College-Educated
77%
High-School Grad
94.2 sq mi
ZIP Area
595
Density / Sq Mi
$51,524
Median Household Income
$32,065
Median Earnings
$863
Median Rent
$120,500
Median Home Value
Check the figures for this property
Cap Rate, Value Estimation, Potential NOI and more
View Realmo Analytics
Market
Vacancy Rate% for Retail in South region

Questions? Ask Rey
Realmo’s AI knows this listing — price, zoning, demand, history. Ask anything.






Similar Off Market Nearby
- A Little Castle Flower Shop LLC — 1102 E Harrison Ave, Harlingen, TX 78550
- A Little Castle Flower Shop — 602 S F St Ste F, Harlingen, TX 78550
- Flowers By Selena — 1214 W Harrison Ave, Harlingen, TX 78550
- Laura's Flowers Shop — 402 W Van Buren Ave, Harlingen, TX 78550
- Yadis Innovations — 116 W Van Buren Ave, Harlingen, TX 78550
Frequently Asked Questions
What type of property is this?
Storefront property - Vacant commercial storefront with an existing retail-oriented layout in Harlingen.
Where is this storefront property located?
The property is located at 218 E Jackson St. Harlingen, TX.
What is the asking price?
The asking price for this property is $285,000.
What are key features of this property?
This property features: Vacant retail property; Existing storefront configuration; Built in 1937


