Renovated Mixed-Use
For Sale
$950,000
210-216 North Main Street, Anderson, SC 29621
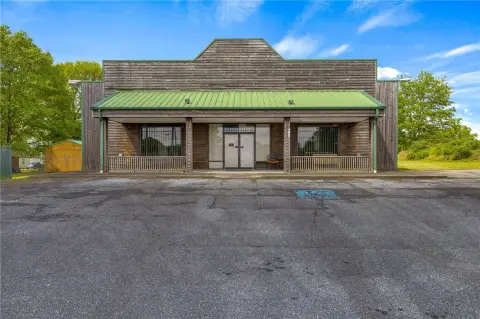
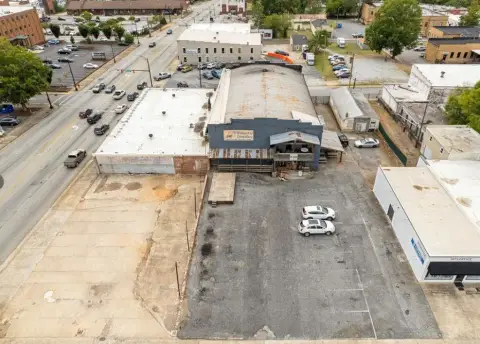
Downtown property combines two commercial spaces with two upstairs residential units.
Property Size4,800 SF
Price / SF$197.92
Days on Market48
Property Features for 210-216 North Main Street
General Information
Standard status
Active
Size
4,800 SF
Property subtype
Special Purpose
Units
Unit Mix
1 x 2BR/2BA, 1 x 1BR/1.5BA
Multifamily Units
2
Additional Details
Cap Rate
6.6%
Sprinkler System
Yes
Building Details
Building Size
4,800 SF
Year Renovated
2019
Buildings
1
Stories
2
Tenancy
Multi
Listed By:
John Wright Jr., CCIM
(864) 934-5261
Source:
Mccoywright
Added: Aug 20
Changed: Sep 14
Last Checked: Oct 5 at 4:57PM
Displayed information is deemed reliable but is not guaranteed and should be independently verified. All listing content including descriptions, pricing, images are the copyrighted material of John Wright Jr., CCIM
Investment Insights
Based on property information with market context.
This 4,800-square-foot mixed-use building at 210-216 North Main Street in Anderson, South Carolina, was renovated in 2019. The first floor contains two commercial spaces, while the second floor includes two residential units configured as 2/2 and 1/1.5 apartments. The building is fully sprinklered.
Positioned in downtown Anderson, the property brings commercial and residential components together within one building. The reported 6.6% cap rate provides an additional investment metric for evaluation.
Positioned in downtown Anderson, the property brings commercial and residential components together within one building. The reported 6.6% cap rate provides an additional investment metric for evaluation.
Key Highlights
- 4,800 SF mixed‑use building in downtown Anderson
- Renovated in 2019
- Two commercial spaces on the first floor
Financial Insights
Estimated NOI and Cap Rate
NOI / Yr
$59,940
Cap Rate
6.31%
Suggested Prices Based on Cap Rates
Cap Rate 5%
$1,198,800
$1.2M
Cap Rate 7%
$856,286
$856.3K
Cap Rate 9%
$666,000
$666.0K
Market Conditions
NOI Build-Up for 4,800 SF
Gross rent
$103.7K $21.60/SF
− Vacancy
−$7.8K −$1.62/SF
EGI
$95.9K $19.98/SF
− OpEx
−$36.0K −$7.49/SF
NOI
$59.9K $12.49/SF
Area
Anderson County, SC
Vacancy
7.50%
Lease Rate
$21.60 /SF/Yr
Expense Ratio
37.50%
Simulate Cap Rate and NOI
Suggested Prices Based on Cap Rates
Cap Rate 5%
$1,198,800
Cap Rate 7%
$856,286
Cap Rate 9%
$666,000
Alternative Uses
Best Use
Apartment 5plus
$45.67M
$39.96M – $53.28M
NOI $3,197,010 @ 7.0% cap · market cap 336.53%
Second Best
Retail
$1.39M
$1.21M – $1.62M
NOI $97,171 @ 7.0% cap · market cap 10.23%
Theoretical Best
Multifamily LT 5
$51.97M
$45.47M – $60.63M
NOI $3,637,932 @ 7.0% cap · market cap 382.94%
Zoning and permitted uses should be independently verified with authorities.
Property Analytics
Current Use
Lease Details
2
Residential units
Multi-tenant
Tenancy
Yes
Sprinkler system
Location Intelligence
Trade Area within ½ mile
806
Businesses Nearby
Explore this area
Business Placement
Demographics for 29621, SC
44,601
Population
18,960
Households
2.4
Avg Household Size
41
Median Age
39%
College-Educated
94%
High-School Grad
87.1 sq mi
ZIP Area
512
Density / Sq Mi
$71,446
Median Household Income
$41,773
Median Earnings
$1,023
Median Rent
$252,700
Median Home Value
Market
Vacancy Rate% for Multifamily in South region

Questions? Ask Rey
Realmo’s AI knows this listing — price, zoning, demand, history. Ask anything.







Frequently Asked Questions
What type of property is this?
Mixed-use property - Downtown property combines two commercial spaces with two upstairs residential units.
Where is this mixed-use property located?
The property is located at 210-216 North Main Street Anderson, SC.
What is the asking price?
The asking price for this property is $950,000.
What are key features of this property?
This property features: 4,800 SF mixed‑use building in downtown Anderson; Renovated in 2019; Two commercial spaces on the first floor



