Multifamily Property with Fenced
For Sale
$770,000
1907 S Railroad St, Nampa, ID 83712
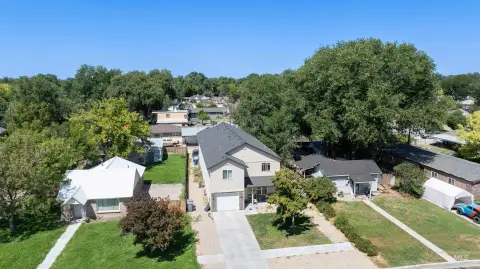
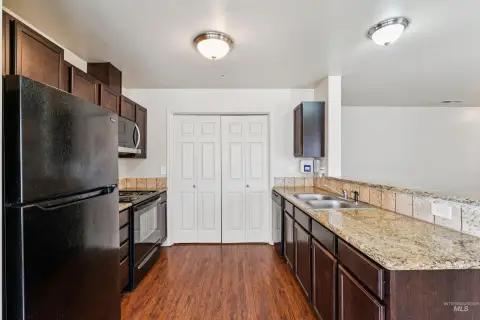
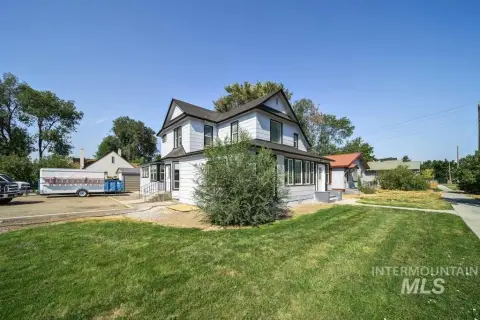
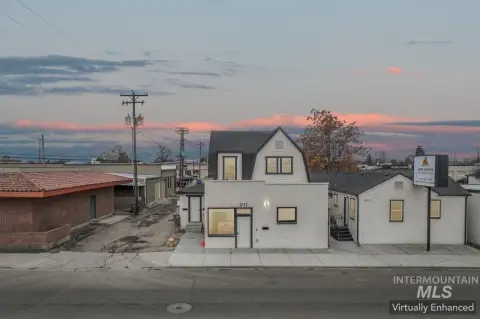
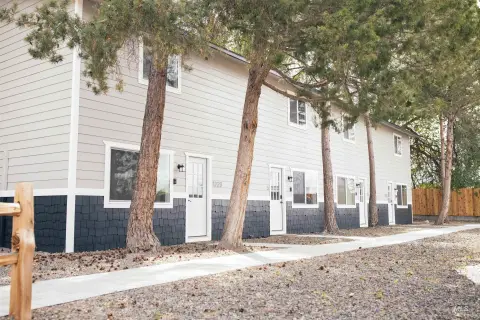
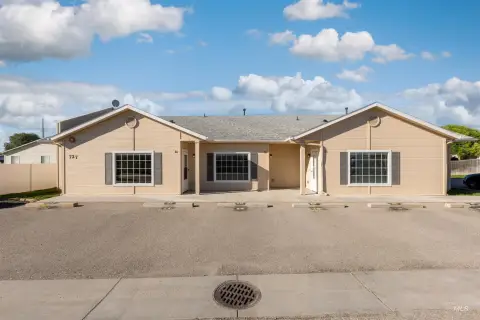
Large three-bedroom units offer fenced outdoor space and in-unit washer and dryer appliances.
Property Size4,716 SF
Days on Market156
Property Features for 1907 S Railroad St
General Information
Standard status
Active
Size
4,716 SF
Property subtype
Multi-Family
Additional Details
Highway Access
Yes
Amenities
fully fenced backyards
in-unit washer and dryer appliances
Building Details
Building Size
4,716 SF
Year Built
2004
Year Renovated
2024
Units
4
Listing Agency:
TOK Commercial
Listed By:
Moses Mukengezi · License #57246
(208) 914-3625
Source:
Commercialcafe
Added: May 14
Changed: Oct 10
Last Checked: Oct 16 at 5:37AM
Displayed information is deemed reliable but is not guaranteed and should be independently verified. All listing content including descriptions, pricing, images are the copyrighted material of TOK Commercial

Ask AI about this property
Review the available facts, identify missing information and prepare questions for the agent.
Investment Insights
Based on property information with market context.
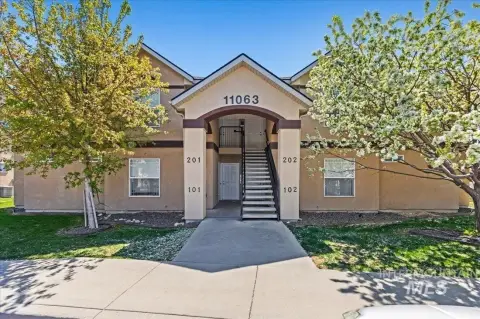
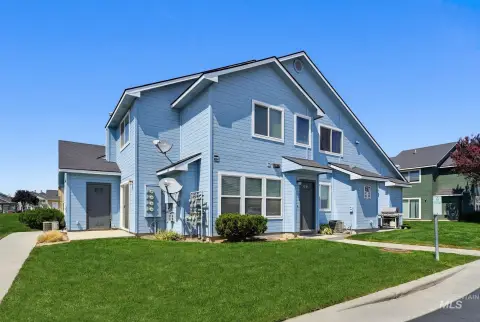
Built in 2004, this multifamily property offers large three-bedroom units configured for residential occupancy. Each unit includes a fully fenced backyard along with an in-unit washer and dryer. All units are leased month to month, with rent changes available upon 30 days’ notice; the latest increase took effect March 1, 2026.
The property is located at 907 S Railroad St in Nampa, near I-84 and downtown Nampa. Local amenities are also within convenient reach. The broader Boise metro recorded occupancy above 95%, while new construction starts were reported to be down more than 60% from peak levels.
The property is located at 907 S Railroad St in Nampa, near I-84 and downtown Nampa. Local amenities are also within convenient reach. The broader Boise metro recorded occupancy above 95%, while new construction starts were reported to be down more than 60% from peak levels.
Key Highlights
- Large three‑bedroom units
- Fully fenced backyard with each unit
- In‑unit washer and dryer appliances
Financial Insights
Estimated NOI and Cap Rate
NOI / Yr
$46,474
Cap Rate
6.04%
Suggested Prices Based on Cap Rates
Cap Rate 5%
$929,480
$929.5K
Cap Rate 7%
$663,914
$663.9K
Cap Rate 9%
$516,378
$516.4K
Market Conditions
NOI Build-Up for 4,716 SF
Gross rent
$89.4K $18.96/SF
− Vacancy
−$4.9K −$1.04/SF
EGI
$84.5K $17.92/SF
− OpEx
−$38.0K −$8.06/SF
NOI
$46.5K $9.85/SF
Area
Nampa, ID
Vacancy
5.50%
Lease Rate
$18.96 /SF/Yr
Expense Ratio
45.00%
Simulate Cap Rate and NOI
Suggested Prices Based on Cap Rates
Cap Rate 5%
$929,480
Cap Rate 7%
$663,914
Cap Rate 9%
$516,378
Alternative Uses
Best Use
Apartment 5plus
$663.9K
$580.9K – $774.6K
NOI $46,474 @ 7.0% cap · market cap 6.04%
Second Best
—
—
no second resolved use
Theoretical Best
Office A
$1.19M
$1.04M – $1.39M
NOI $83,507 @ 7.0% cap · market cap 10.85%
Zoning and permitted uses should be independently verified with authorities.
How Realmo checks its estimates
Property Analytics
Current Use
Lease Details
Yes
Highway access
Location Intelligence
Trade Area within ½ mile
612
Businesses Nearby
Explore this area
Business Placement
Demographics for 83712, ID
8,908
Population
4,606
Households
1.9
Avg Household Size
42
Median Age
62%
College-Educated
97%
High-School Grad
22.9 sq mi
ZIP Area
389
Density / Sq Mi
$105,764
Median Household Income
$56,280
Median Earnings
$1,368
Median Rent
$757,700
Median Home Value
Market
Vacancy Rate% for Multifamily in West region




Frequently Asked Questions
What type of property is this?
Multifamily property - Large three-bedroom units offer fenced outdoor space and in-unit washer and dryer appliances.
Where is this multifamily property located?
The property is located at 1907 S Railroad St Nampa, ID.
What is the asking price?
The asking price for this property is $770,000.
What are key features of this property?
This property features: Large three‑bedroom units; Fully fenced backyard with each unit; In‑unit washer and dryer appliances


