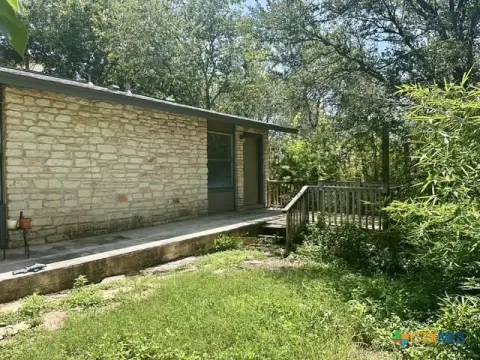
Masonry Office
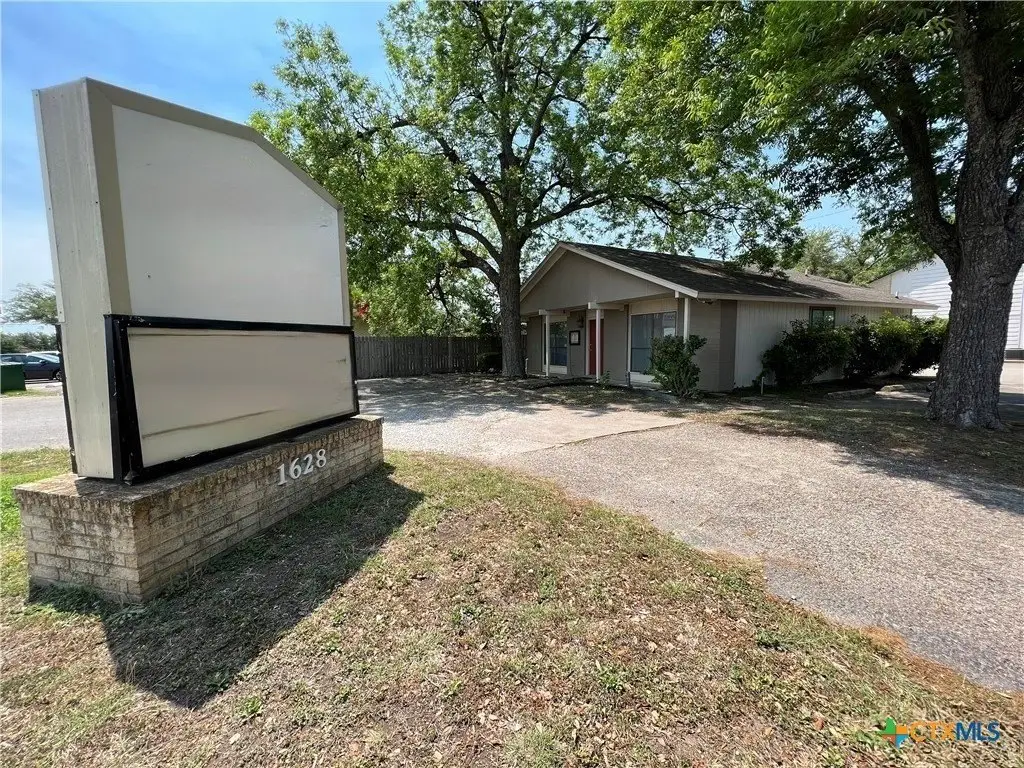
For Sale
$374,999
1628 Aquarena Springs Drive, San Marcos, TX 78666
CommercialSale, San Marcos, TX
Property Size1,122 SF
Lot Size0.12 Acres
Price / SF$334.22
Days on Market49
Property Features for 1628 Aquarena Springs Drive
General Information
Property type
Commercial Sale
Property subtype
Office
Zoning
Mixed
Parking features
Driveway
Lot features
City Lot, Less Than Quarter Acre
Elementary school district
San Marcos Cisd
Middle school district
San Marcos Cisd
High school district
San Marcos Cisd
Directions
from Austin exit Aquarena Springs drive and make a right. less than 100 yards property is on the left side of the street . from New Braunfles , exit Aquarena Springs and make a left, property is on the left side of the street
Standard status
Active
APN
R12359
Size
1,122 SF
Lot size
0.12 Acres
Taxes and HOA fees
Tax Year
2025
Tax Description
ABS 17-2 J M VERAMENDI SURVEY 0.119 AC GEO#90212115
Legal Description
ABS 17-2 J M VERAMENDI SURVEY 0.119 AC GEO#90212115
Utilities
Sewer type
Public Sewer
Water source
Public
Building Details
Year built
1983
Floors in Building
1
Flooring type
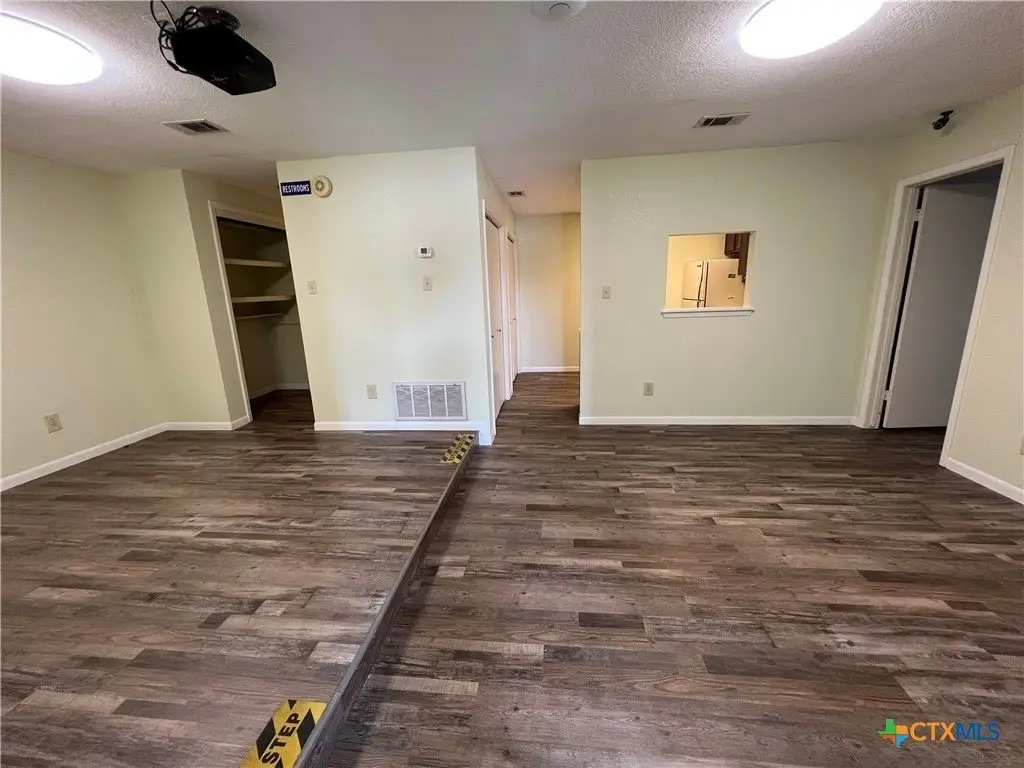
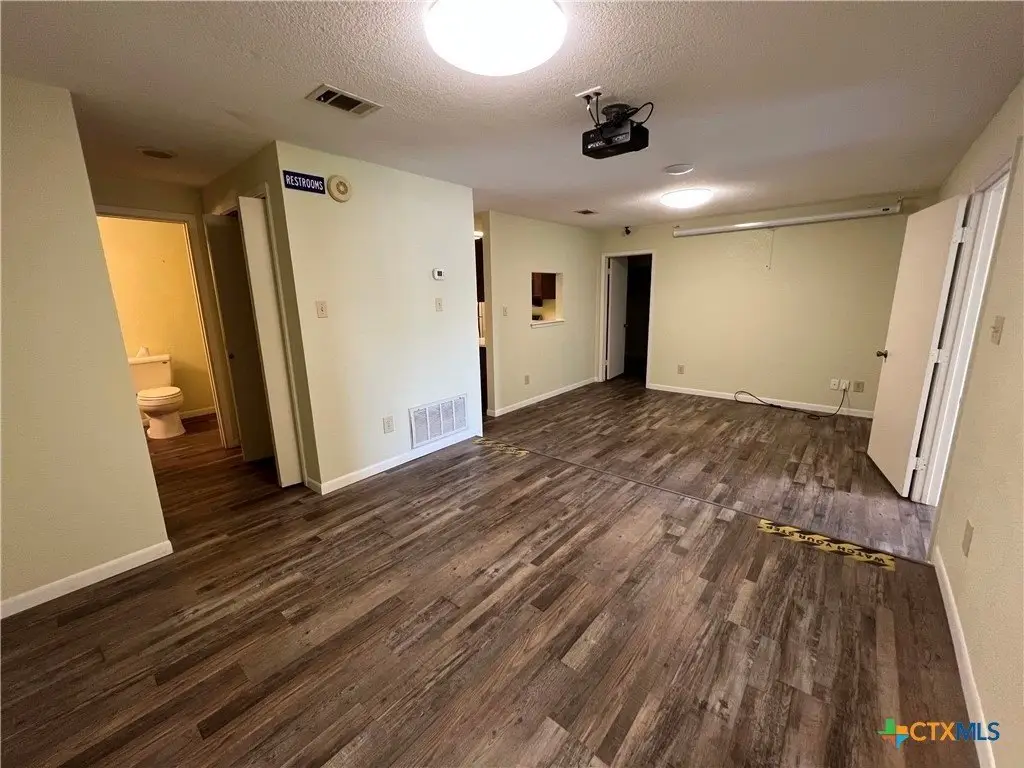
Wood, Vinyl
Building materials
Masonry
Listing Agency:
Hot Spots Locating
(512) 805-7768
Listed By:
Jason Sparks · License #0553210
(512) 964-2829
Added: Sep 2
Changed: Sep 15
Last Checked: Oct 20 at 3:06AM
MLS# 624278
Copyright © 2026 Central Texas Multiple Listing Service. All rights reserved. All information provided by the listing agent/broker is deemed reliable but is not guaranteed and should be independently verified.

Ask AI about this property
Review the available facts, identify missing information and prepare questions for the agent.
Investment Insights
Based on property information with market context.
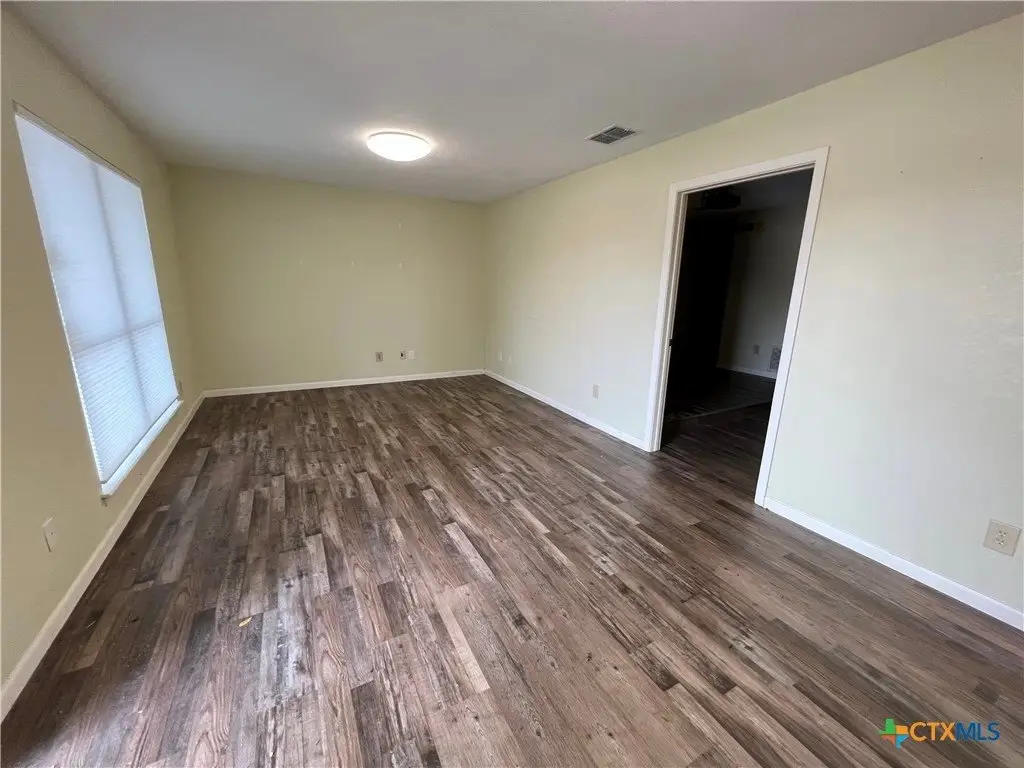
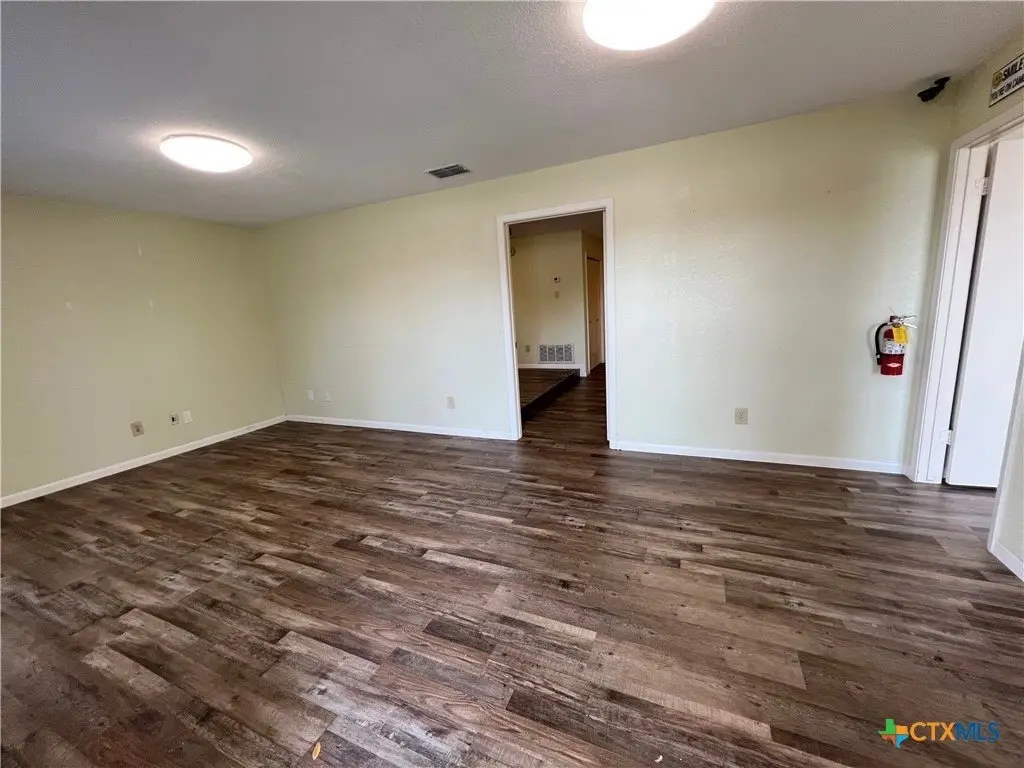
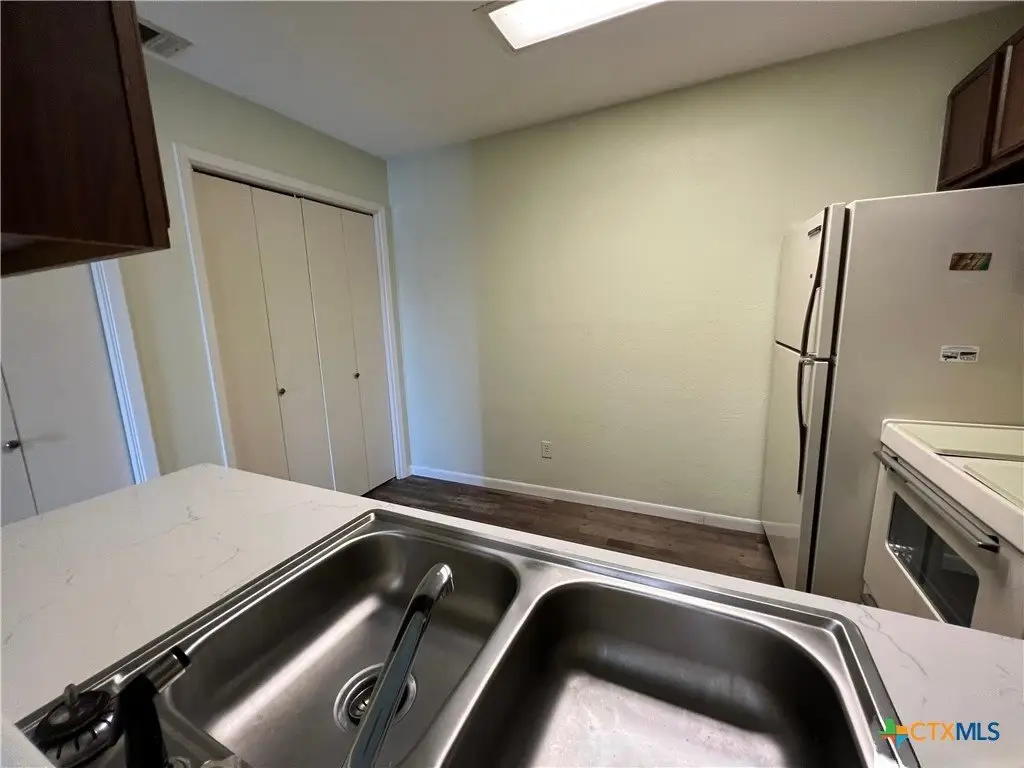
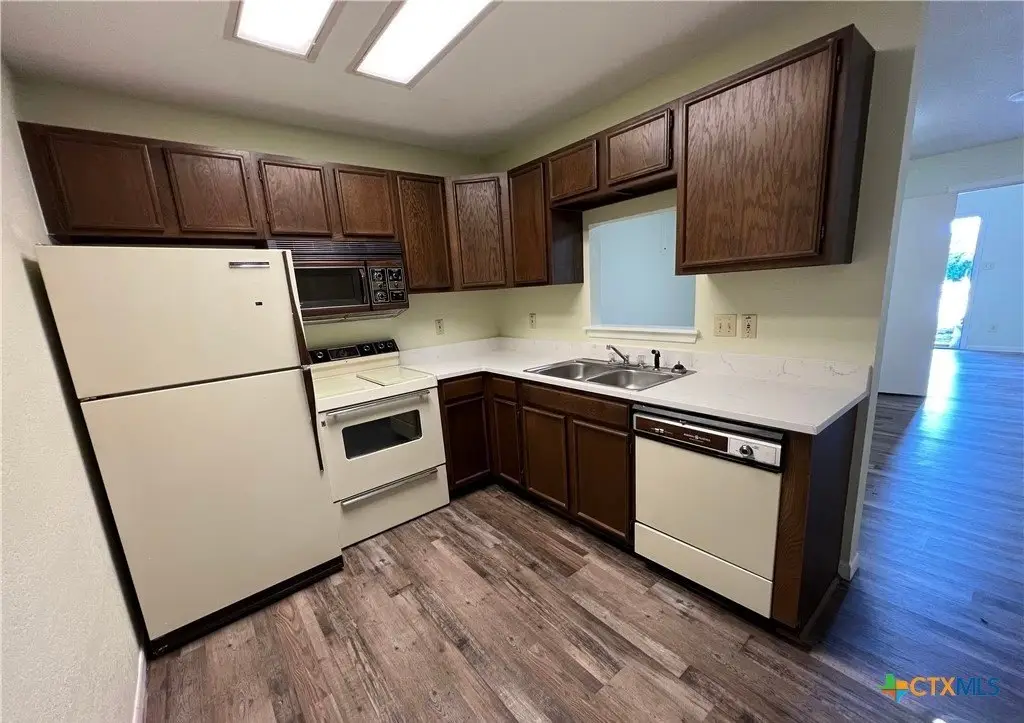
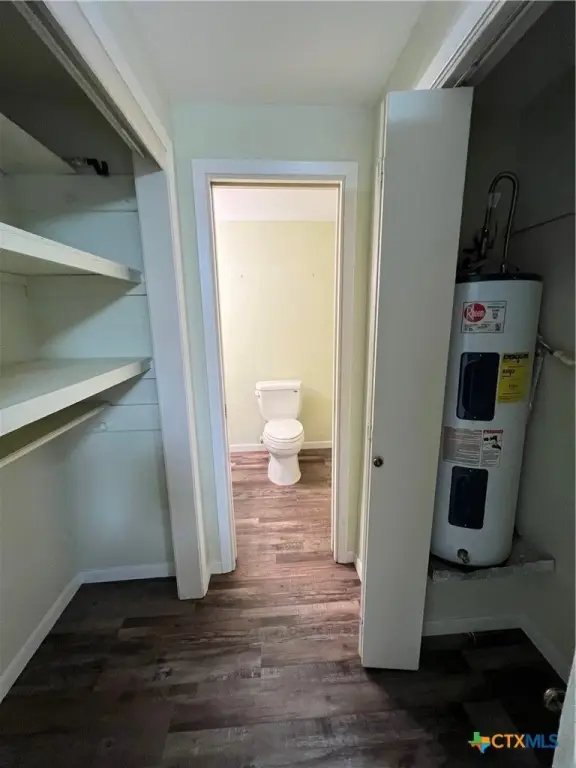
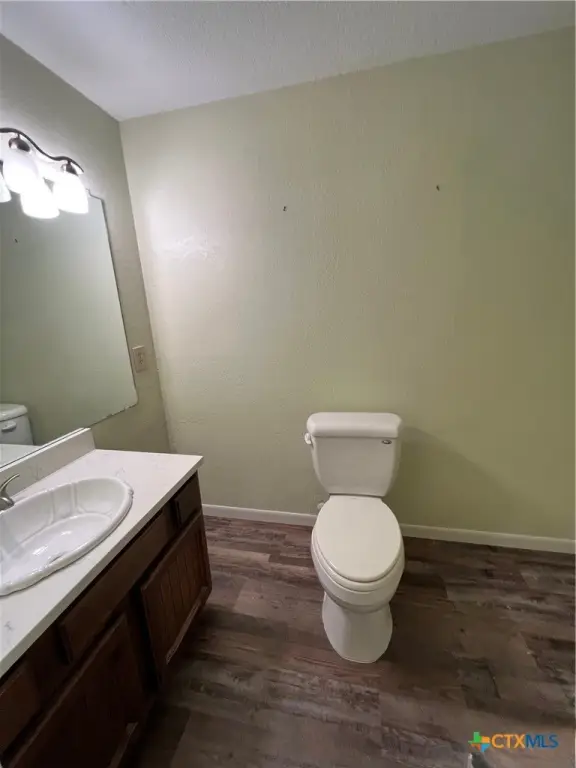
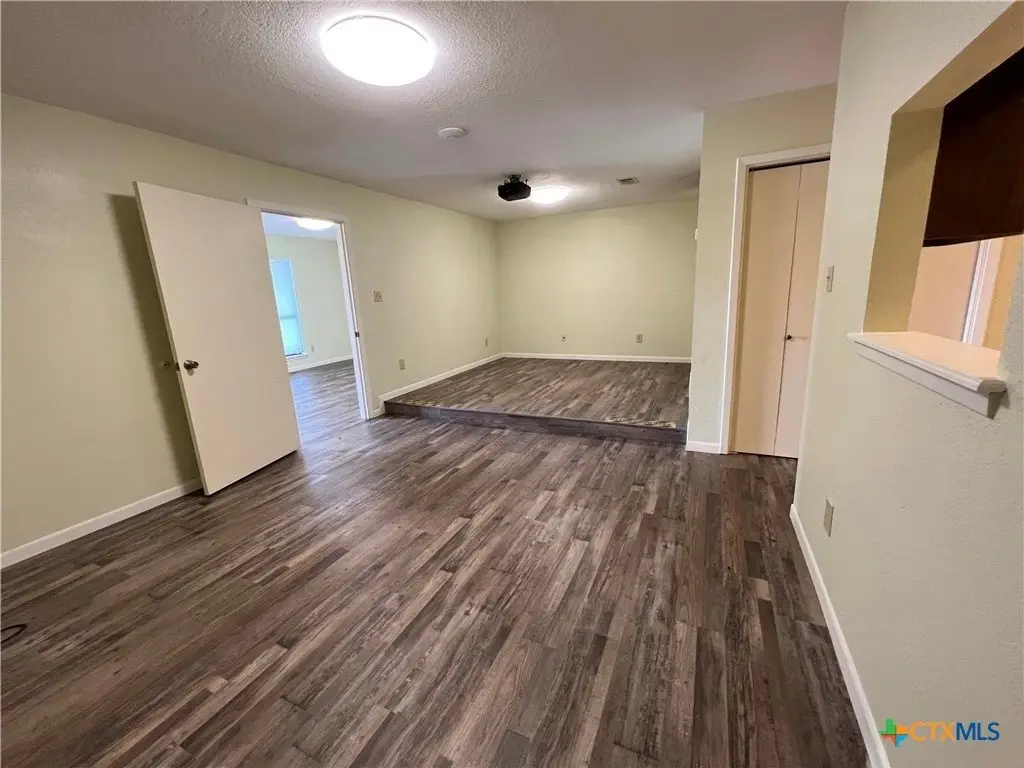
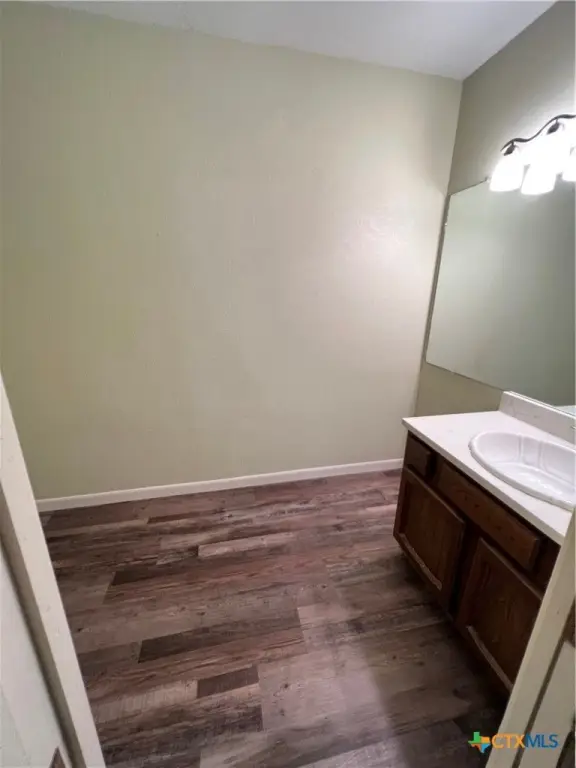
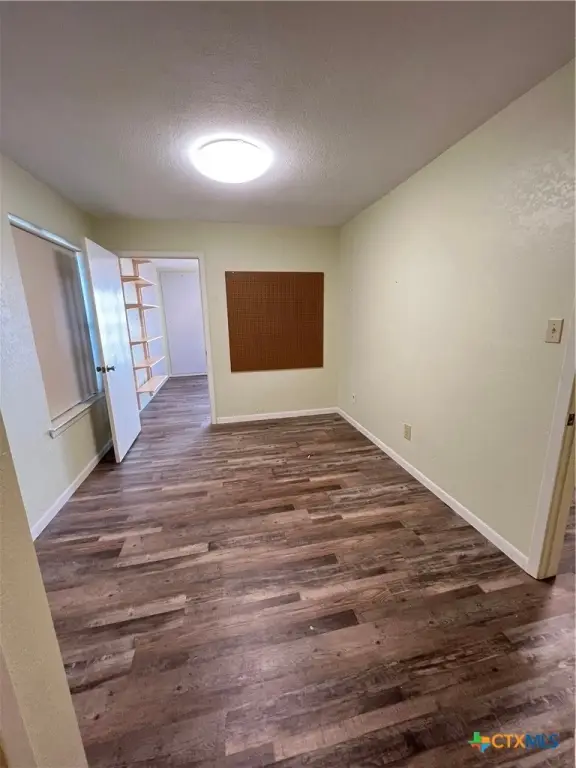
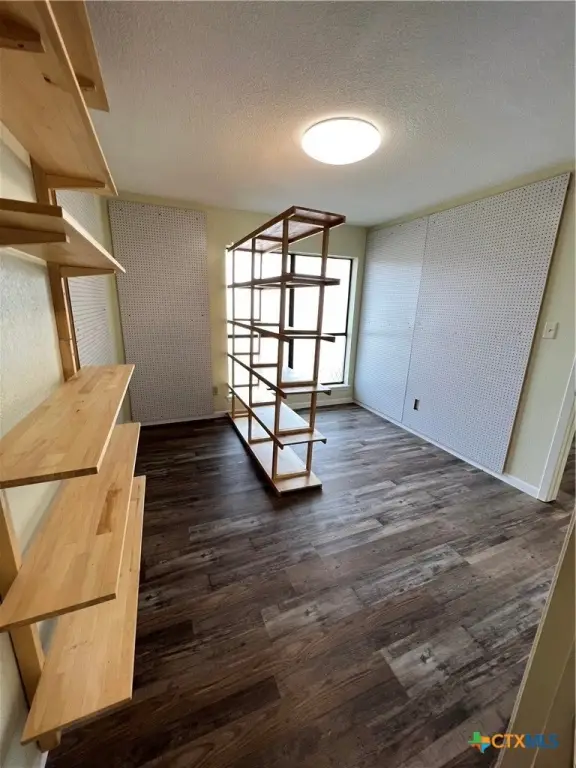
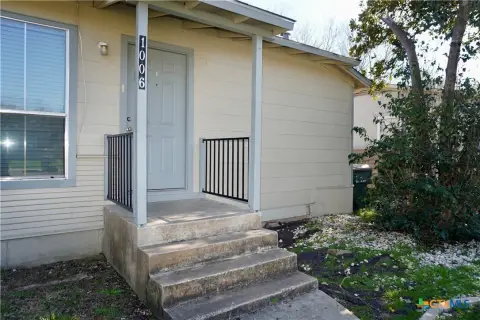
This 1,122-square-foot office building sits on a 0.119-acre parcel at 1628 Aquarena Springs Drive in San Marcos. Built in 1983, the masonry structure has a combination of vinyl and wood flooring and is currently configured for office use. Mixed zoning is identified for the property, with driveway parking available on site.
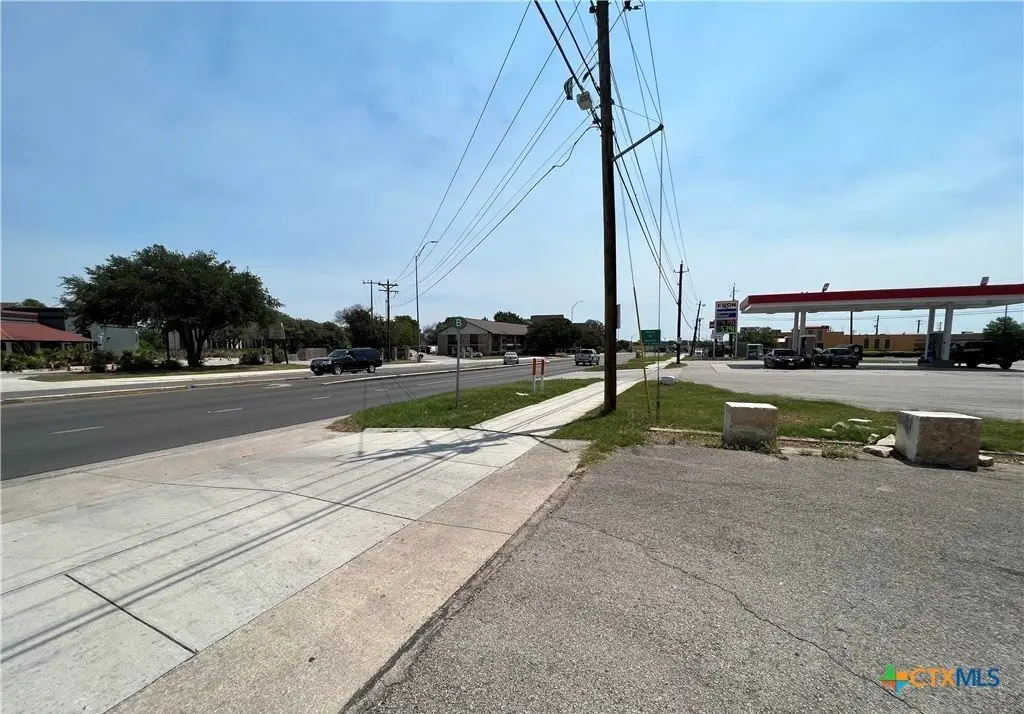
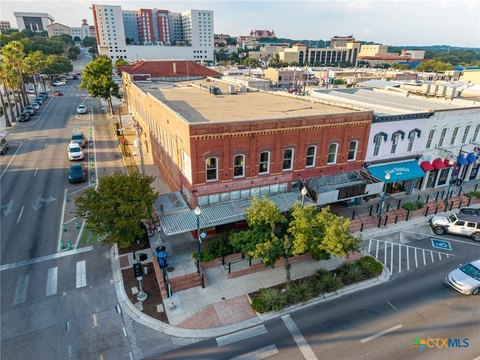
The property is positioned near I-35 and Texas State University, providing access to both major regional transportation and the university area. Public water and public sewer serve the site. Its existing office layout, compact footprint, and adaptable commercial setting provide a straightforward base for an owner-user or other office-oriented operation.
The property is positioned near I-35 and Texas State University, providing access to both major regional transportation and the university area. Public water and public sewer serve the site. Its existing office layout, compact footprint, and adaptable commercial setting provide a straightforward base for an owner-user or other office-oriented operation.
Key Highlights
- 1,122 SF office building on a 0.119‑acre parcel
- Masonry construction completed in 1983
- Located at 1628 Aquarena Springs Drive in San Marcos
Financial Insights
Estimated NOI and Cap Rate
NOI / Yr
$26,755
Cap Rate
7.13%
Suggested Prices Based on Cap Rates
Cap Rate 5%
$535,100
$535.1K
Cap Rate 7%
$382,214
$382.2K
Cap Rate 9%
$297,278
$297.3K
Market Conditions
NOI Build-Up for 1,122 SF
Gross rent
$47.1K $42.00/SF
− Vacancy
−$11.5K −$10.21/SF
EGI
$35.7K $31.79/SF
− OpEx
−$8.9K −$7.95/SF
NOI
$26.8K $23.85/SF
Area
Hays County, TX
Vacancy
24.30%
Lease Rate
$42.00 /SF/Yr
Expense Ratio
25.00%
Simulate Cap Rate and NOI
Suggested Prices Based on Cap Rates
Cap Rate 5%
$535,100
Cap Rate 7%
$382,214
Cap Rate 9%
$297,278
Alternative Uses
Best Use
Office B
$382.2K
$334.4K – $445.9K
NOI $26,755 @ 7.0% cap · market cap 7.13%
Second Best
—
—
no second resolved use
Theoretical Best
Office A
$469.0K
$410.4K – $547.2K
NOI $32,832 @ 7.0% cap · market cap 8.76%
Zoning and permitted uses should be independently verified with authorities.
How Realmo checks its estimates
Property Analytics
Unlock full access to Insights
Subscribe to Realmo Intelligence
Open Analytics
Current Use
Lease Details
Yes
Highway access
Location Intelligence
Trade Area within ½ mile
661
Businesses Nearby
Explore this area
Business Placement
Demographics for 78666, TX
86,584
Population
36,354
Households
2.4
Avg Household Size
27
Median Age
35%
College-Educated
89%
High-School Grad
192.4 sq mi
ZIP Area
450
Density / Sq Mi
$55,478
Median Household Income
$25,890
Median Earnings
$1,294
Median Rent
$271,900
Median Home Value
Check the figures for this property
Cap Rate, Value Estimation, Potential NOI and more
View Realmo Analytics
Market
Vacancy Rate% for Office in South region





Frequently Asked Questions
What type of property is this?
Office building - Existing office configuration with public water and sewer service supports immediate commercial use.
Where is this office building located?
The property is located at 1628 Aquarena Springs Drive San Marcos, TX.
What is the asking price?
The asking price for this property is $374,999.
What are key features of this property?
This property features: 1,122 SF office building on a 0.119‑acre parcel; Masonry construction completed in 1983; Located at 1628 Aquarena Springs Drive in San Marcos


