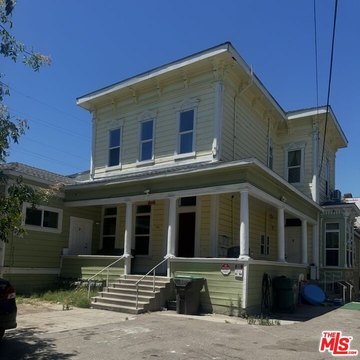
Dental Medical Office
For Sale
Contact for pricing
1616 N Harrison St, Stockton, CA 95204
Configured healthcare space includes plumbed treatment rooms, laboratory facilities, restrooms, and a staff breakroom.
Property Size3,995 SF
Price / SF$206.51
Days on Market80
Property Features for 1616 N Harrison St
General Information
Standard status
Active
Size
3,995 SF
Property subtype
OFFICE
Listing Agency:
CBRE | Central Valley
(209) 473-7800
Listed By:
Brian Peterson
(209) 476-2907
Source:
Moodyscre
Added: Jul 31
Changed: Oct 16
Last Checked: Oct 16 at 11:35AM
Displayed information is deemed reliable but is not guaranteed and should be independently verified. All listing content including descriptions, pricing, images are the copyrighted material of CBRE | Central Valley

Ask AI about this property
Review the available facts, identify missing information and prepare questions for the agent.
Investment Insights
Based on property information with market context.
This 3,995-square-foot medical office space is configured for dental operations, with a reception and waiting area, five operatories with plumbing, a dedicated dental laboratory, two interior restrooms, and a breakroom. The layout provides an established clinical setup within a professional office environment.
Located at 1616 N Harrison St in Stockton, the property serves a residential population of 23,353 people within a 1-mile radius, based on the 2020 census. Adjacent suites may offer room for expansion, while the existing configuration also supports potential third-party leasing.
Located at 1616 N Harrison St in Stockton, the property serves a residential population of 23,353 people within a 1-mile radius, based on the 2020 census. Adjacent suites may offer room for expansion, while the existing configuration also supports potential third-party leasing.
Key Highlights
- 3,995‑square‑foot medical office space at 1616 N Harrison St, Stockton, CA 95204
- Five dental operatories with plumbing
- Full dental laboratory included in the existing layout
Financial Insights
Estimated NOI and Cap Rate
NOI / Yr
$61,060
Cap Rate
7.40%
Suggested Prices Based on Cap Rates
Cap Rate 5%
$1,221,200
$1.2M
Cap Rate 7%
$872,286
$872.3K
Cap Rate 9%
$678,444
$678.4K
Market Conditions
NOI Build-Up for 3,995 SF
Gross rent
$87.7K $21.96/SF
− Vacancy
−$6.3K −$1.58/SF
EGI
$81.4K $20.38/SF
− OpEx
−$20.4K −$5.09/SF
NOI
$61.1K $15.28/SF
Area
Stockton, CA
Vacancy
7.20%
Lease Rate
$21.96 /SF/Yr
Expense Ratio
25.00%
Simulate Cap Rate and NOI
Suggested Prices Based on Cap Rates
Cap Rate 5%
$1,221,200
Cap Rate 7%
$872,286
Cap Rate 9%
$678,444
Alternative Uses
Best Use
Office B
$872.3K
$763.3K – $1.02M
NOI $61,060 @ 7.0% cap · market cap 7.40%
Second Best
Healthcare Medical
$849.8K
$743.6K – $991.4K
NOI $59,484 @ 7.0% cap · market cap 7.21%
Theoretical Best
Office A
$1.08M
$945.3K – $1.26M
NOI $75,624 @ 7.0% cap · market cap 9.17%
Zoning and permitted uses should be independently verified with authorities.
How Realmo checks its estimates
Property Analytics
Unlock full access to Insights
Subscribe to Realmo Intelligence
Open Analytics
Current Use
Location Intelligence
Trade Area within ½ mile
1,316
Businesses Nearby
Under-served
Demand for This Use
Explore this area
Business Placement
Demographics for 95204, CA
30,719
Population
12,354
Households
2.5
Avg Household Size
37
Median Age
20%
College-Educated
84%
High-School Grad
5.3 sq mi
ZIP Area
5,796
Density / Sq Mi
$71,792
Median Household Income
$42,361
Median Earnings
$1,381
Median Rent
$358,300
Median Home Value
Check the figures for this property
Cap Rate, Value Estimation, Potential NOI and more
View Realmo Analytics
Market
Vacancy Rate% for Office in West region




Frequently Asked Questions
What type of property is this?
Medical Office Space - Configured healthcare space includes plumbed treatment rooms, laboratory facilities, restrooms, and a staff breakroom.
Where is this medical office space located?
The property is located at 1616 N Harrison St Stockton, CA.
What is the asking price?
The asking price for this property is $825,000.
What are key features of this property?
This property features: 3,995‑square‑foot medical office space at 1616 N Harrison St, Stockton, CA 95204; Five dental operatories with plumbing; Full dental laboratory included in the existing layout


