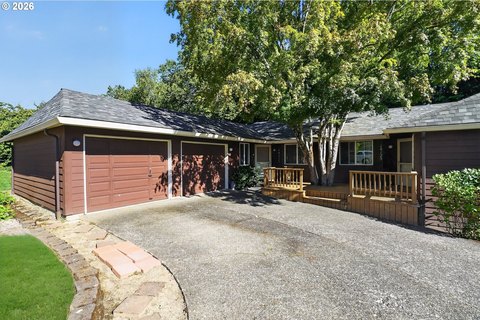
Updated Condo in Beaverton
For Sale
$235,000
12062 SW CONESTOGA DR, Beaverton, OR 97008
Updated 2-bedroom condo in Beaverton, move-in ready with modern upgrades.
Property Size862 SF
Price / SF$272.62
Days on Market502
Property Features for 12062 SW CONESTOGA DR
General Information
Standard status
Active
Size
862 SF
Property subtype
Condominium
Amenities
Fireplace
Baseboard
Wall Unit
Dishwasher
Free-Standing Range
Deck, Composition
Building Details
Building Size
862 SF
Year Built
1980
Stories
1
Listing Agency:
Keller Williams Premier Partners
Listed By:
Linsey Beattie · License #124170
(360) 852-5836
Source:
Kw
Added: May 23, 2025
Changed: Sep 29
Last Checked: Oct 5 at 4:43PM
Displayed information is deemed reliable but is not guaranteed and should be independently verified. All listing content including descriptions, pricing, images are the copyrighted material of Keller Williams Premier Partners
Investment Insights
Based on property information with market context.
This updated condo features 2 bedrooms and 1 bath, situated in the Greenwood Terrace community of Beaverton. The property has been updated with new paint, flooring, baseboards, heaters, kitchen countertops, and a new AC unit. The cabinets have been refinished. All appliances are included. The homeowner's association covers water, sewer, and garbage. The property includes two parking spaces and has no rent cap. The condo is located near walking trails, schools, parks, a recreation center, shopping, and downtown Beaverton. The property size is 862 square feet.
Key Highlights
- Move‑in ready with extensive recent updates including new paint, flooring, baseboards, heaters, AC unit, kitchen countertops, and refinished cabinets.
- Prime location: moments from walking trails, schools, parks, rec center, shopping, and downtown Beaverton.
- HOA covers water, sewer, and garbage.
Financial Insights
Estimated NOI and Cap Rate
NOI / Yr
$11,068
Cap Rate
4.71%
Suggested Prices Based on Cap Rates
Cap Rate 5%
$221,360
$221.4K
Cap Rate 7%
$158,114
$158.1K
Cap Rate 9%
$122,978
$123.0K
Market Conditions
NOI Build-Up for 862 SF
Gross rent
$21.2K $24.60/SF
− Vacancy
−$1.1K −$1.25/SF
EGI
$20.1K $23.35/SF
− OpEx
−$9.1K −$10.51/SF
NOI
$11.1K $12.84/SF
Area
Washington County, OR
Vacancy
5.10%
Lease Rate
$24.60 /SF/Yr
Expense Ratio
45.00%
Simulate Cap Rate and NOI
Suggested Prices Based on Cap Rates
Cap Rate 5%
$221,360
Cap Rate 7%
$158,114
Cap Rate 9%
$122,978
Alternative Uses
Best Use
Apartment 5plus
$158.1K
$138.4K – $184.5K
NOI $11,068 @ 7.0% cap · market cap 4.71%
Second Best
—
—
no second resolved use
Theoretical Best
Office A
$232.7K
$203.6K – $271.5K
NOI $16,287 @ 7.0% cap · market cap 6.93%
Zoning and permitted uses should be independently verified with authorities.
Property Analytics
Unlock full access to Insights
Subscribe to Realmo Intelligence
Open Analytics
Current Use
Location Intelligence
Trade Area within ½ mile
774
Businesses Nearby
Explore this area
Business Placement
Demographics for 97008, OR
29,632
Population
12,845
Households
2.3
Avg Household Size
39
Median Age
48%
College-Educated
95%
High-School Grad
5.3 sq mi
ZIP Area
5,591
Density / Sq Mi
$90,246
Median Household Income
$52,133
Median Earnings
$1,664
Median Rent
$555,300
Median Home Value
Check the figures for this property
Cap Rate, Value Estimation, Potential NOI and more
View Realmo Analytics
Market
Vacancy Rate% for Multifamily in West region

Questions? Ask Rey
Realmo’s AI knows this listing — price, zoning, demand, history. Ask anything.





Frequently Asked Questions
What type of property is this?
Apartment building - Updated 2-bedroom condo in Beaverton, move-in ready with modern upgrades.
Where is this apartment building located?
The property is located at 12062 SW CONESTOGA DR Beaverton, OR.
What is the asking price?
The asking price for this property is $235,000.
What are key features of this property?
This property features: Move‑in ready with extensive recent updates including new paint, flooring, baseboards, heaters, AC unit, kitchen countertops, and refinished cabinets.; Prime location: moments from walking trails, schools, parks, rec center, shopping, and downtown Beaverton.; HOA covers water, sewer, and garbage.



