Two-Story Mixed-Use
For Sale
$1,500,000
111 E GONZALES ST, Seguin, TX 78155
Historic commercial property with separately metered suites, private offices, storefronts, meeting areas, and retained architectural details.
Property Size11,074 SF
Price / SF$135.45
Days on Market49
Property Features for 111 E GONZALES ST
General Information
Standard status
Active
Size
11,074 SF
Property subtype
Multi-Use
Additional Details
Road Access
Yes
Amenities
exposed brick walls
original hardwood flooring
tall windows
distinctive woodwork
meeting areas
break-room facilities
Building Details
Year Built
1912
Buildings
1
Stories
2
Construction
brick
Tenancy
Multi
Listing Agency:
PIONEER REALTY PARTNERS, LLC
Listed By:
Denise Bourassa
(210) 355-0559
Source:
Pioneerrealtypartners
Added: Aug 30
Changed: Oct 16
Last Checked: Oct 16 at 8:41AM
Displayed information is deemed reliable but is not guaranteed and should be independently verified. All listing content including descriptions, pricing, images are the copyrighted material of PIONEER REALTY PARTNERS, LLC

Ask AI about this property
Review the available facts, identify missing information and prepare questions for the agent.
Investment Insights
Based on property information with market context.
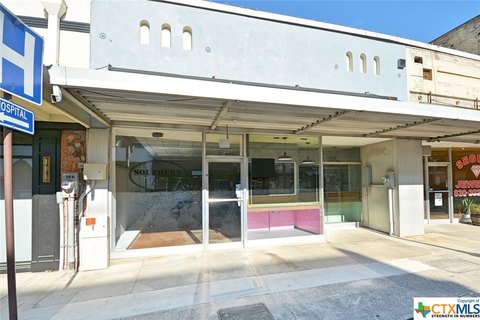
This two-story mixed-use building contains approximately 11,074 square feet of commercial space organized for multiple occupants. The ground floor has 5 businesses, each with an individual entrance, bathroom, and meter. The upper level includes 15+ offices, men’s and women’s restrooms, 3 breakrooms, storage, and a separate meter. Interior character includes exposed brick, original hardwood floors, tall windows, and detailed woodwork, along with storefront areas and meeting spaces.
The property is located at 111 E. Gonzales Street in historic downtown Seguin, with prominent street frontage and established businesses, restaurants, shopping, and downtown attractions nearby. Its combination of separately configured ground-floor spaces and extensive upper-level office capacity supports a range of professional, retail, creative, and service-oriented occupancy formats.
The property is located at 111 E. Gonzales Street in historic downtown Seguin, with prominent street frontage and established businesses, restaurants, shopping, and downtown attractions nearby. Its combination of separately configured ground-floor spaces and extensive upper-level office capacity supports a range of professional, retail, creative, and service-oriented occupancy formats.
Key Highlights
- Approximately 11,074 square feet in a two‑story commercial building
- 5 downstairs businesses, each with its own entrance, bathroom, and meter
- Upper level includes 15+ offices, restrooms, 3 breakrooms, storage, and its own meter
Financial Insights
Estimated NOI and Cap Rate
NOI / Yr
$134,549
Cap Rate
8.97%
Suggested Prices Based on Cap Rates
Cap Rate 5%
$2,690,980
$2.7M
Cap Rate 7%
$1,922,129
$1.9M
Cap Rate 9%
$1,494,989
$1.5M
Market Conditions
NOI Build-Up for 11,074 SF
Gross rent
$239.2K $21.60/SF
− Vacancy
−$23.9K −$2.16/SF
EGI
$215.3K $19.44/SF
− OpEx
−$80.7K −$7.29/SF
NOI
$134.5K $12.15/SF
Area
Guadalupe County, TX
Vacancy
10.00%
Lease Rate
$21.60 /SF/Yr
Expense Ratio
37.50%
Simulate Cap Rate and NOI
Suggested Prices Based on Cap Rates
Cap Rate 5%
$2,690,980
Cap Rate 7%
$1,922,129
Cap Rate 9%
$1,494,989
Alternative Uses
Best Use
Office B
$2.16M
$1.89M – $2.52M
NOI $150,926 @ 7.0% cap · market cap 10.06%
Second Best
Retail
$2.12M
$1.85M – $2.47M
NOI $148,239 @ 7.0% cap · market cap 9.88%
Theoretical Best
Office A
$2.90M
$2.54M – $3.39M
NOI $203,319 @ 7.0% cap · market cap 13.55%
Zoning and permitted uses should be independently verified with authorities.
How Realmo checks its estimates
Property Analytics
Unlock full access to Insights
Subscribe to Realmo Intelligence
Open Analytics
Current Use
Lease Details
Multi-tenant
Tenancy
Yes
Paved road access
Location Intelligence
Trade Area within ½ mile
952
Businesses Nearby
Explore this area
Business Placement
Demographics for 78155, TX
51,772
Population
21,791
Households
2.4
Avg Household Size
40
Median Age
22%
College-Educated
85%
High-School Grad
355.5 sq mi
ZIP Area
146
Density / Sq Mi
$71,367
Median Household Income
$38,985
Median Earnings
$1,149
Median Rent
$246,000
Median Home Value
Check the figures for this property
Cap Rate, Value Estimation, Potential NOI and more
View Realmo Analytics
Market
Vacancy Rate% for Office in South region




Frequently Asked Questions
What type of property is this?
Mixed-use property - Historic commercial property with separately metered suites, private offices, storefronts, meeting areas, and retained architectural details.
Where is this mixed-use property located?
The property is located at 111 E GONZALES ST Seguin, TX.
What is the asking price?
The asking price for this property is $1,500,000.
What are key features of this property?
This property features: Approximately 11,074 square feet in a two‑story commercial building; 5 downstairs businesses, each with its own entrance, bathroom, and meter; Upper level includes 15+ offices, restrooms, 3 breakrooms, storage, and its own meter


