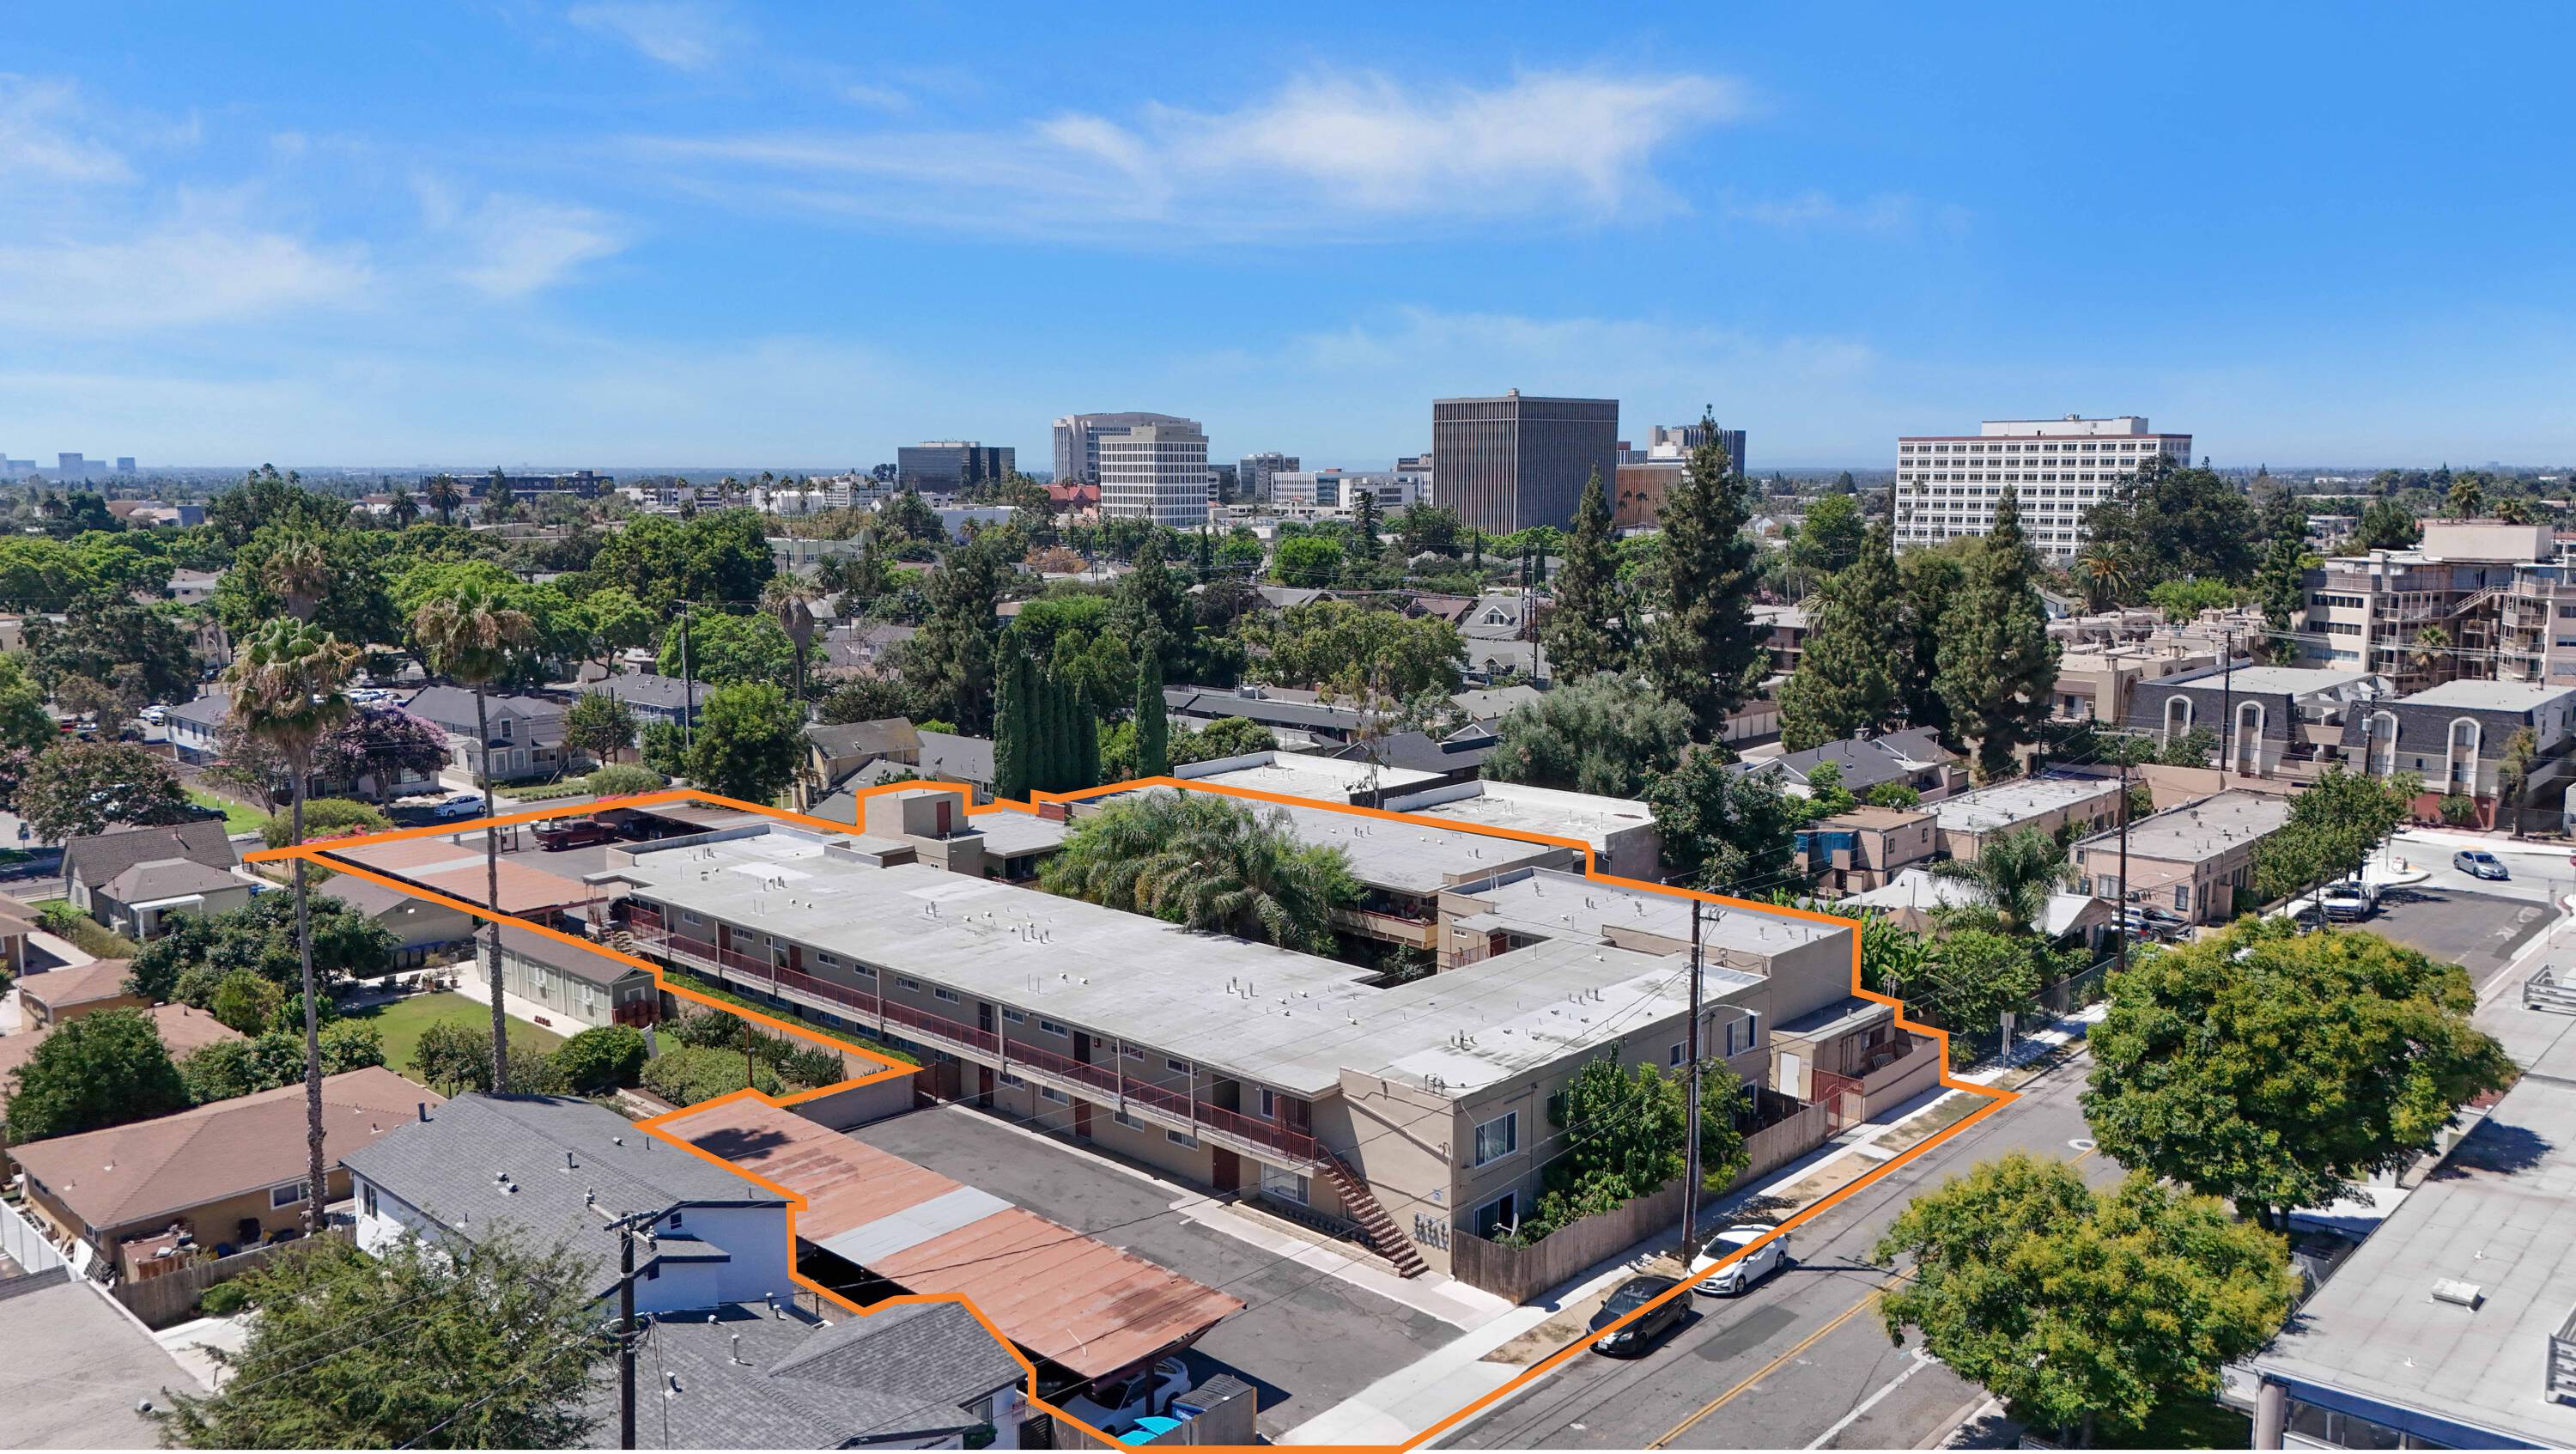
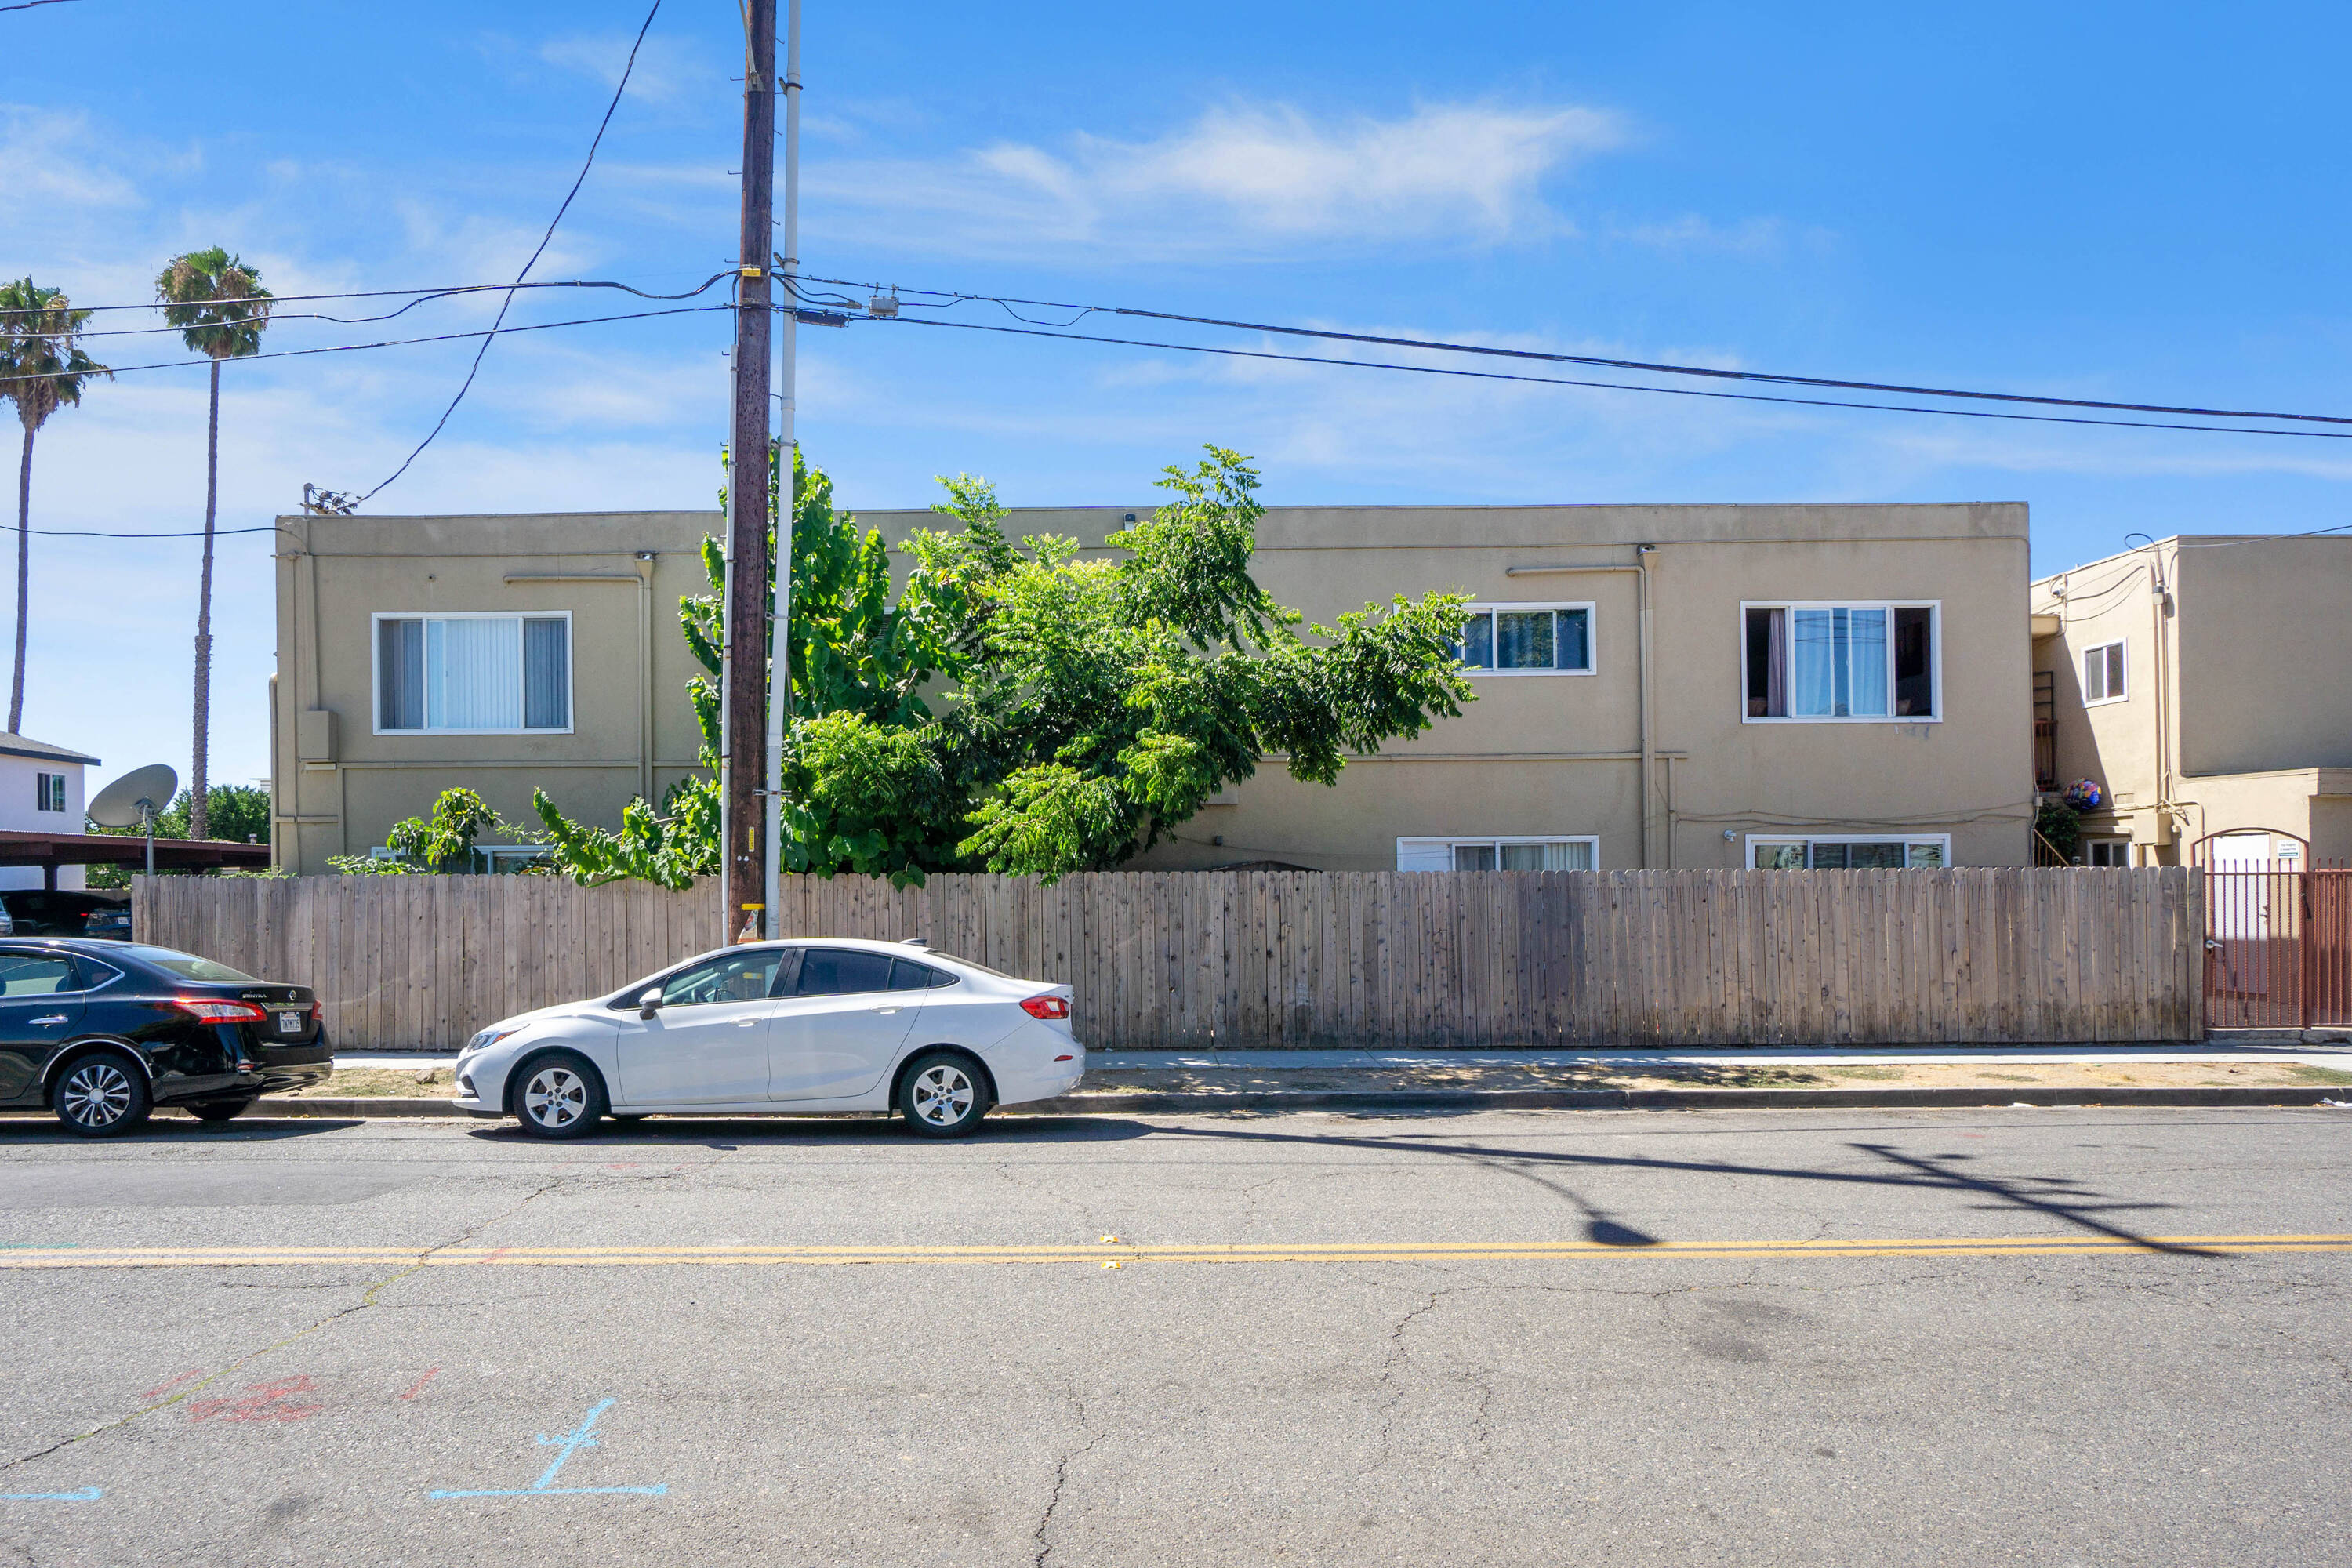
511 E Washington Ave Santa Ana, CA 92701
30-unit apartment community in desirable Santa Ana neighborhood.
Type:Multifamily
Property size:
26,707 SFLot size:
1.00 Acre- Added:
- Sep 24, 2024
- Days on Market:
- 573
- Last Refresh:
- Mar 17 at 1:13 pm
Property Features for 511 E Washington Ave
General Information
- Standard status
- Active
- Size
- 26,707 SF
- Lot size
- 1.00 Acre
- Property subtype
- Multifamily
Building Details
- Year Built
- 1964
Listing agent Alex Mobin License #01845973
Listing office Marcus & Millichap - Orange County
Listing date Sep 24, 2024
Source Crexi
Displayed information is deemed reliable but is not guaranteed and should be independently verified.
All listing content including descriptions, pricing, images are the copyrighted material of Marcus & Millichap - Orange County
Overview
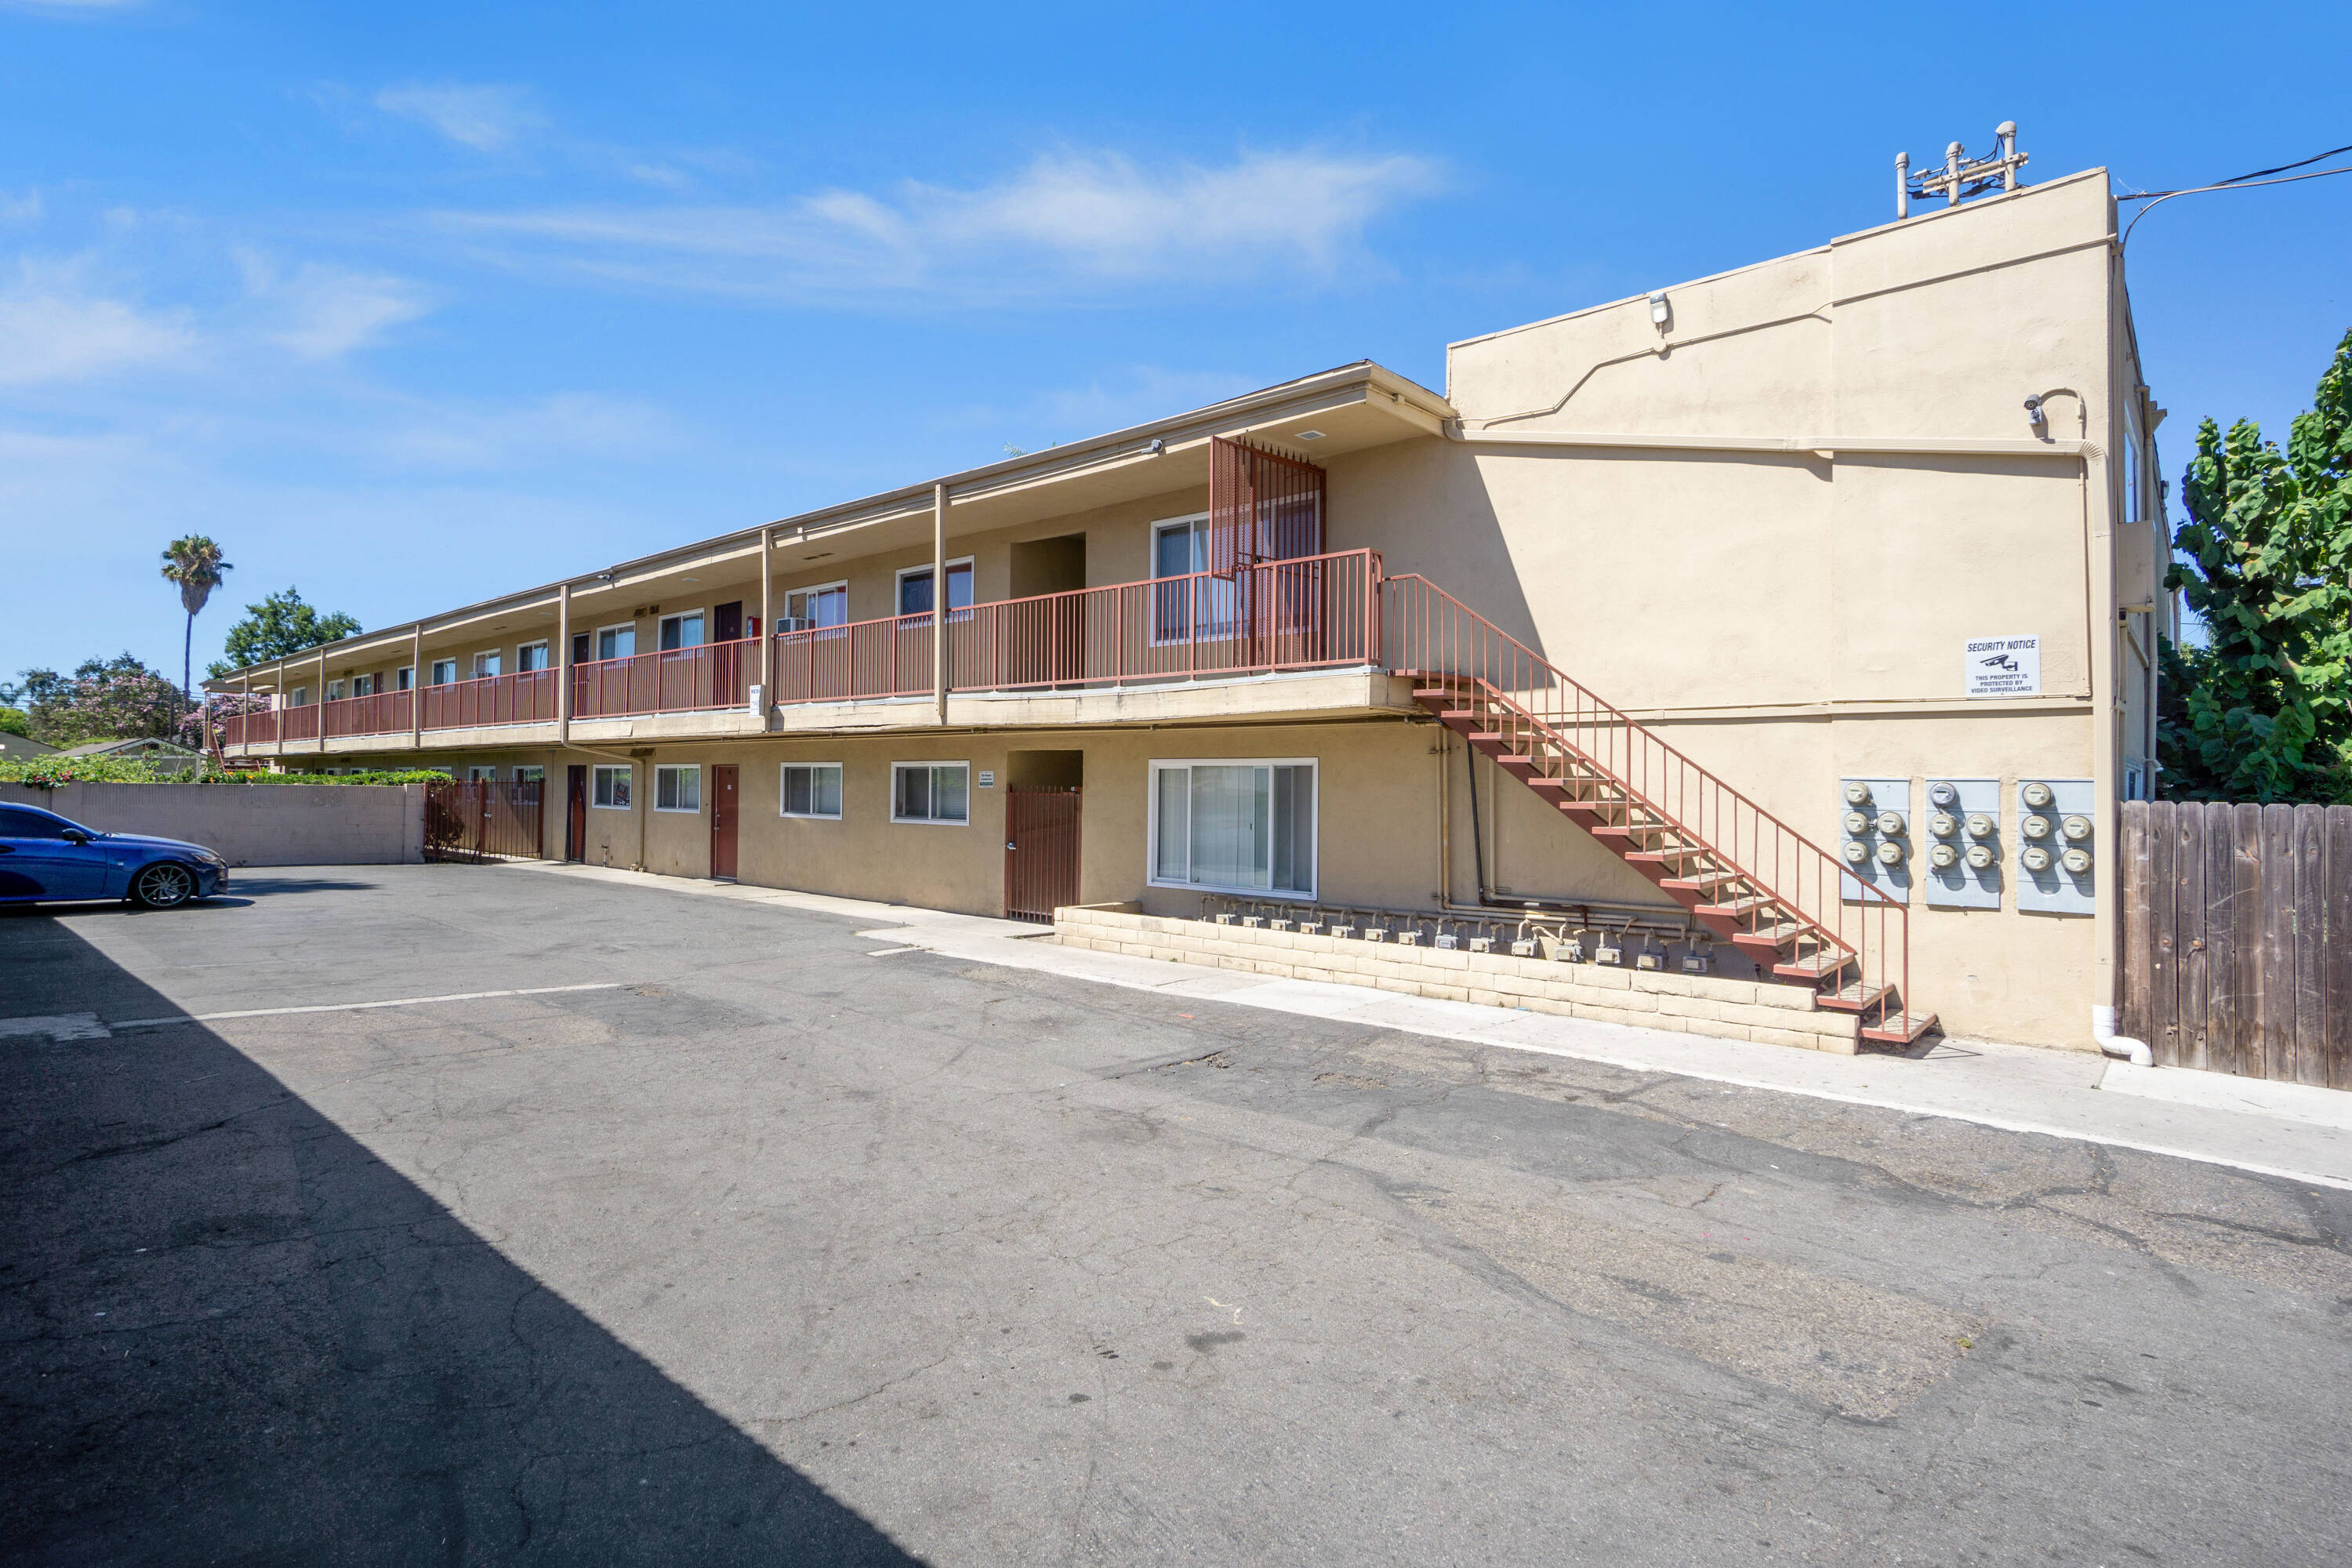
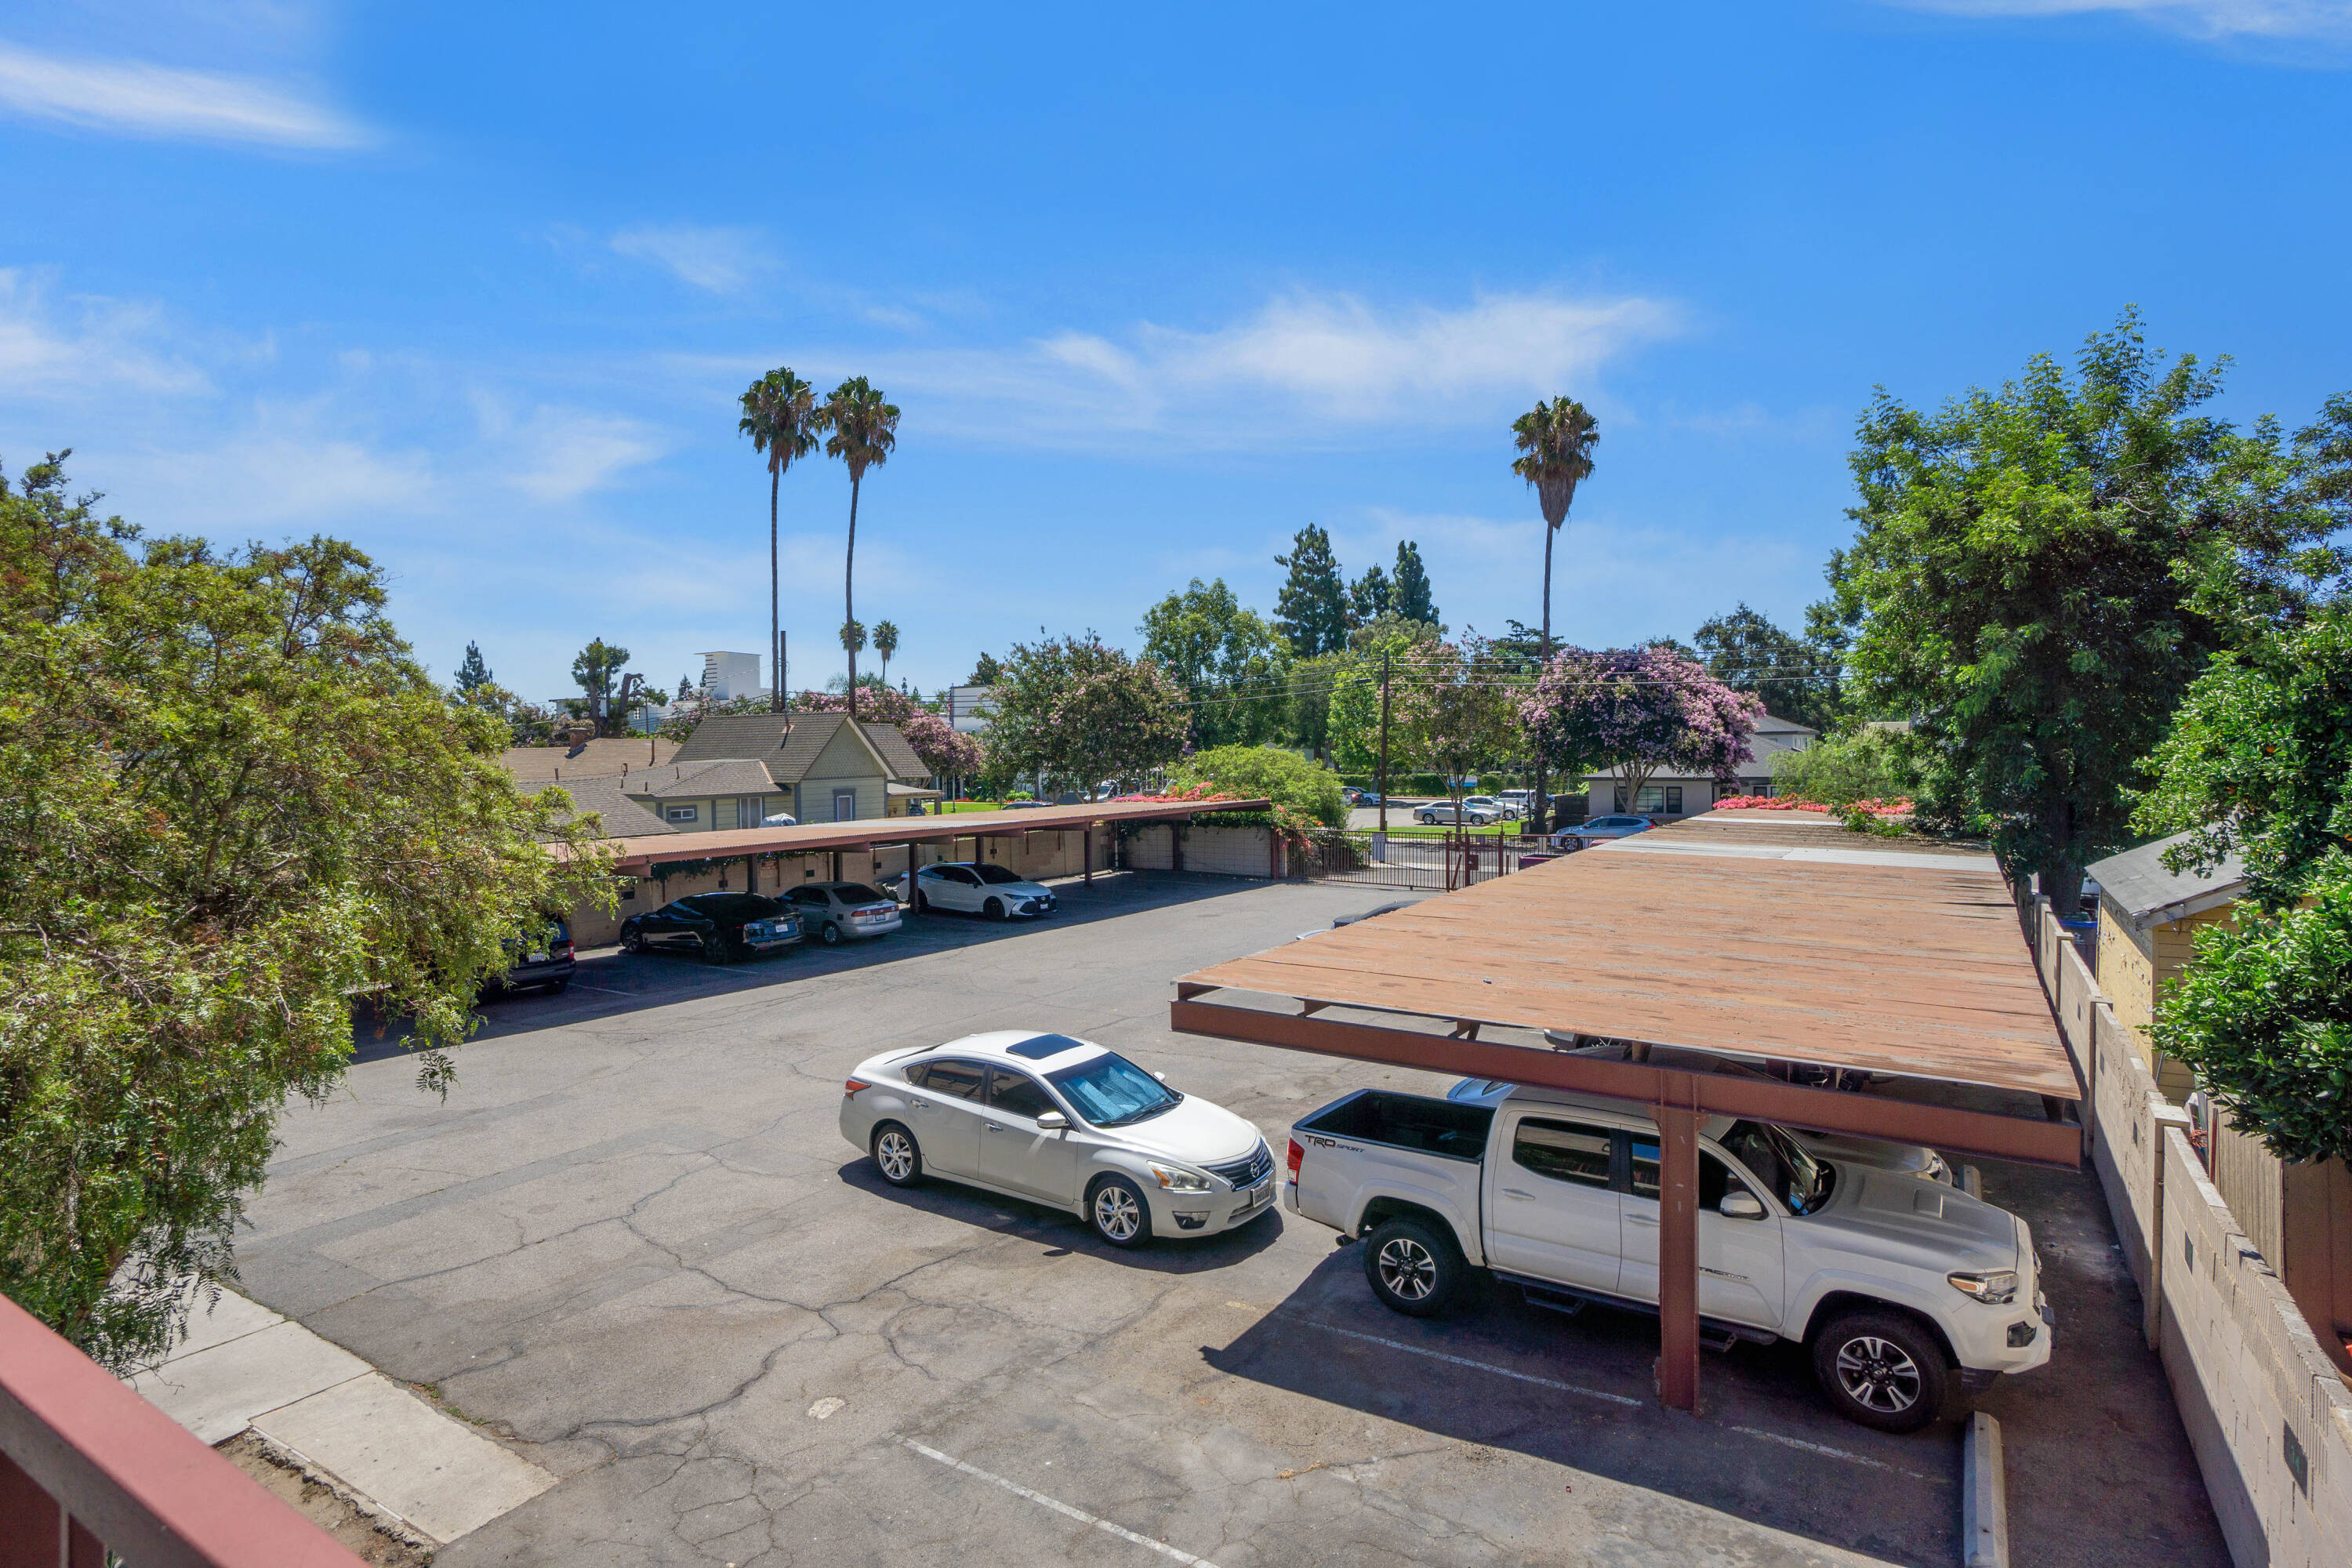
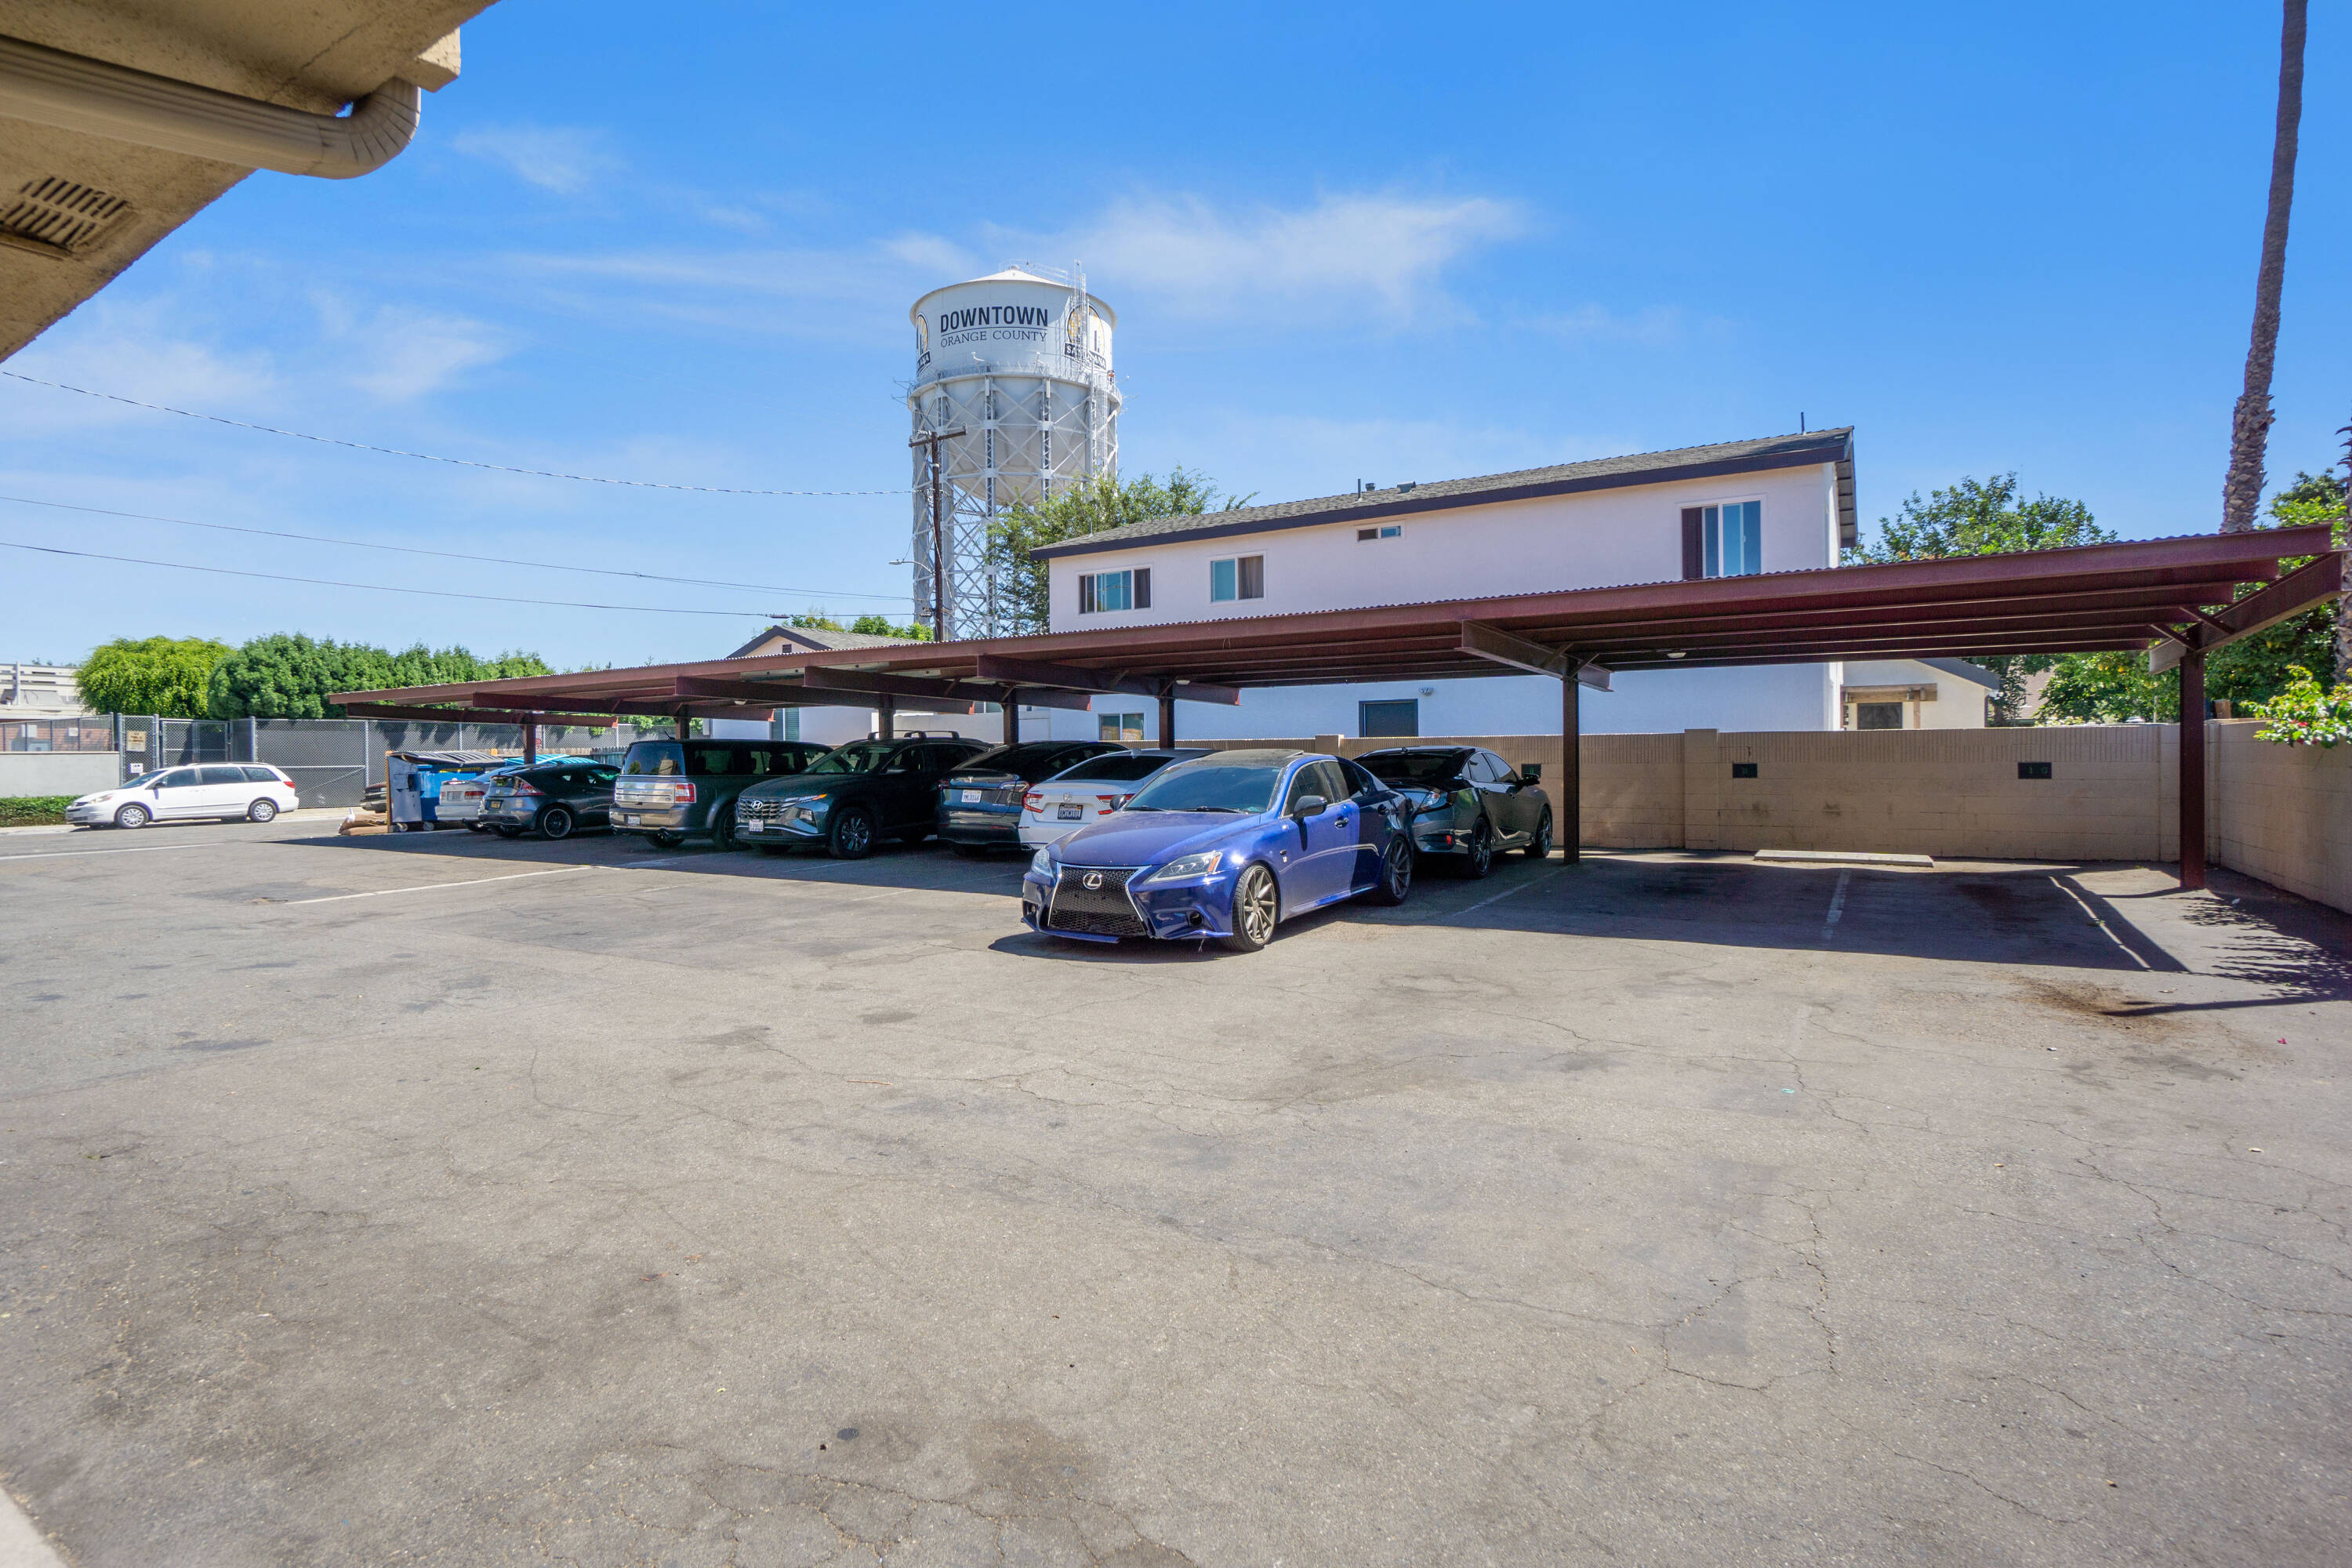
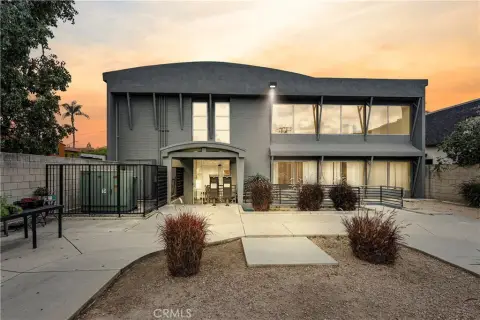
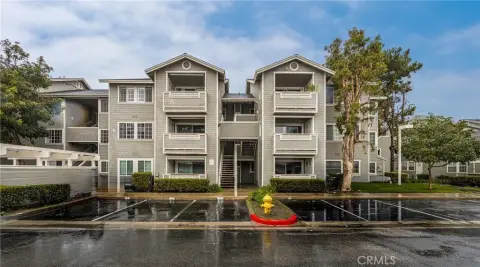
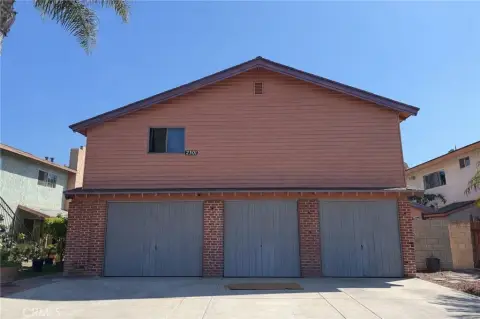
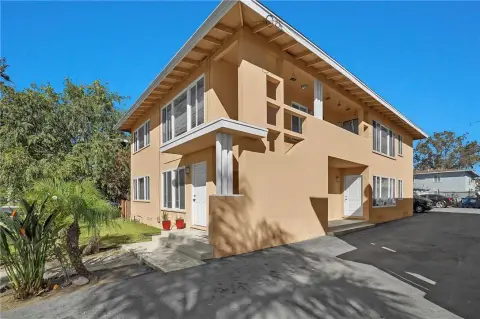
Santa Ana Multifamily Investment Opportunity
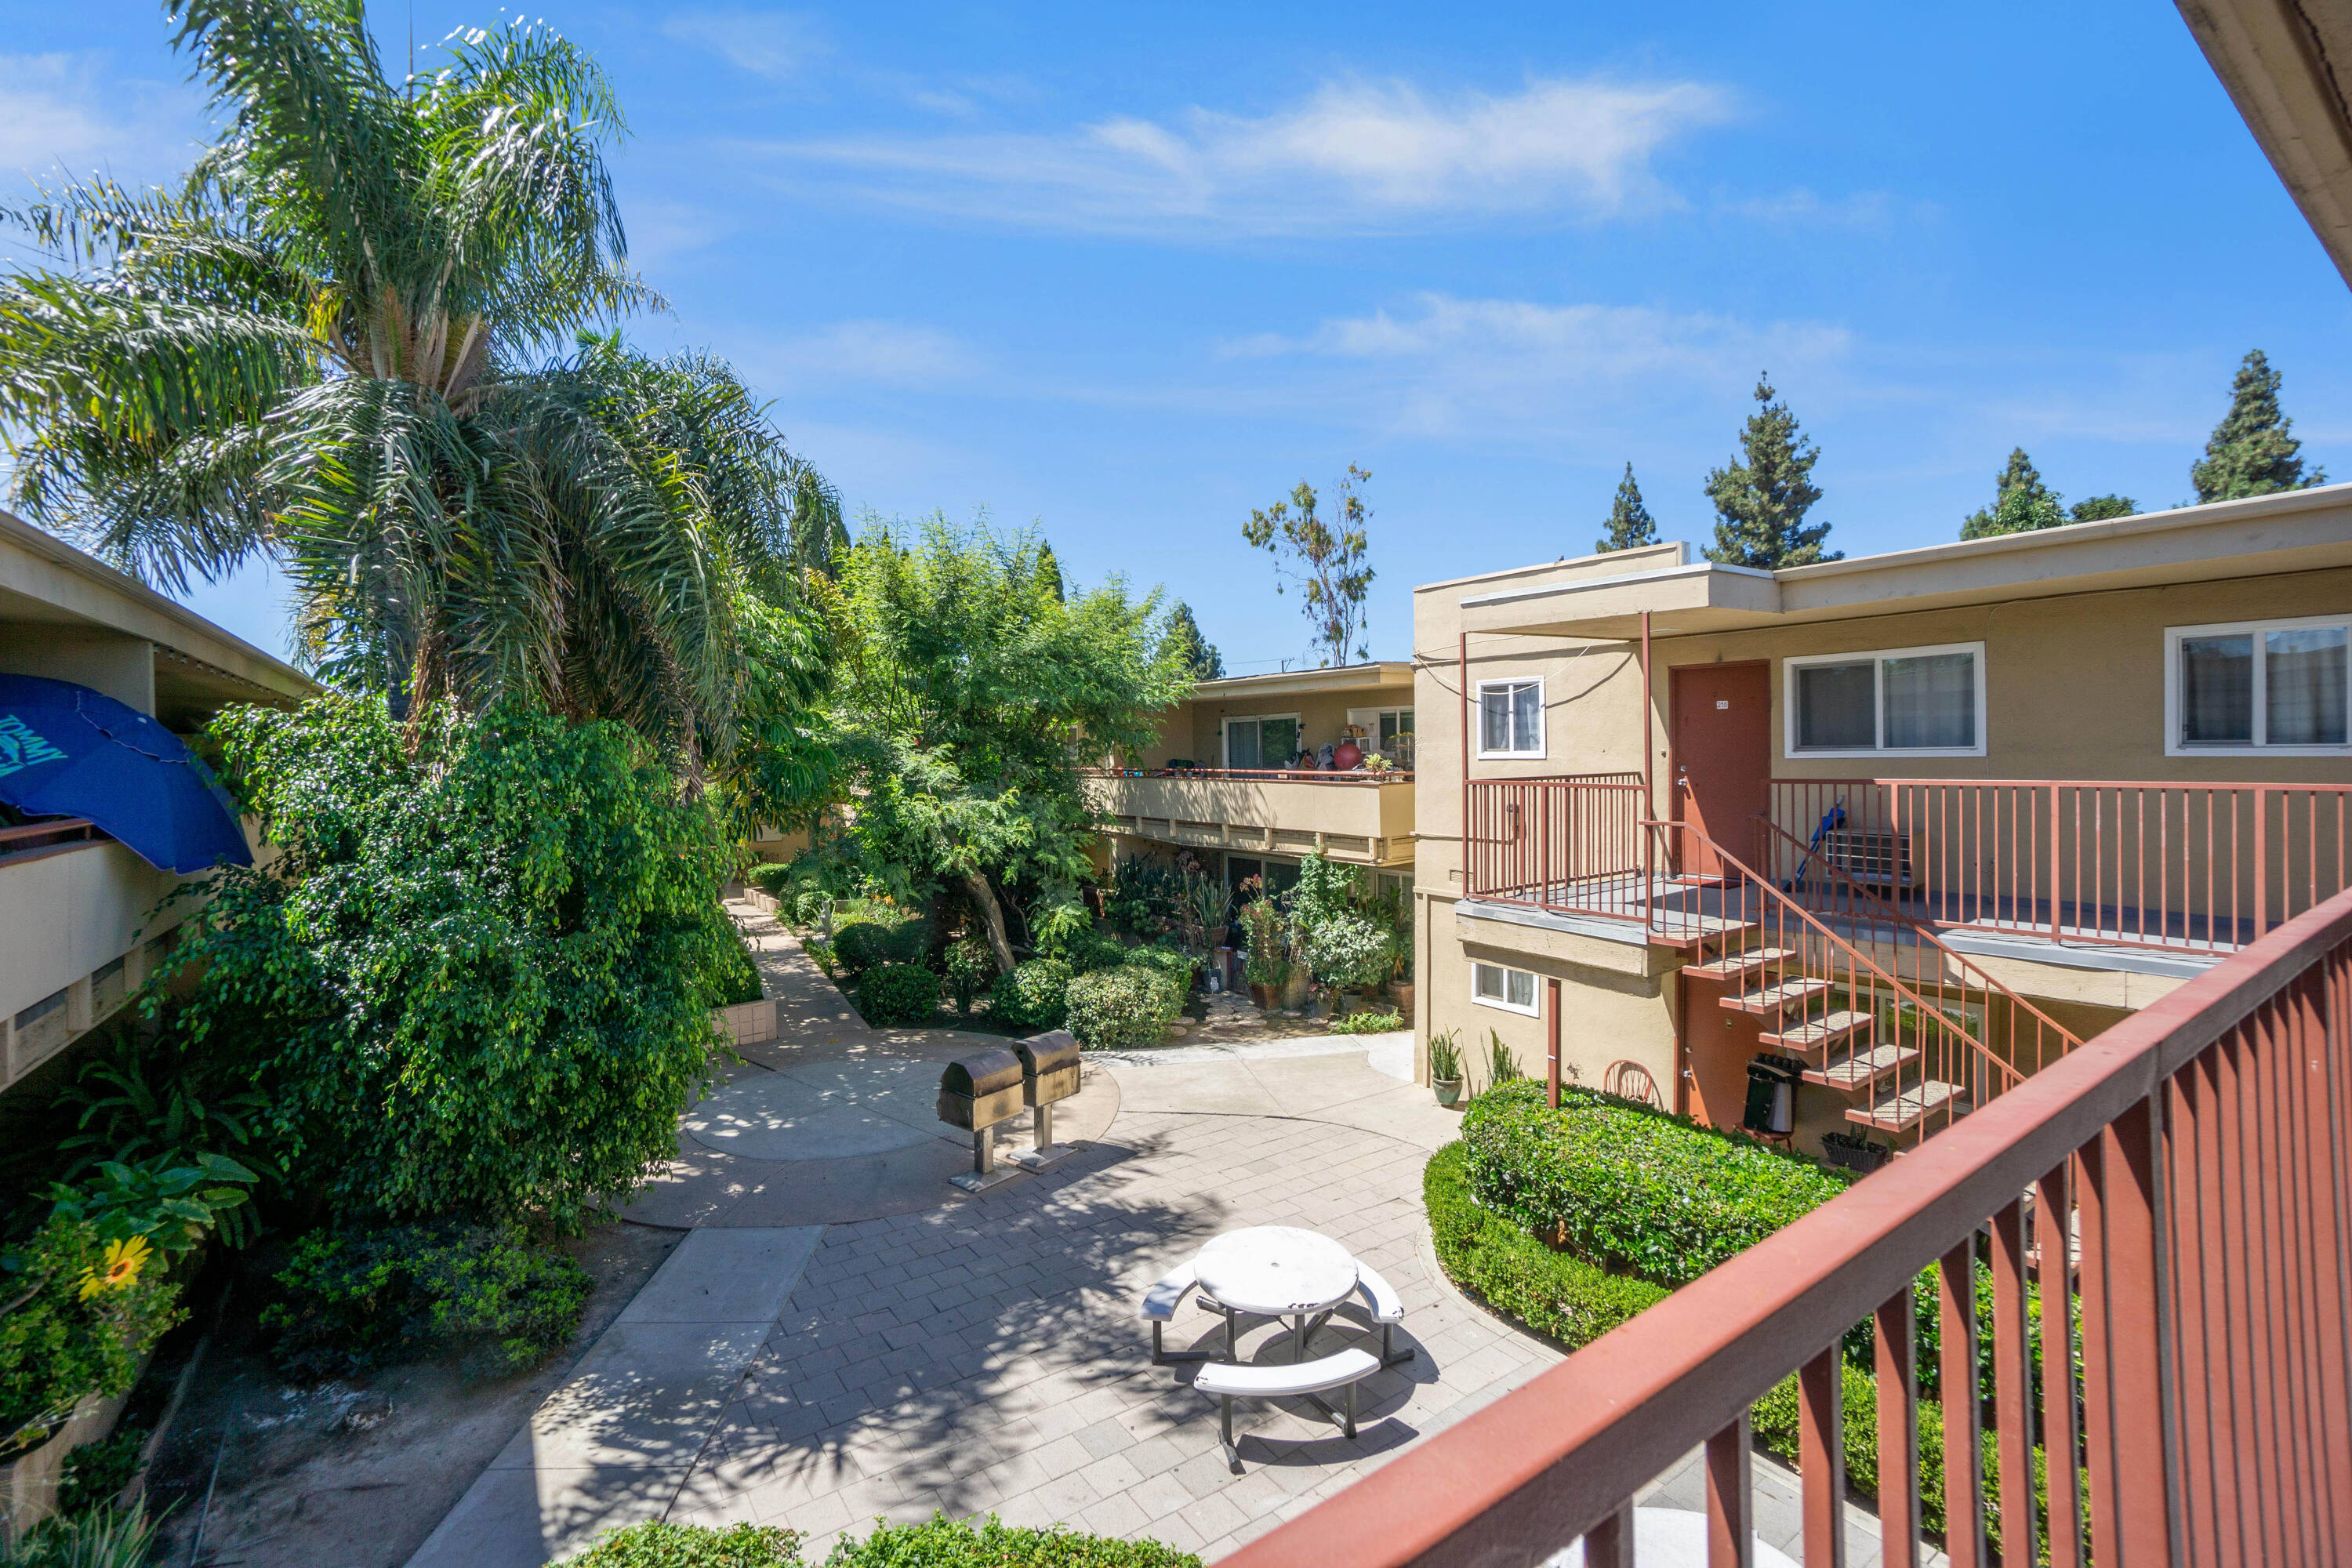
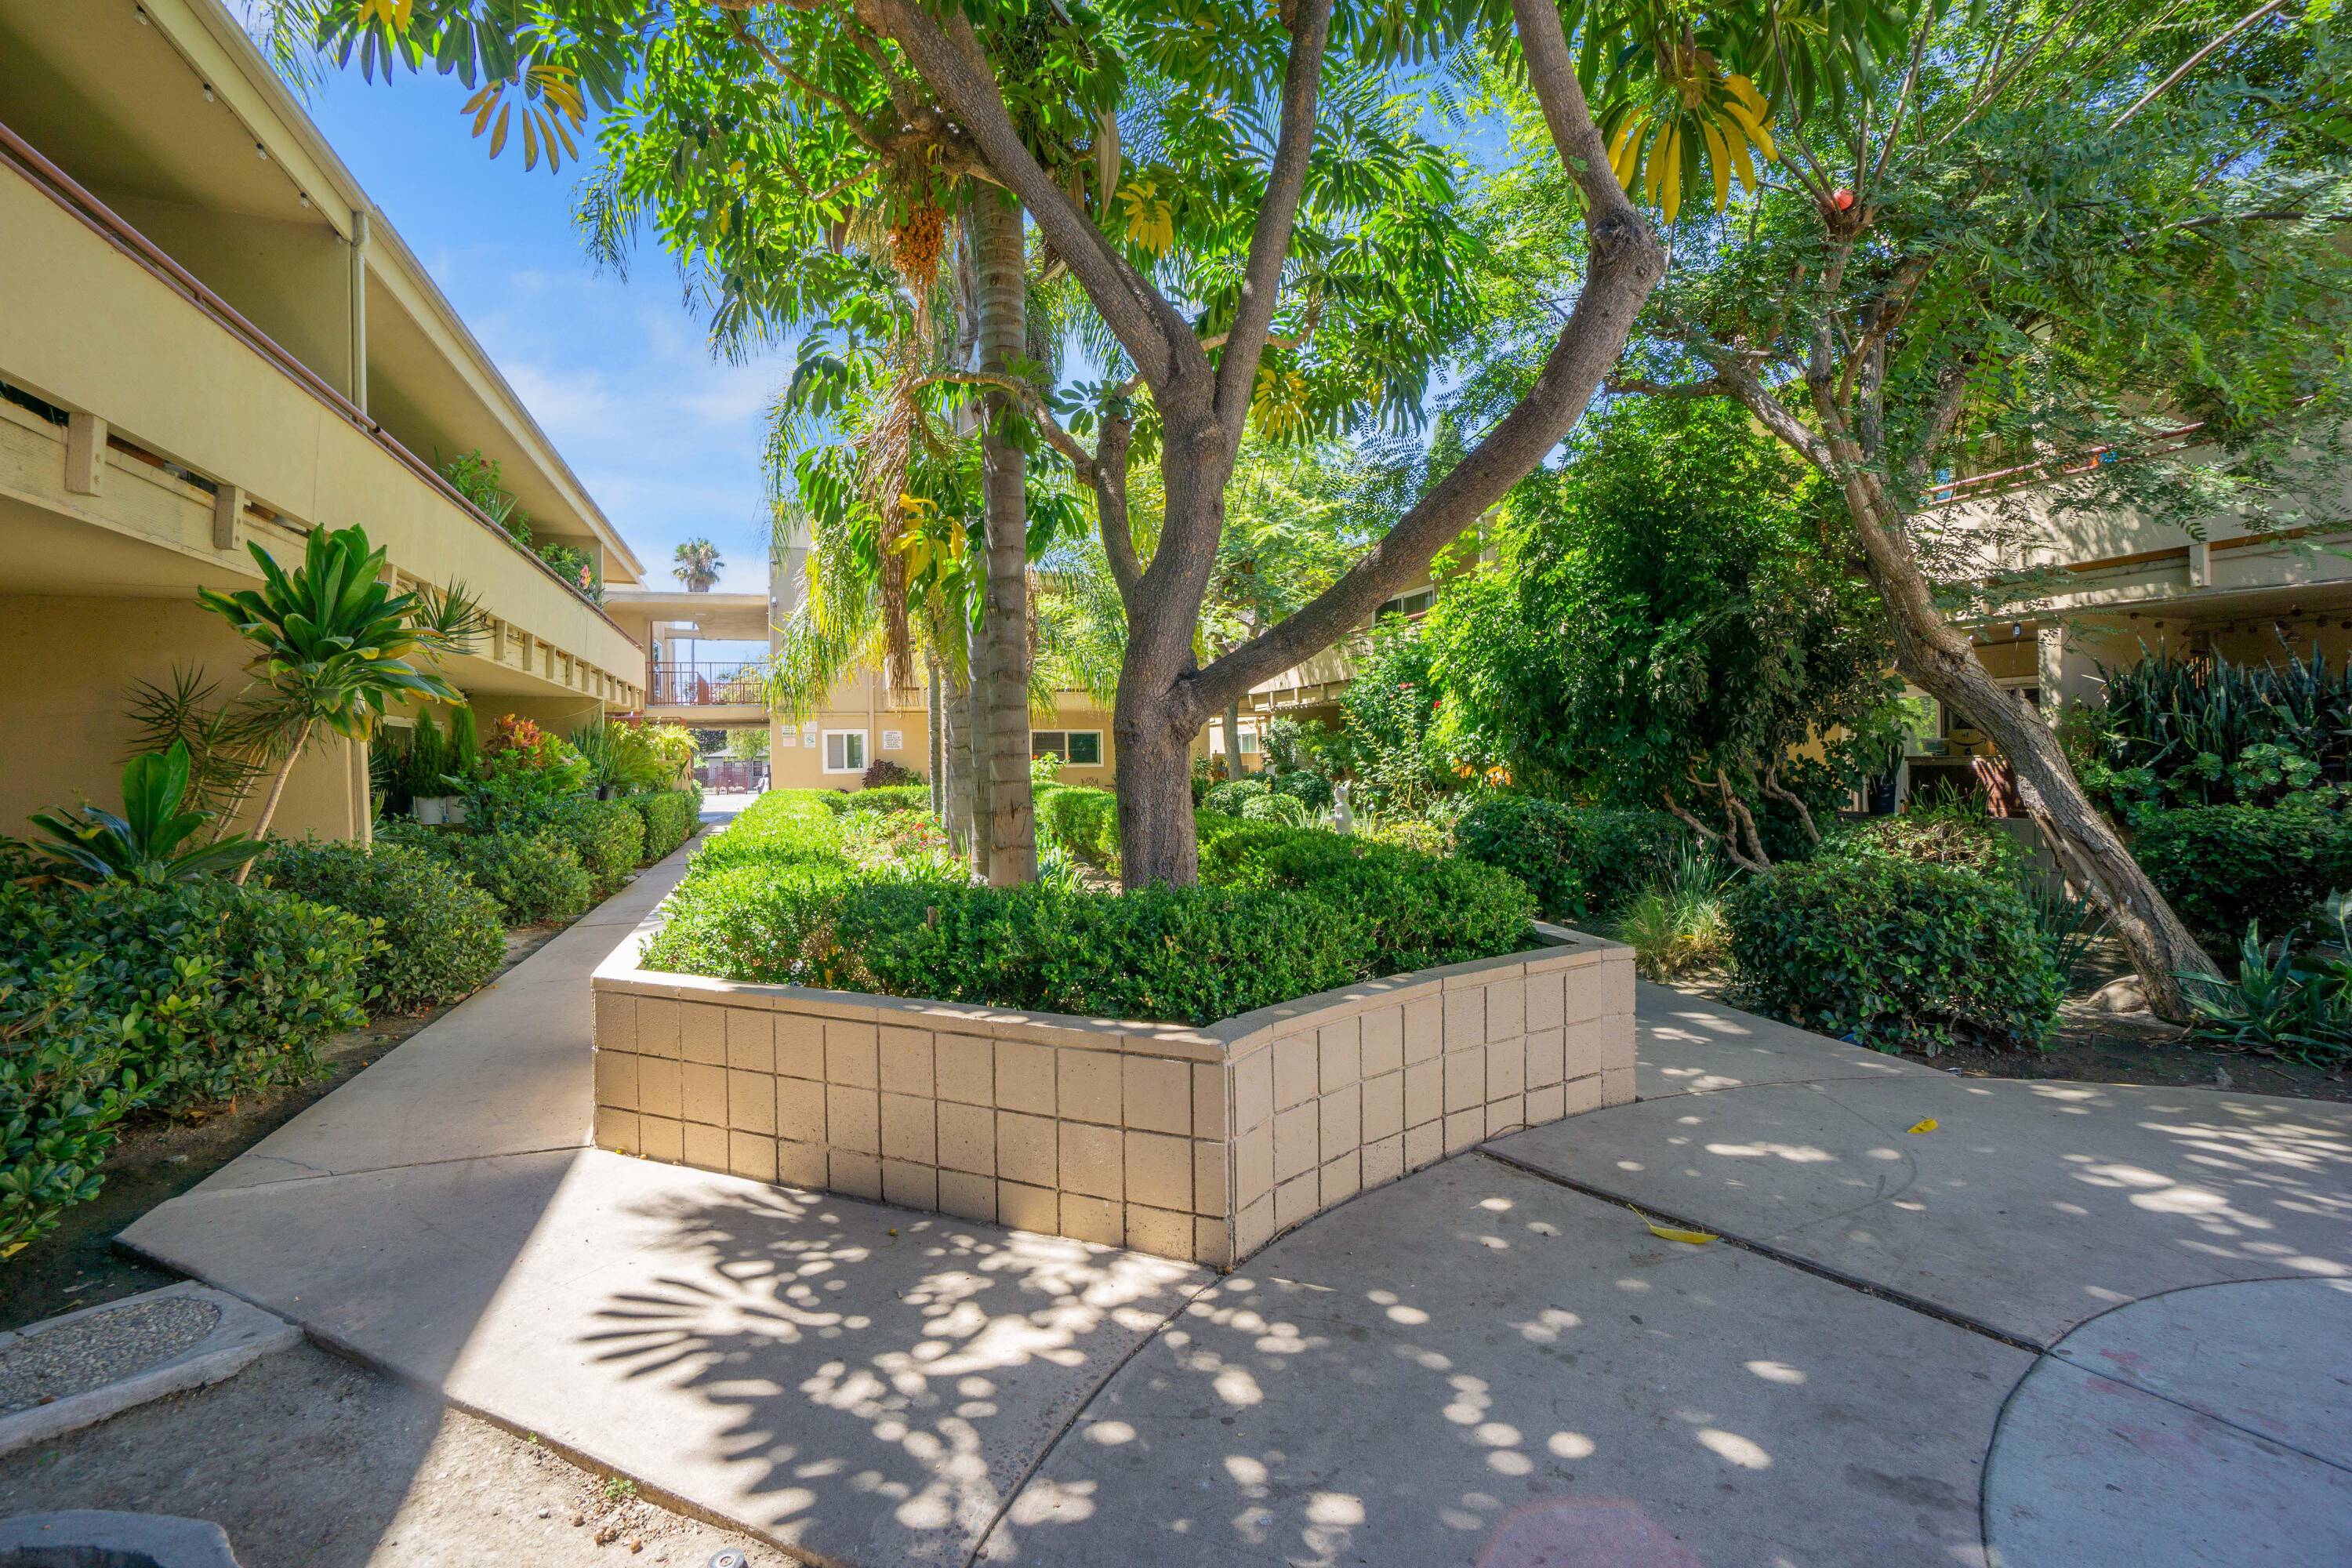
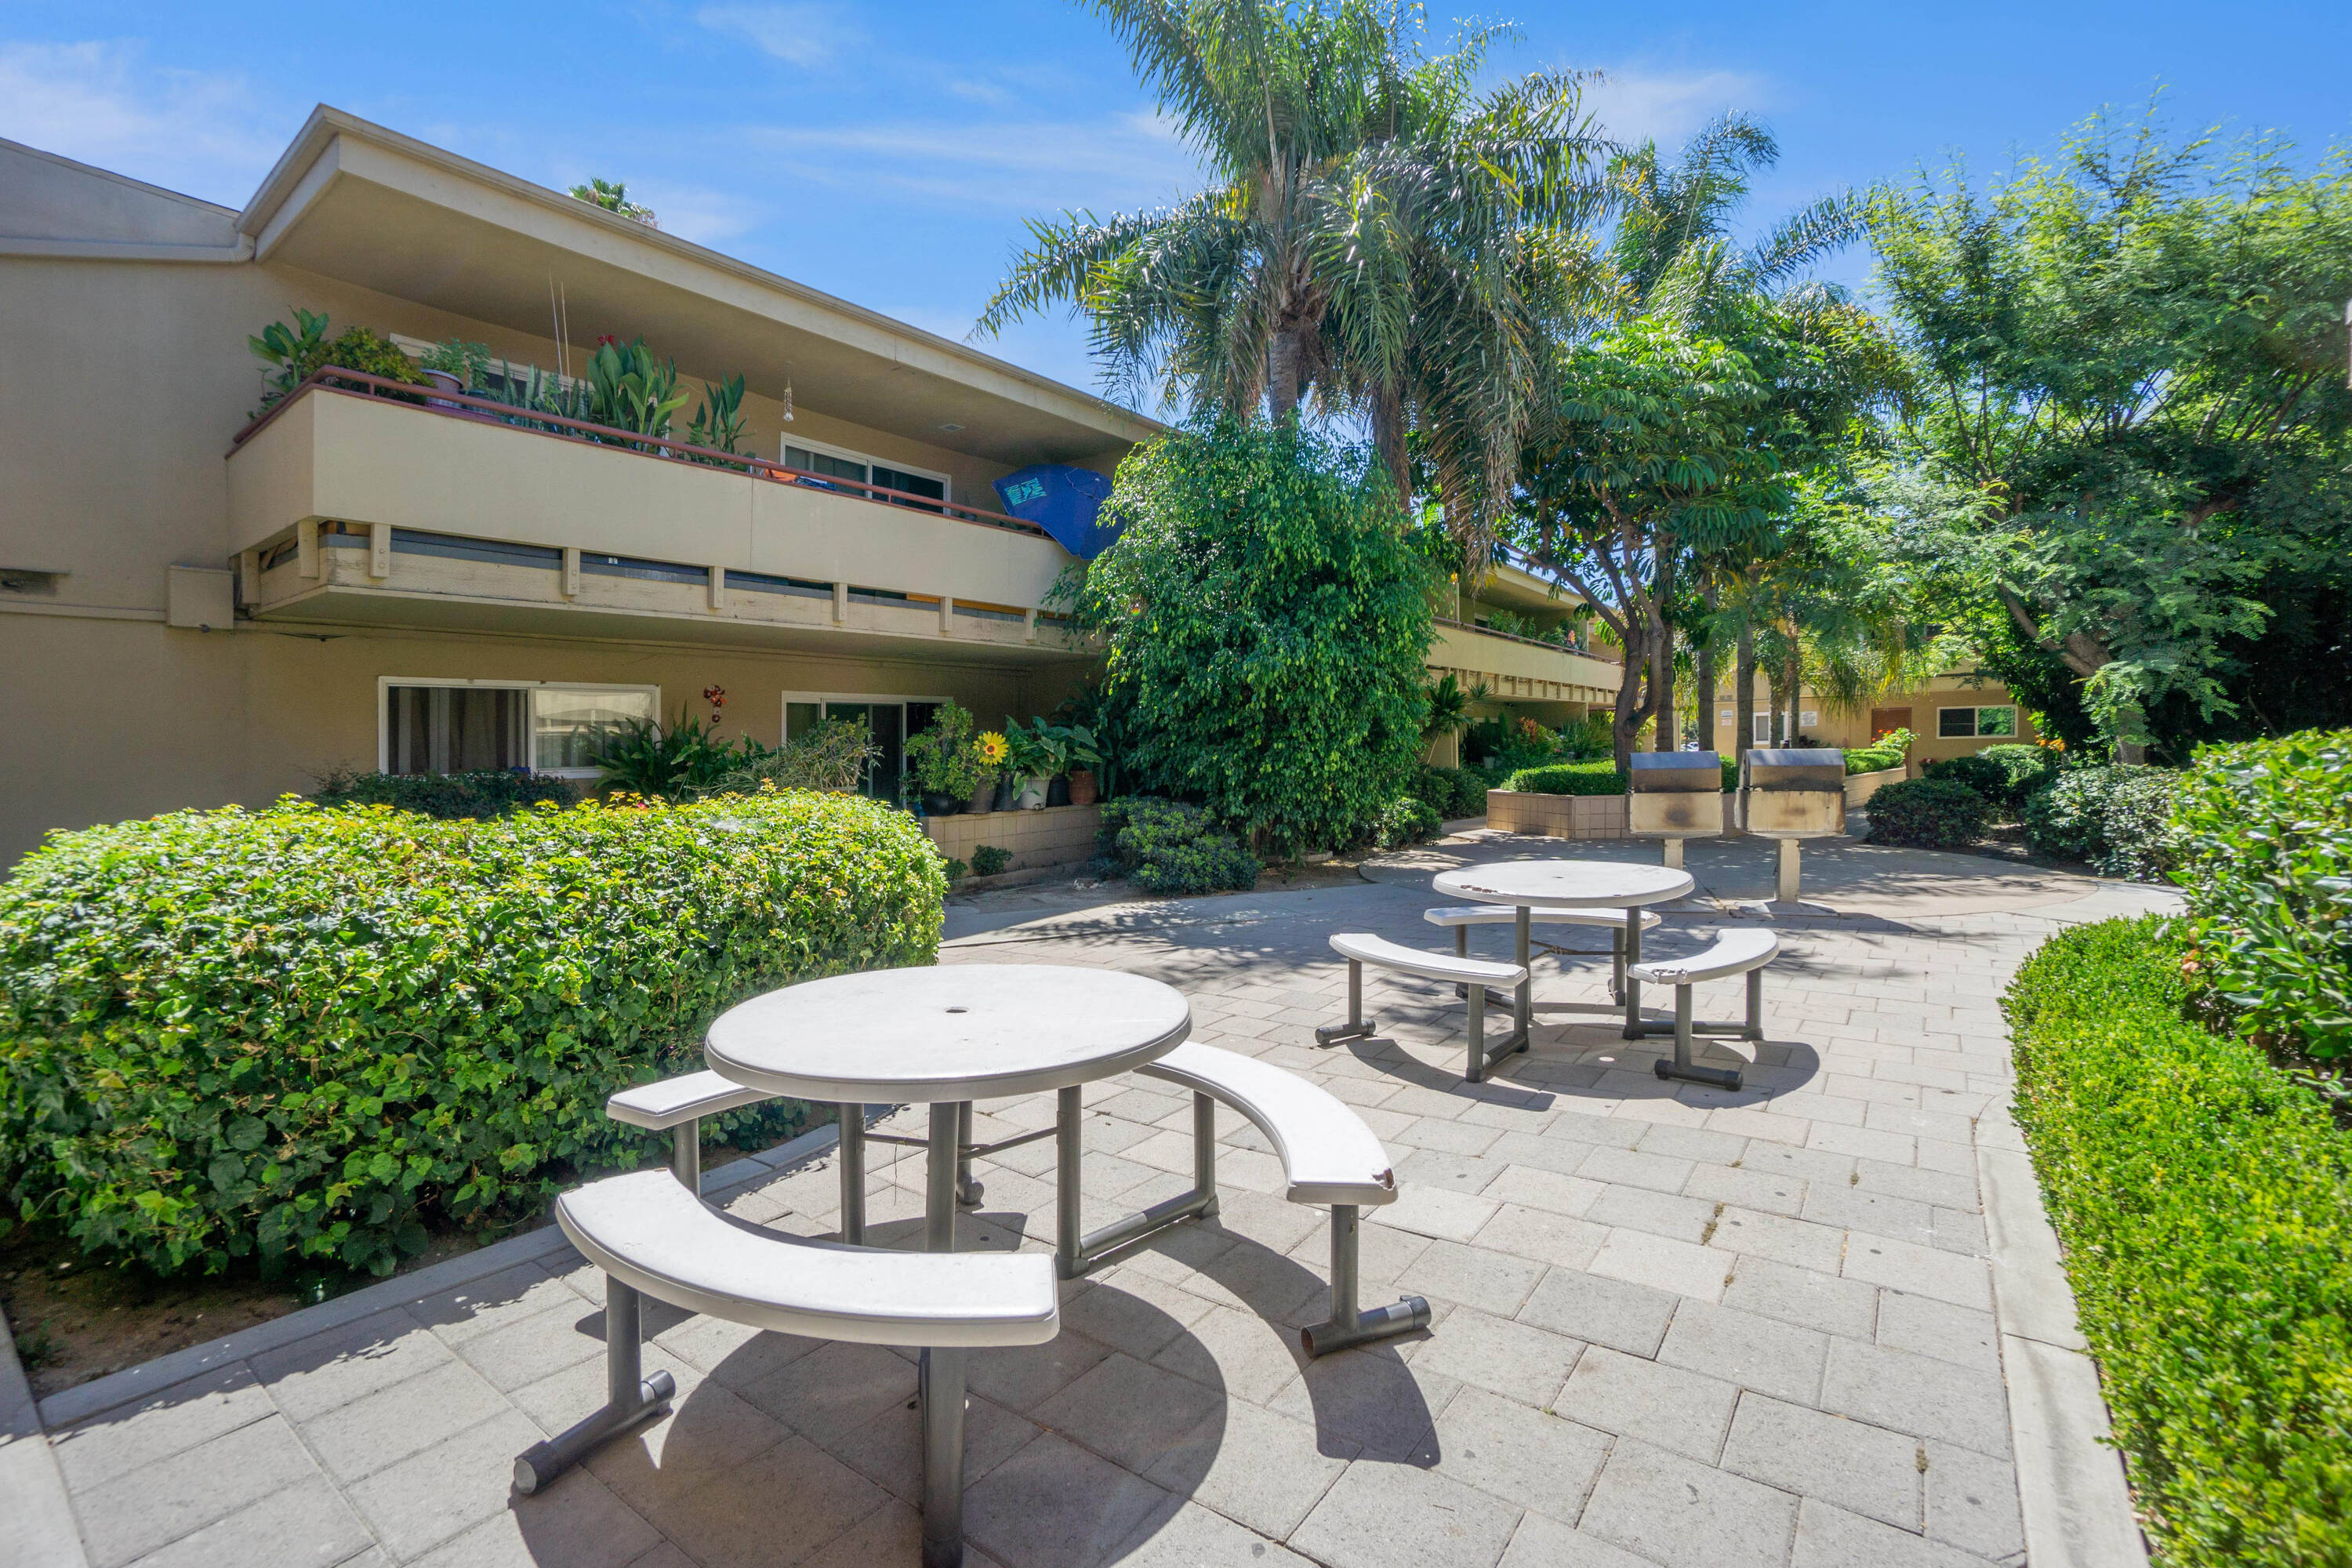
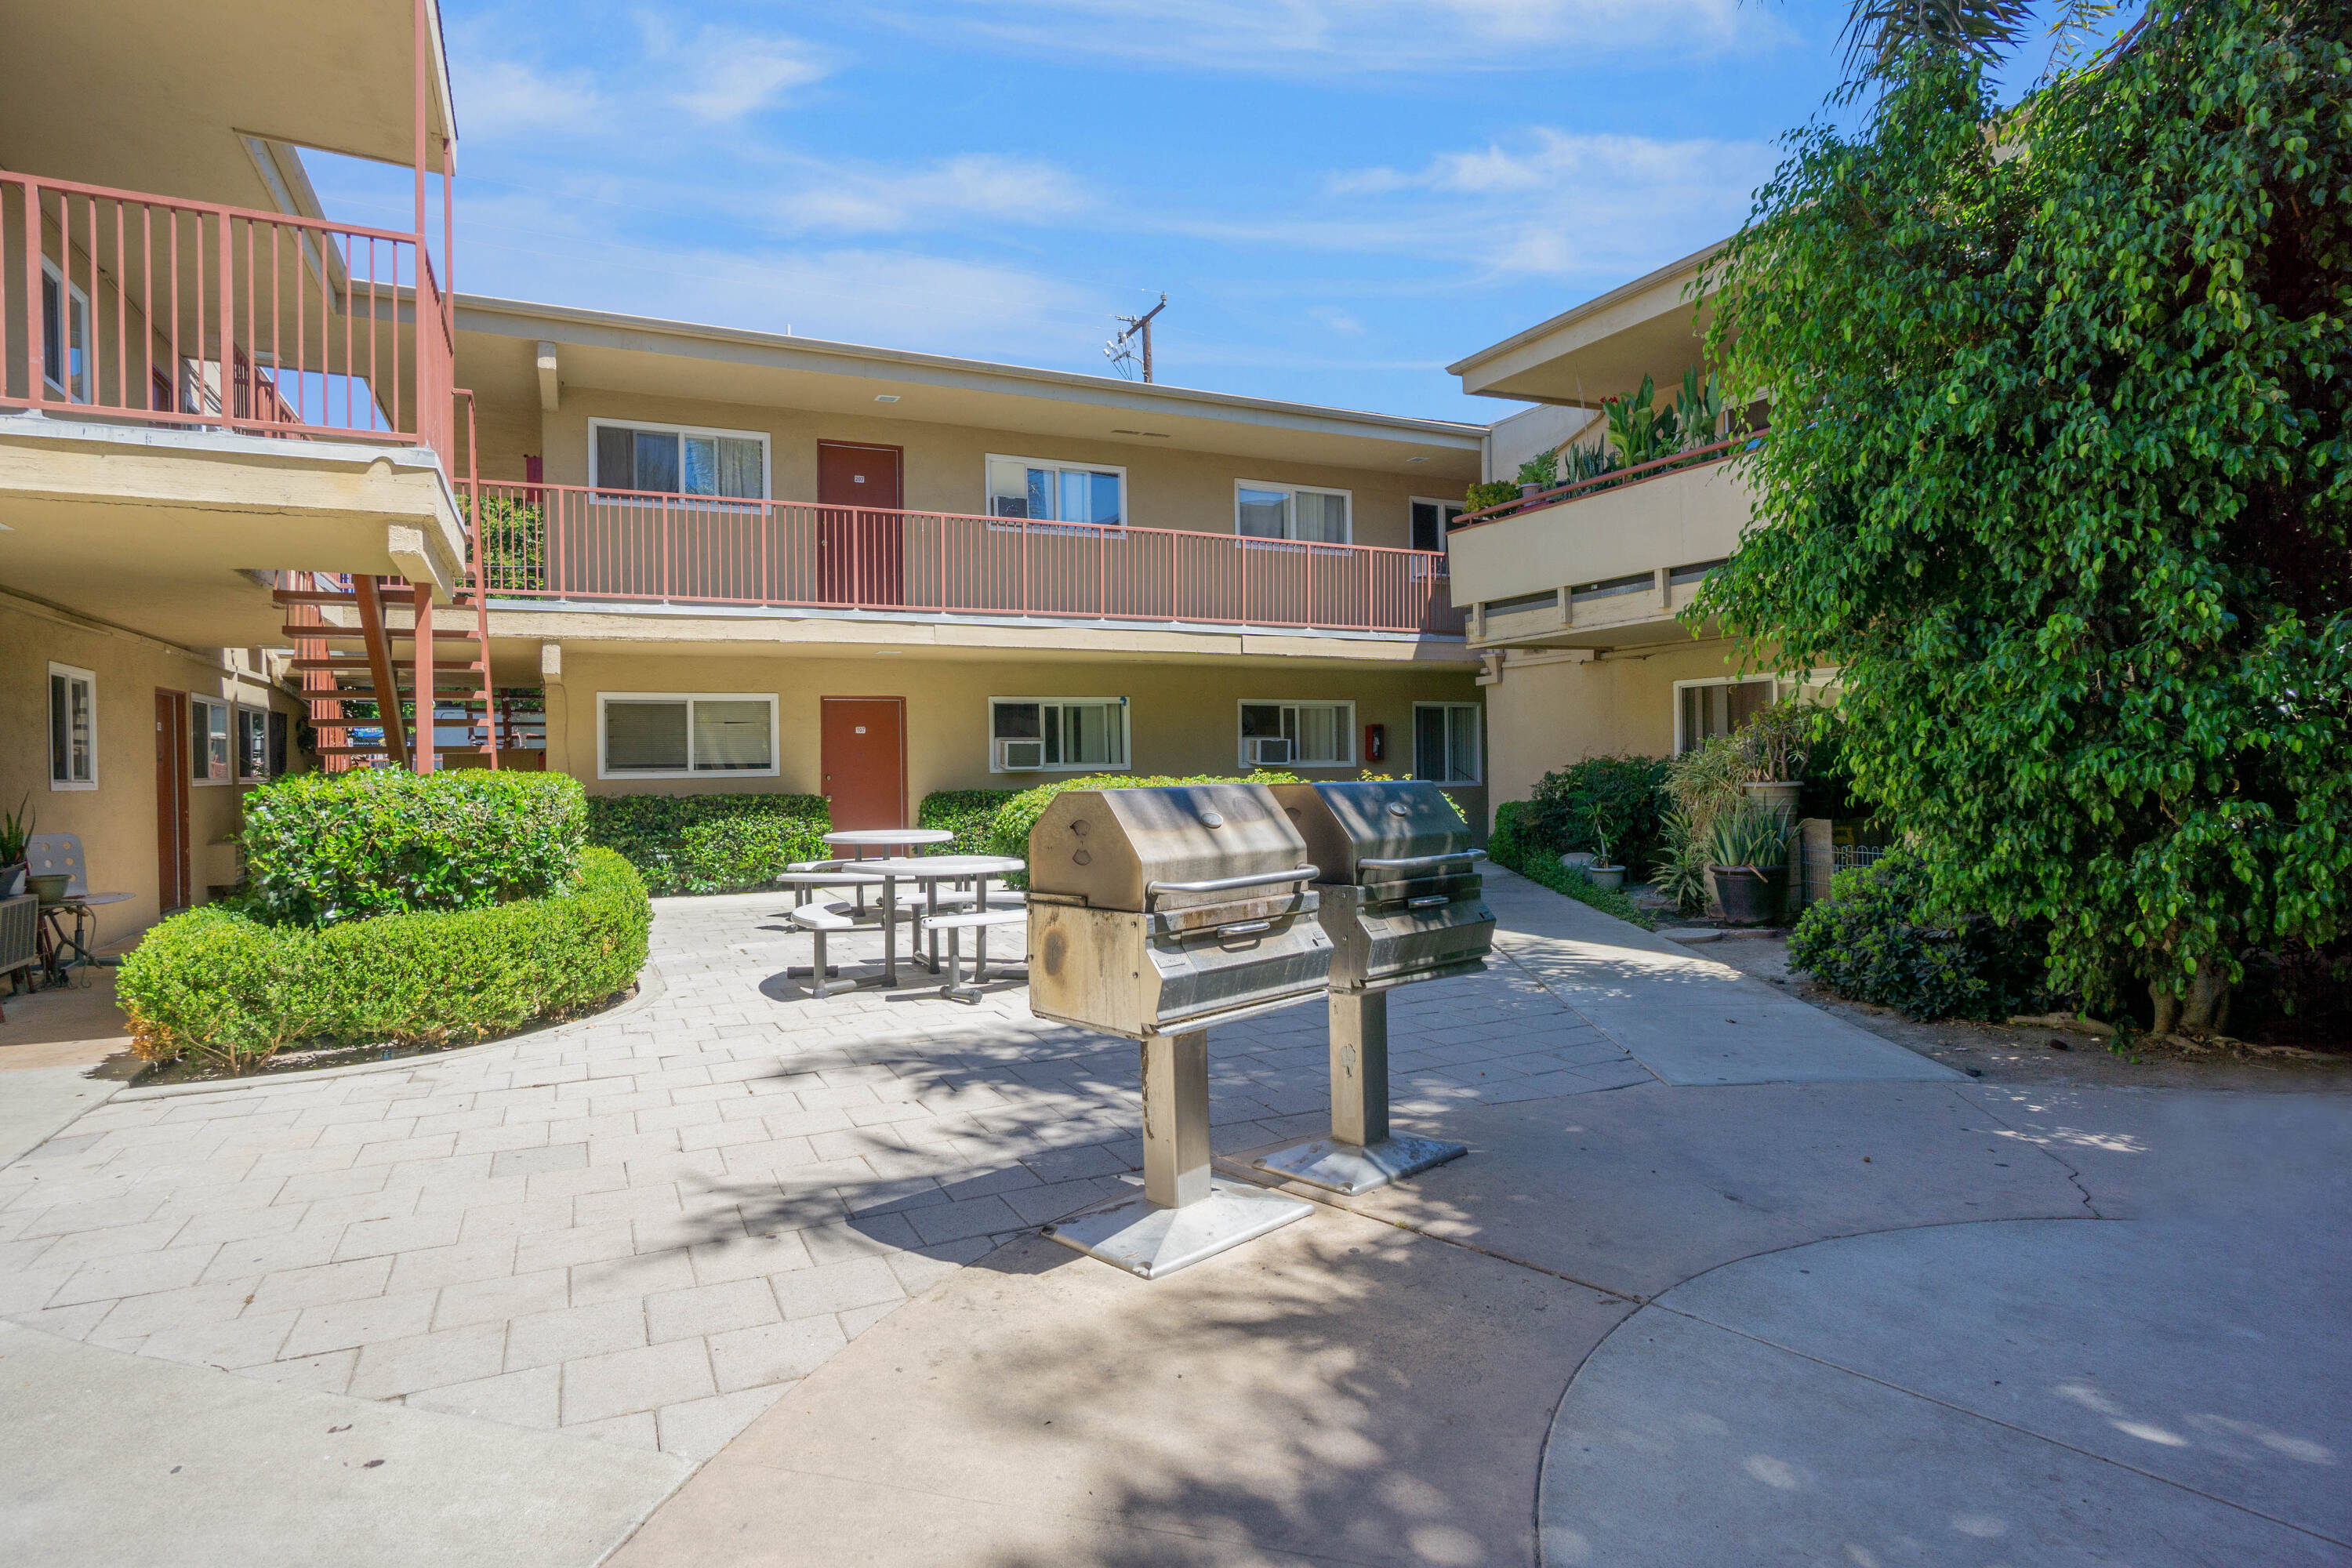
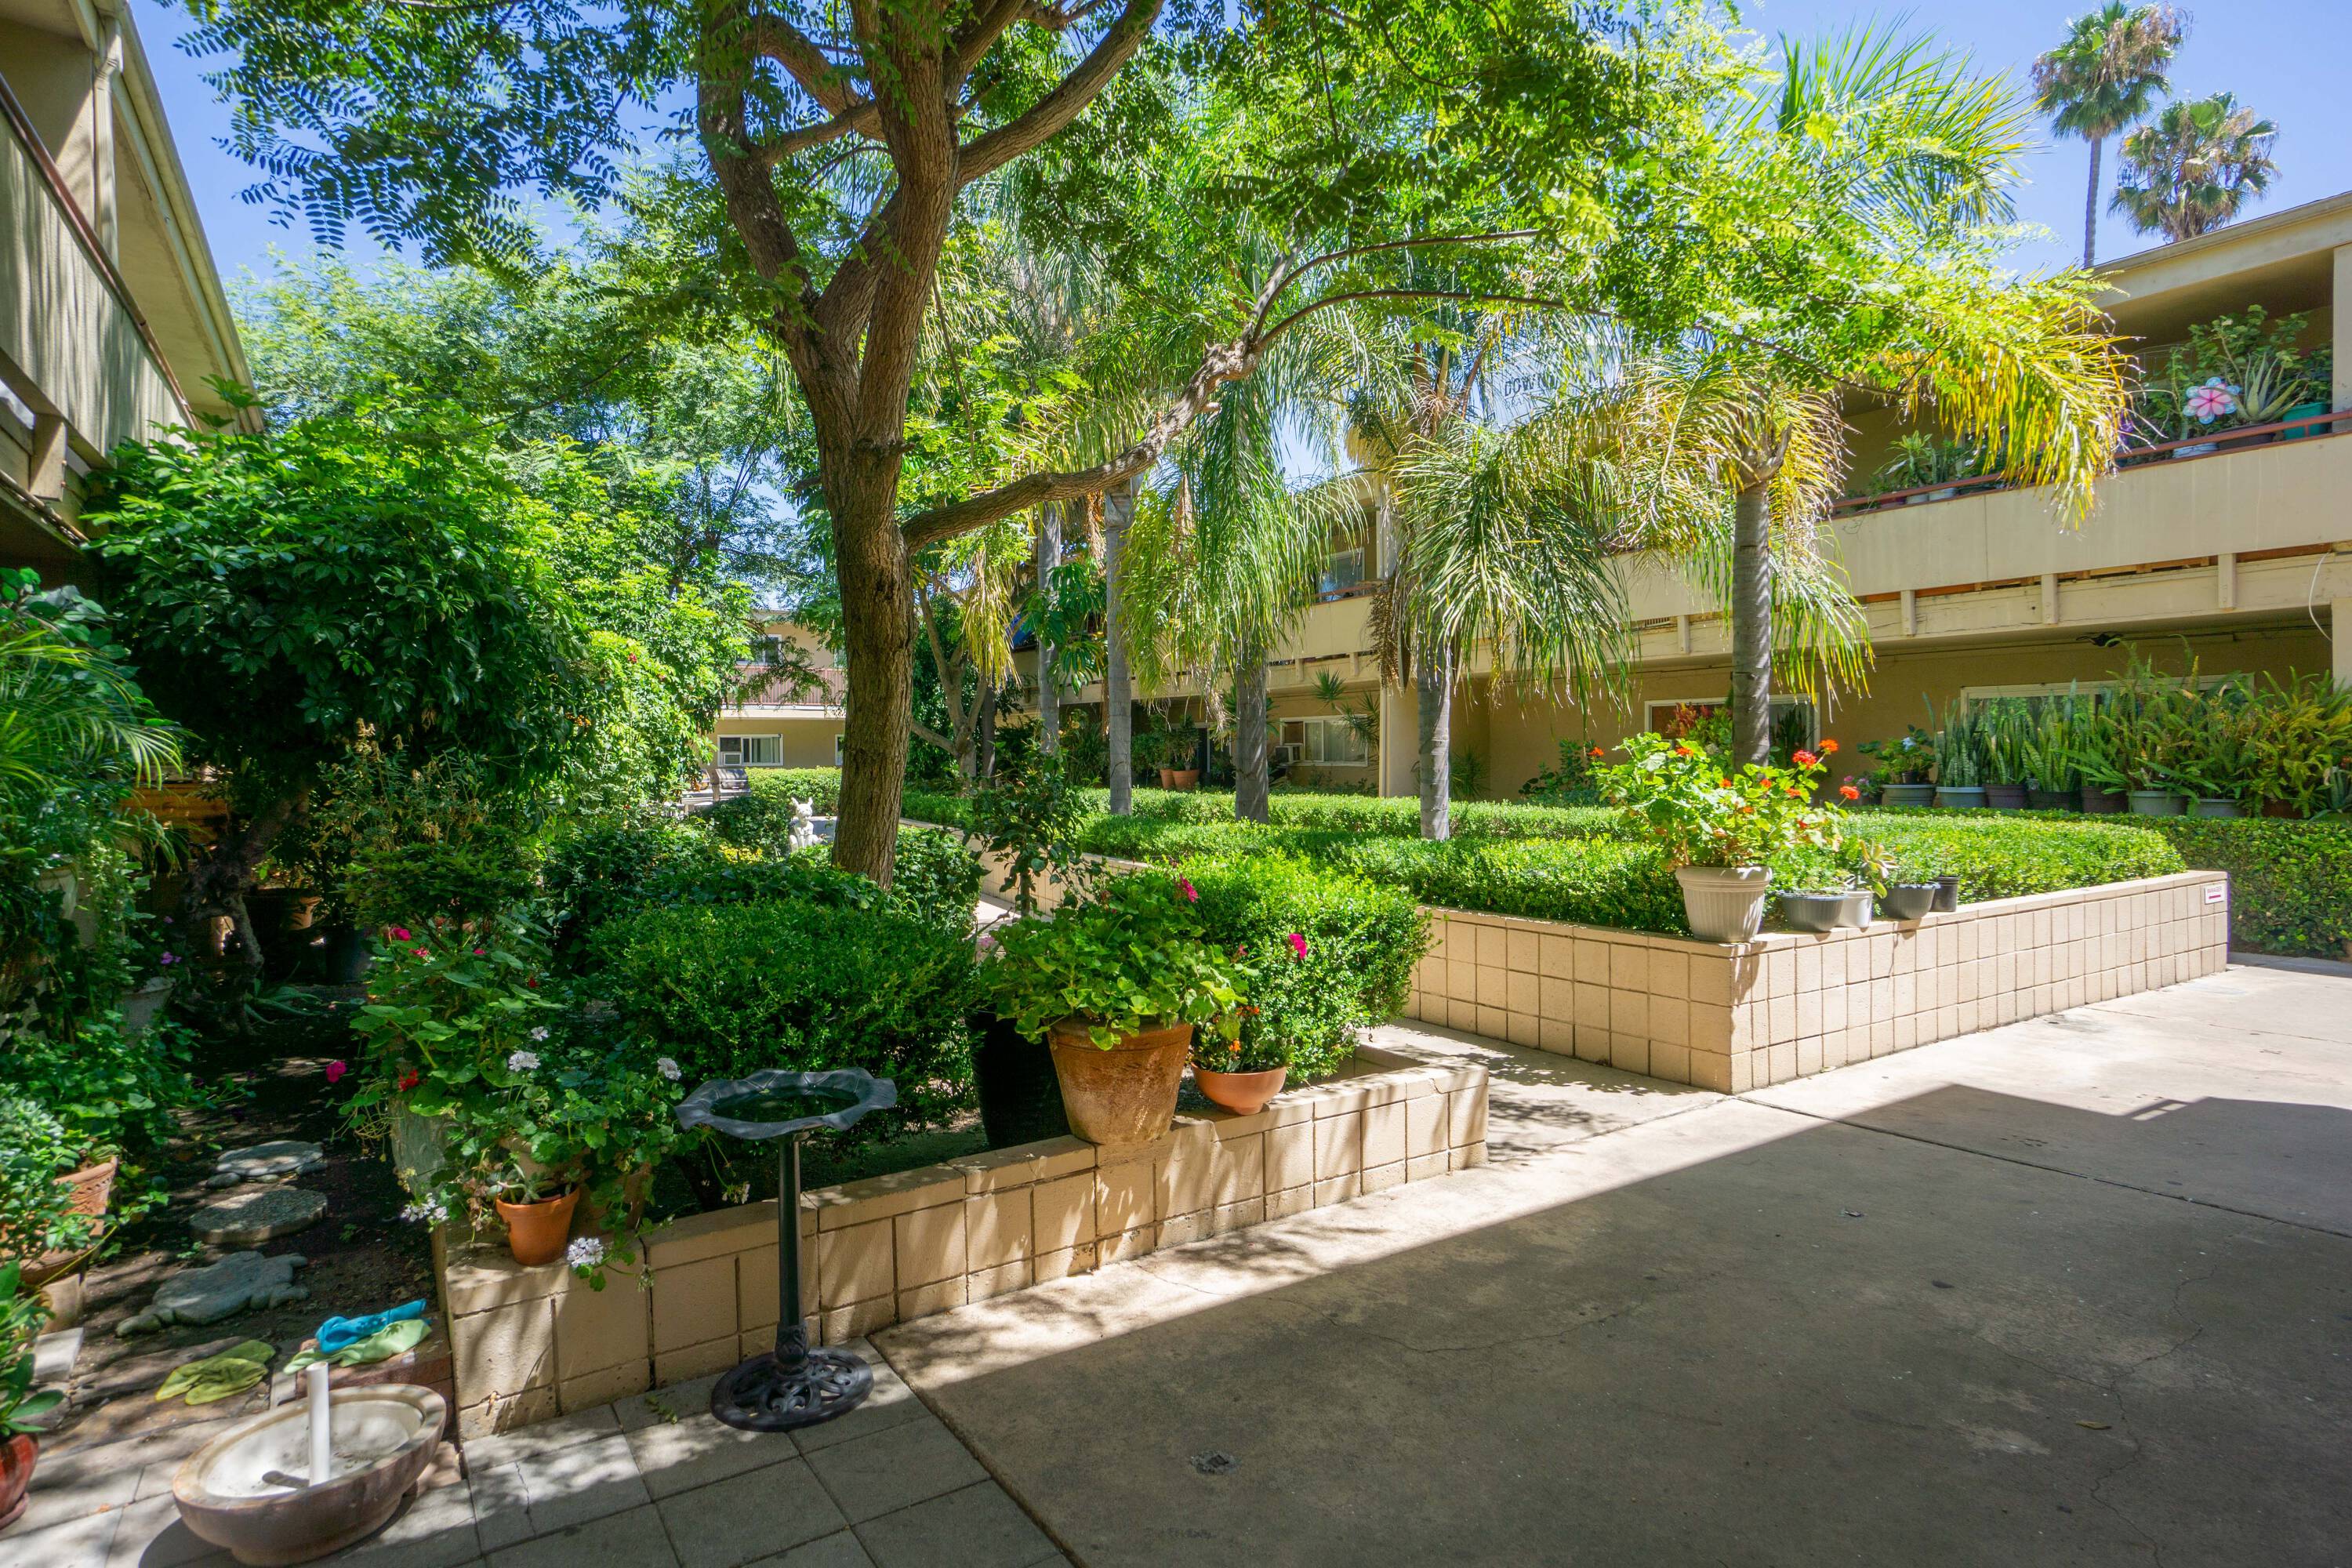
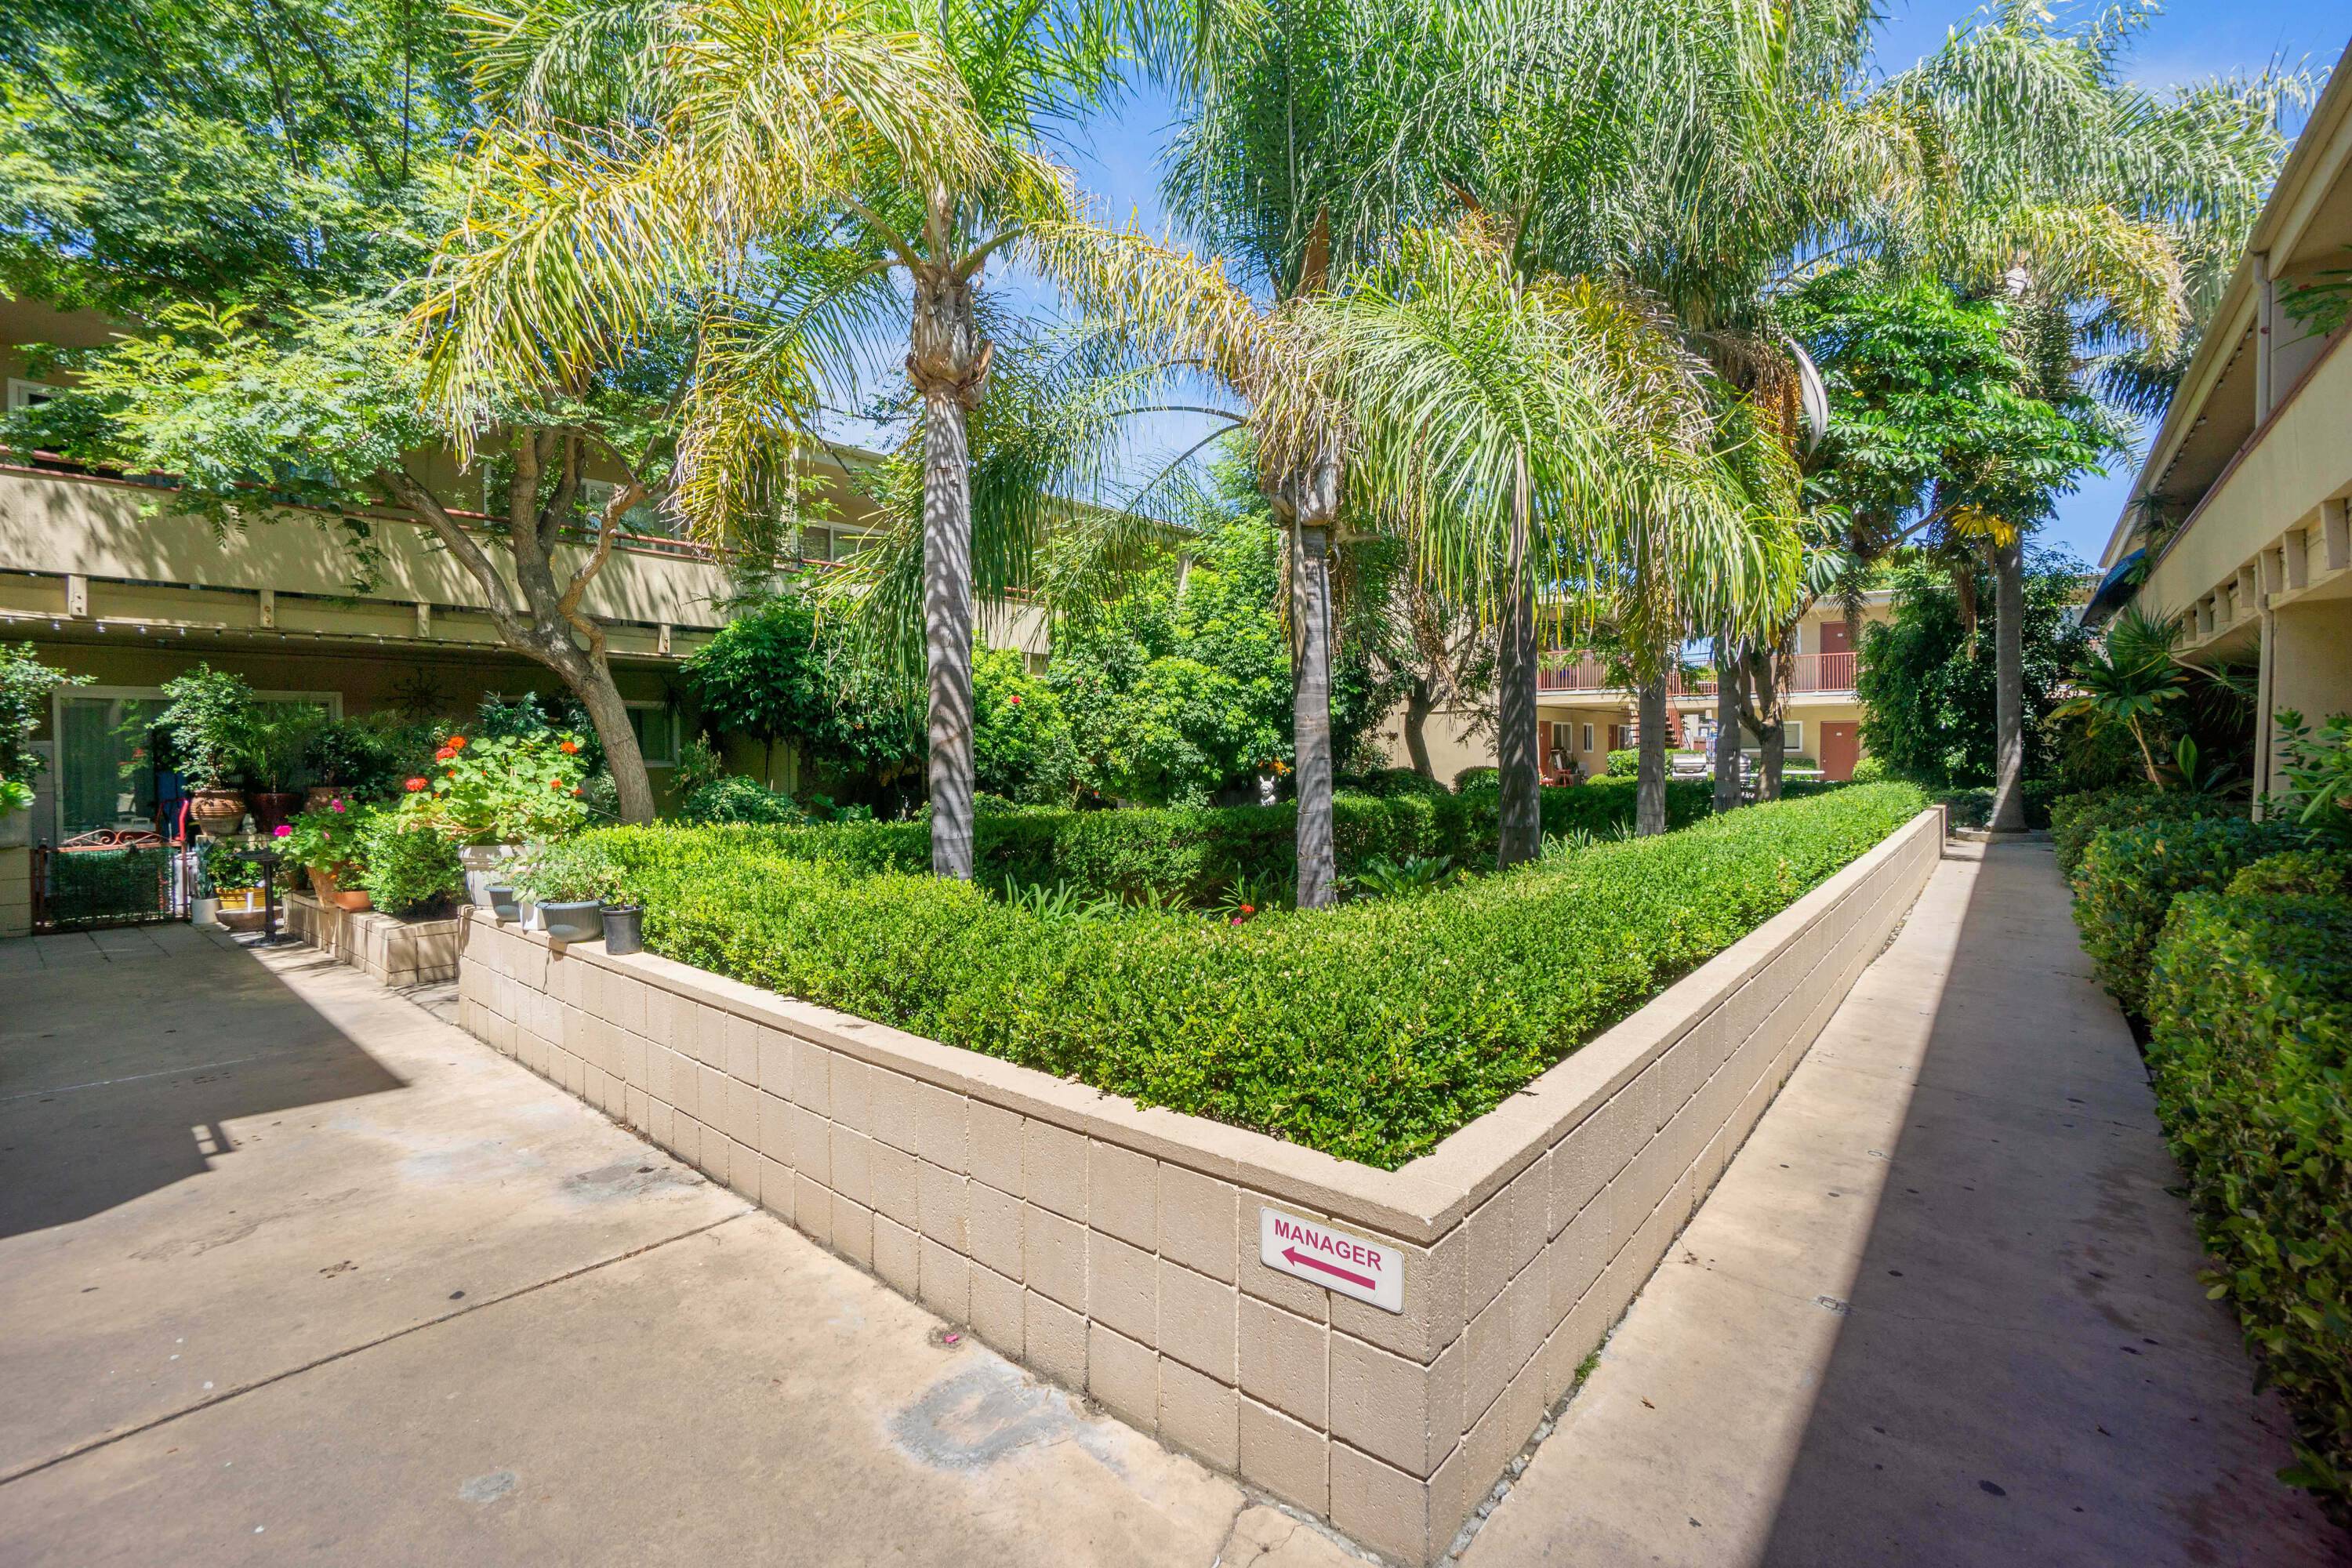
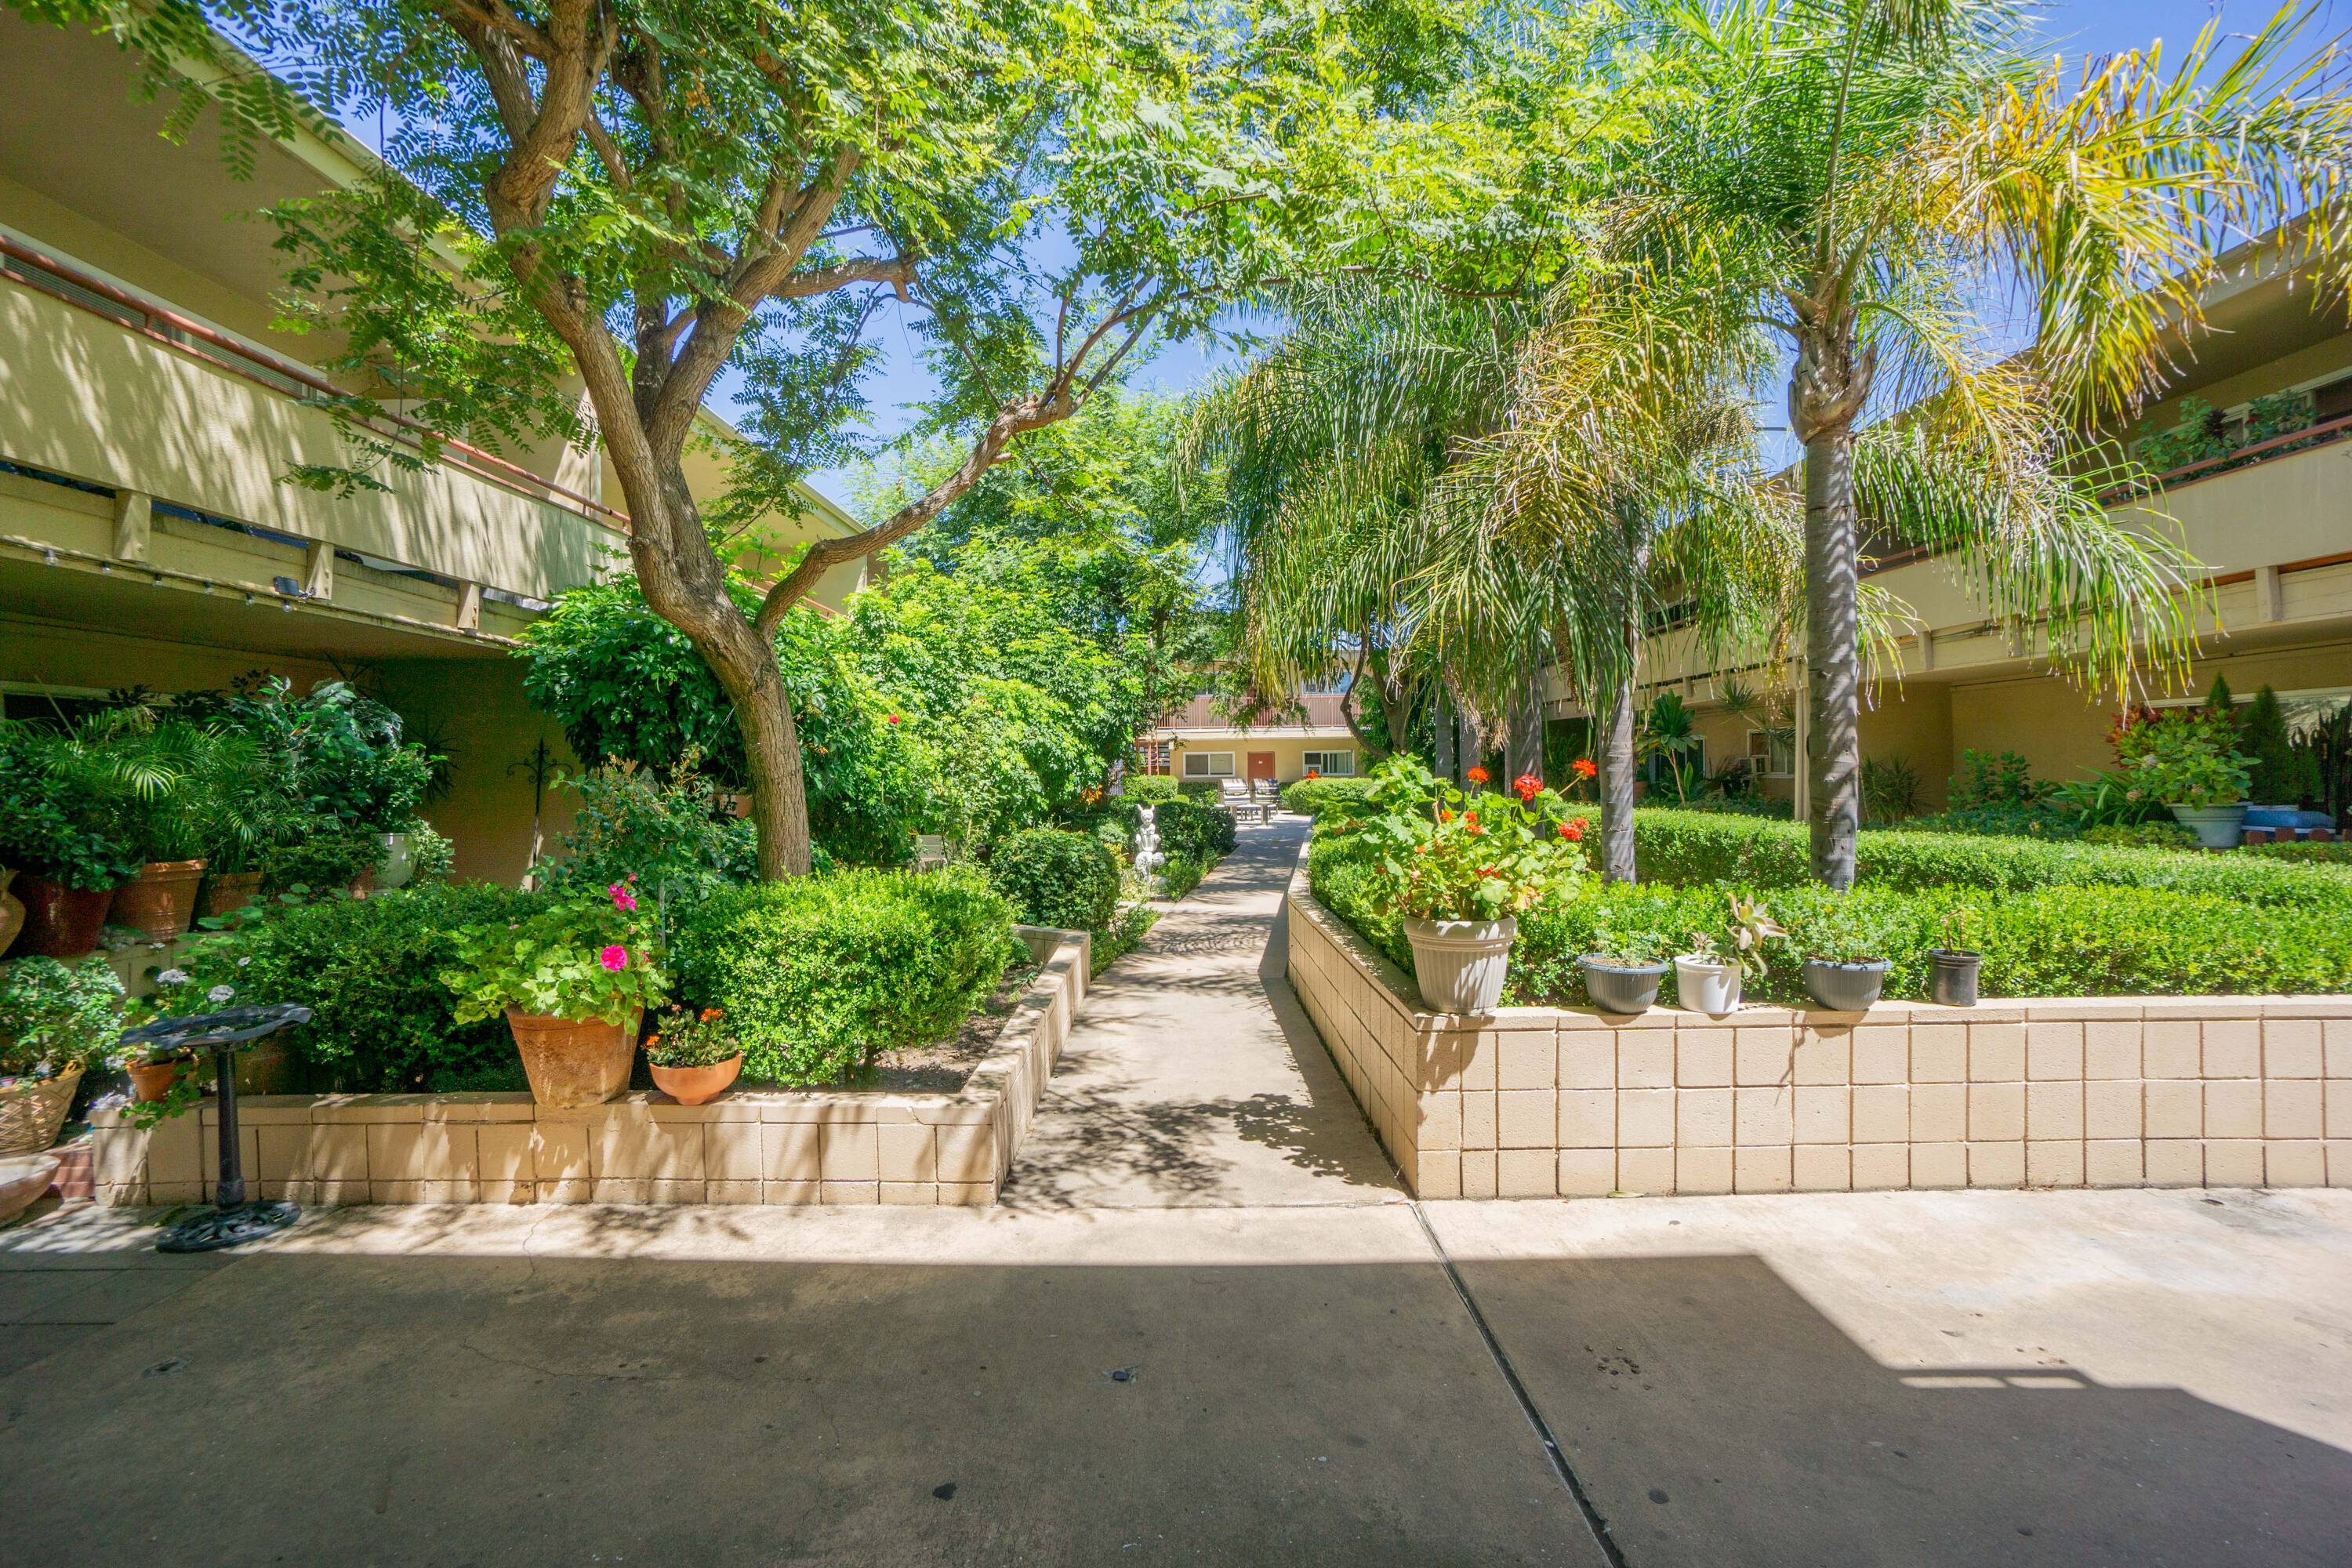
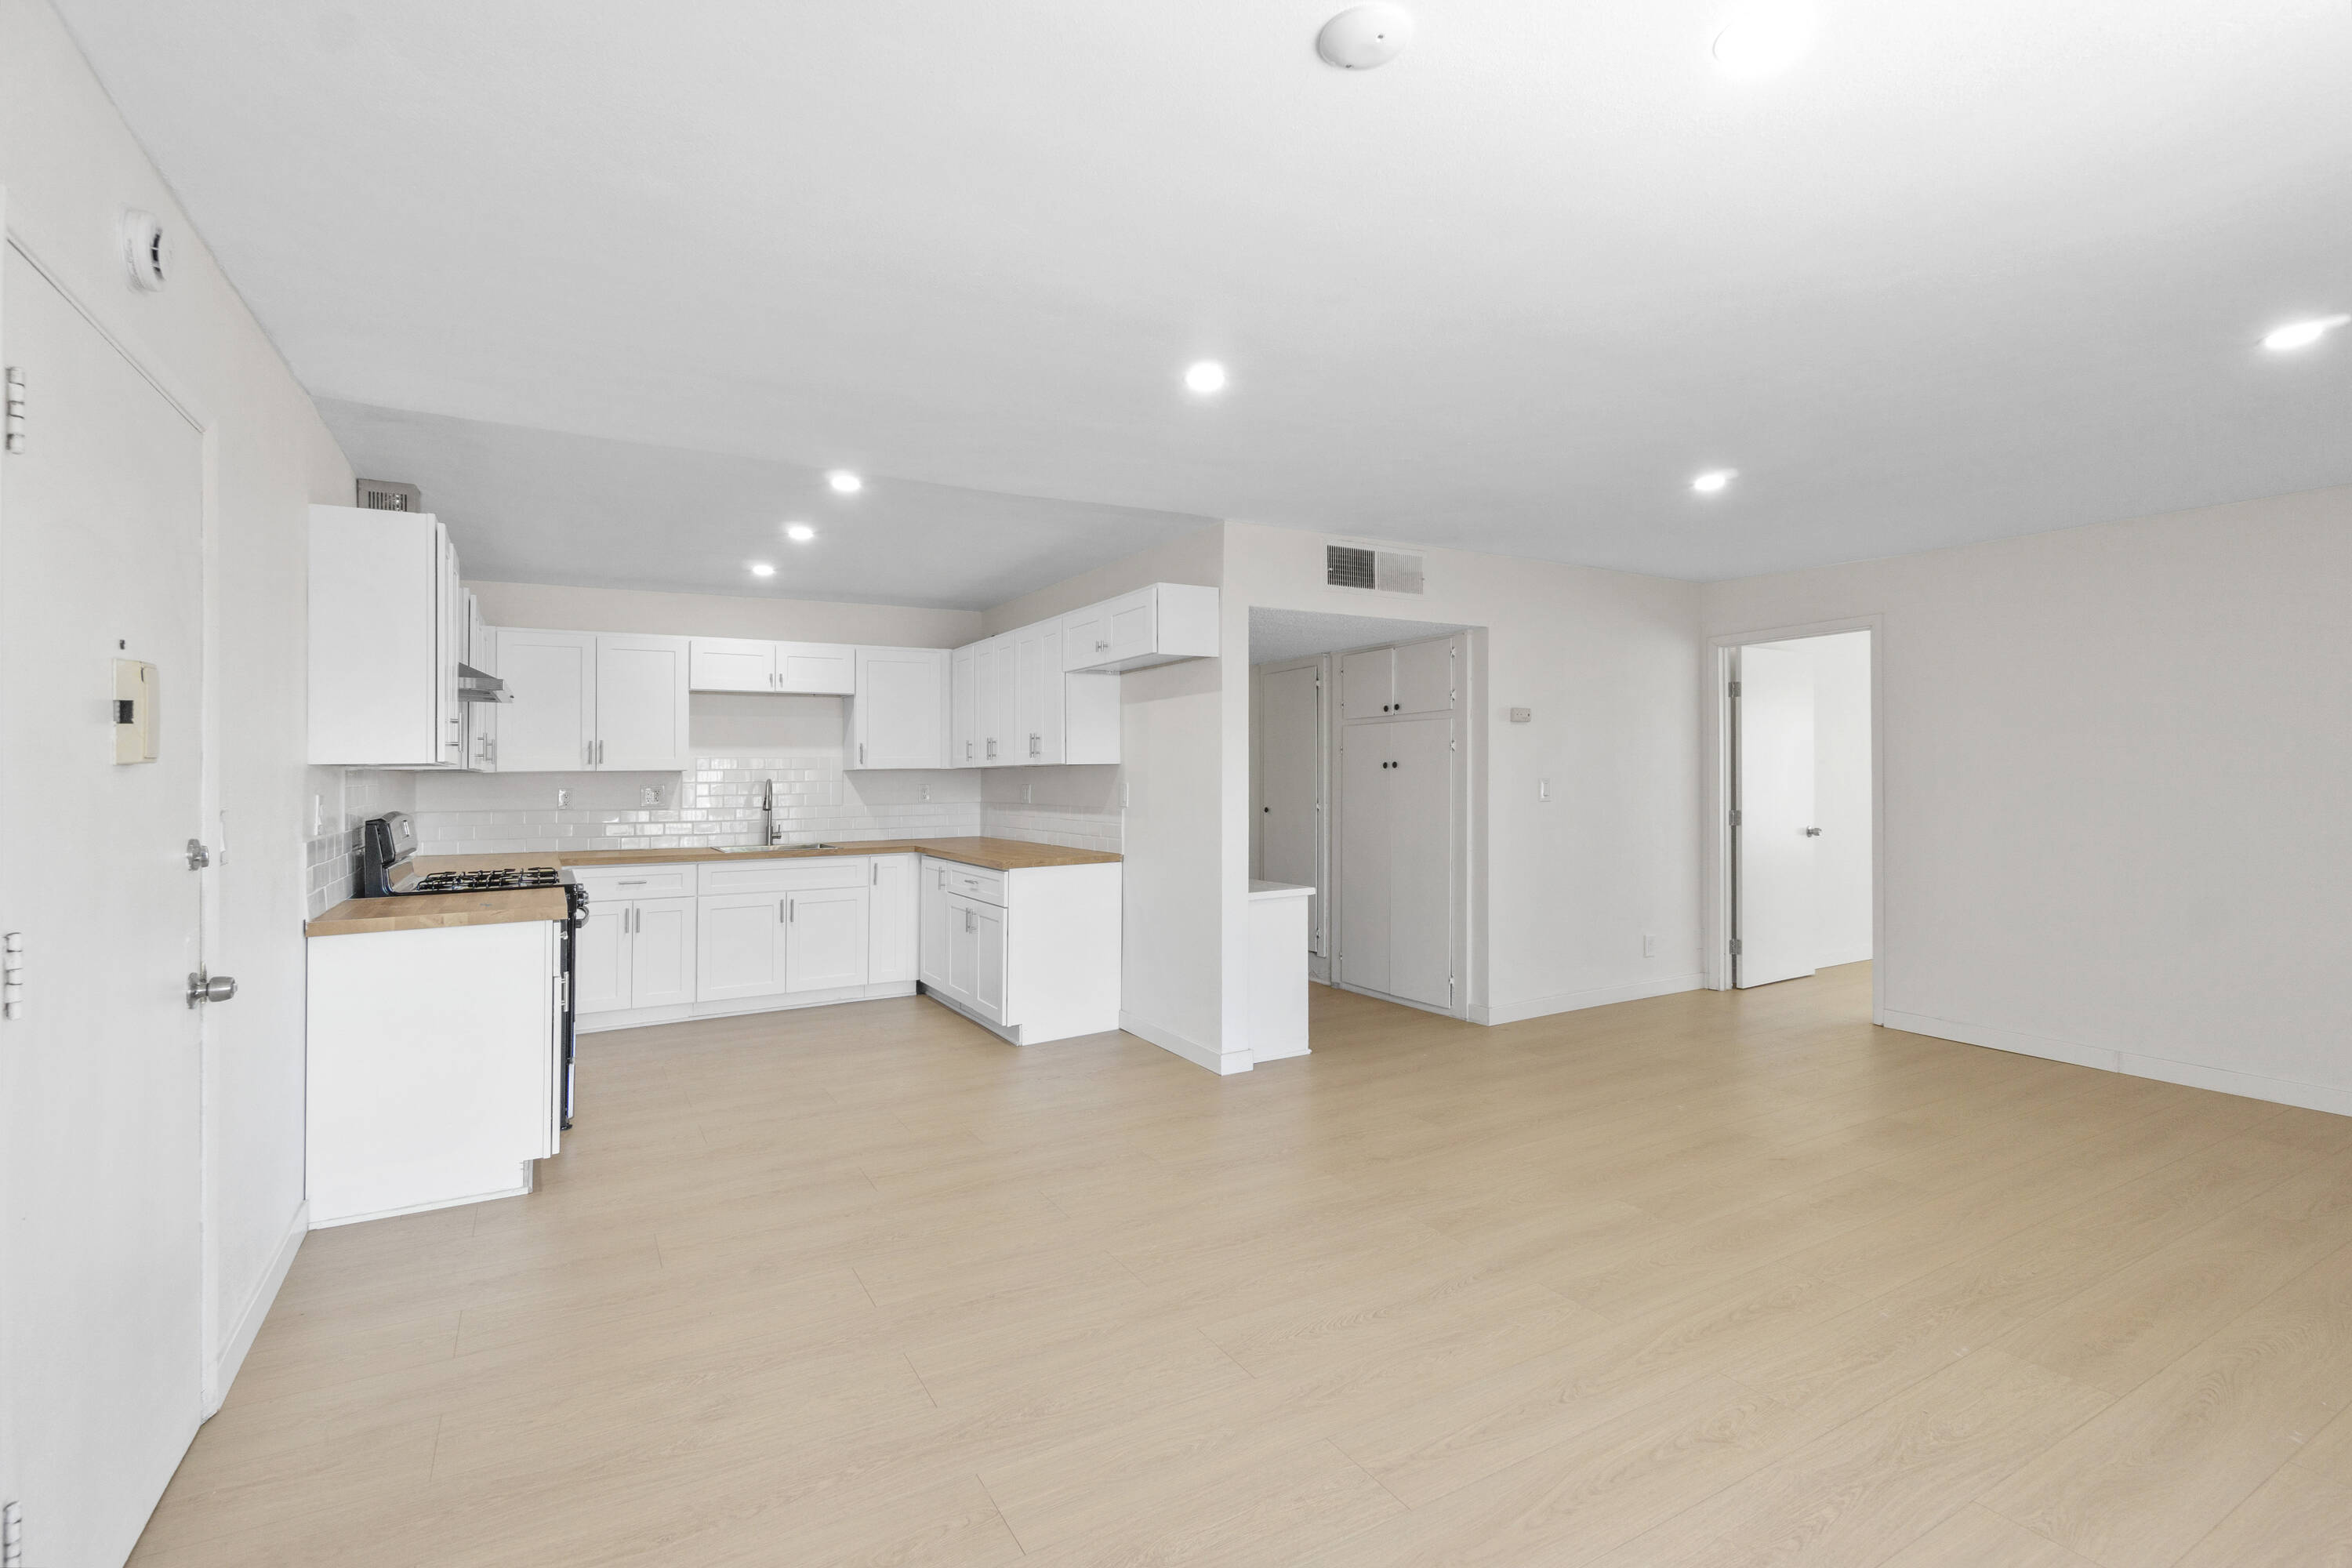
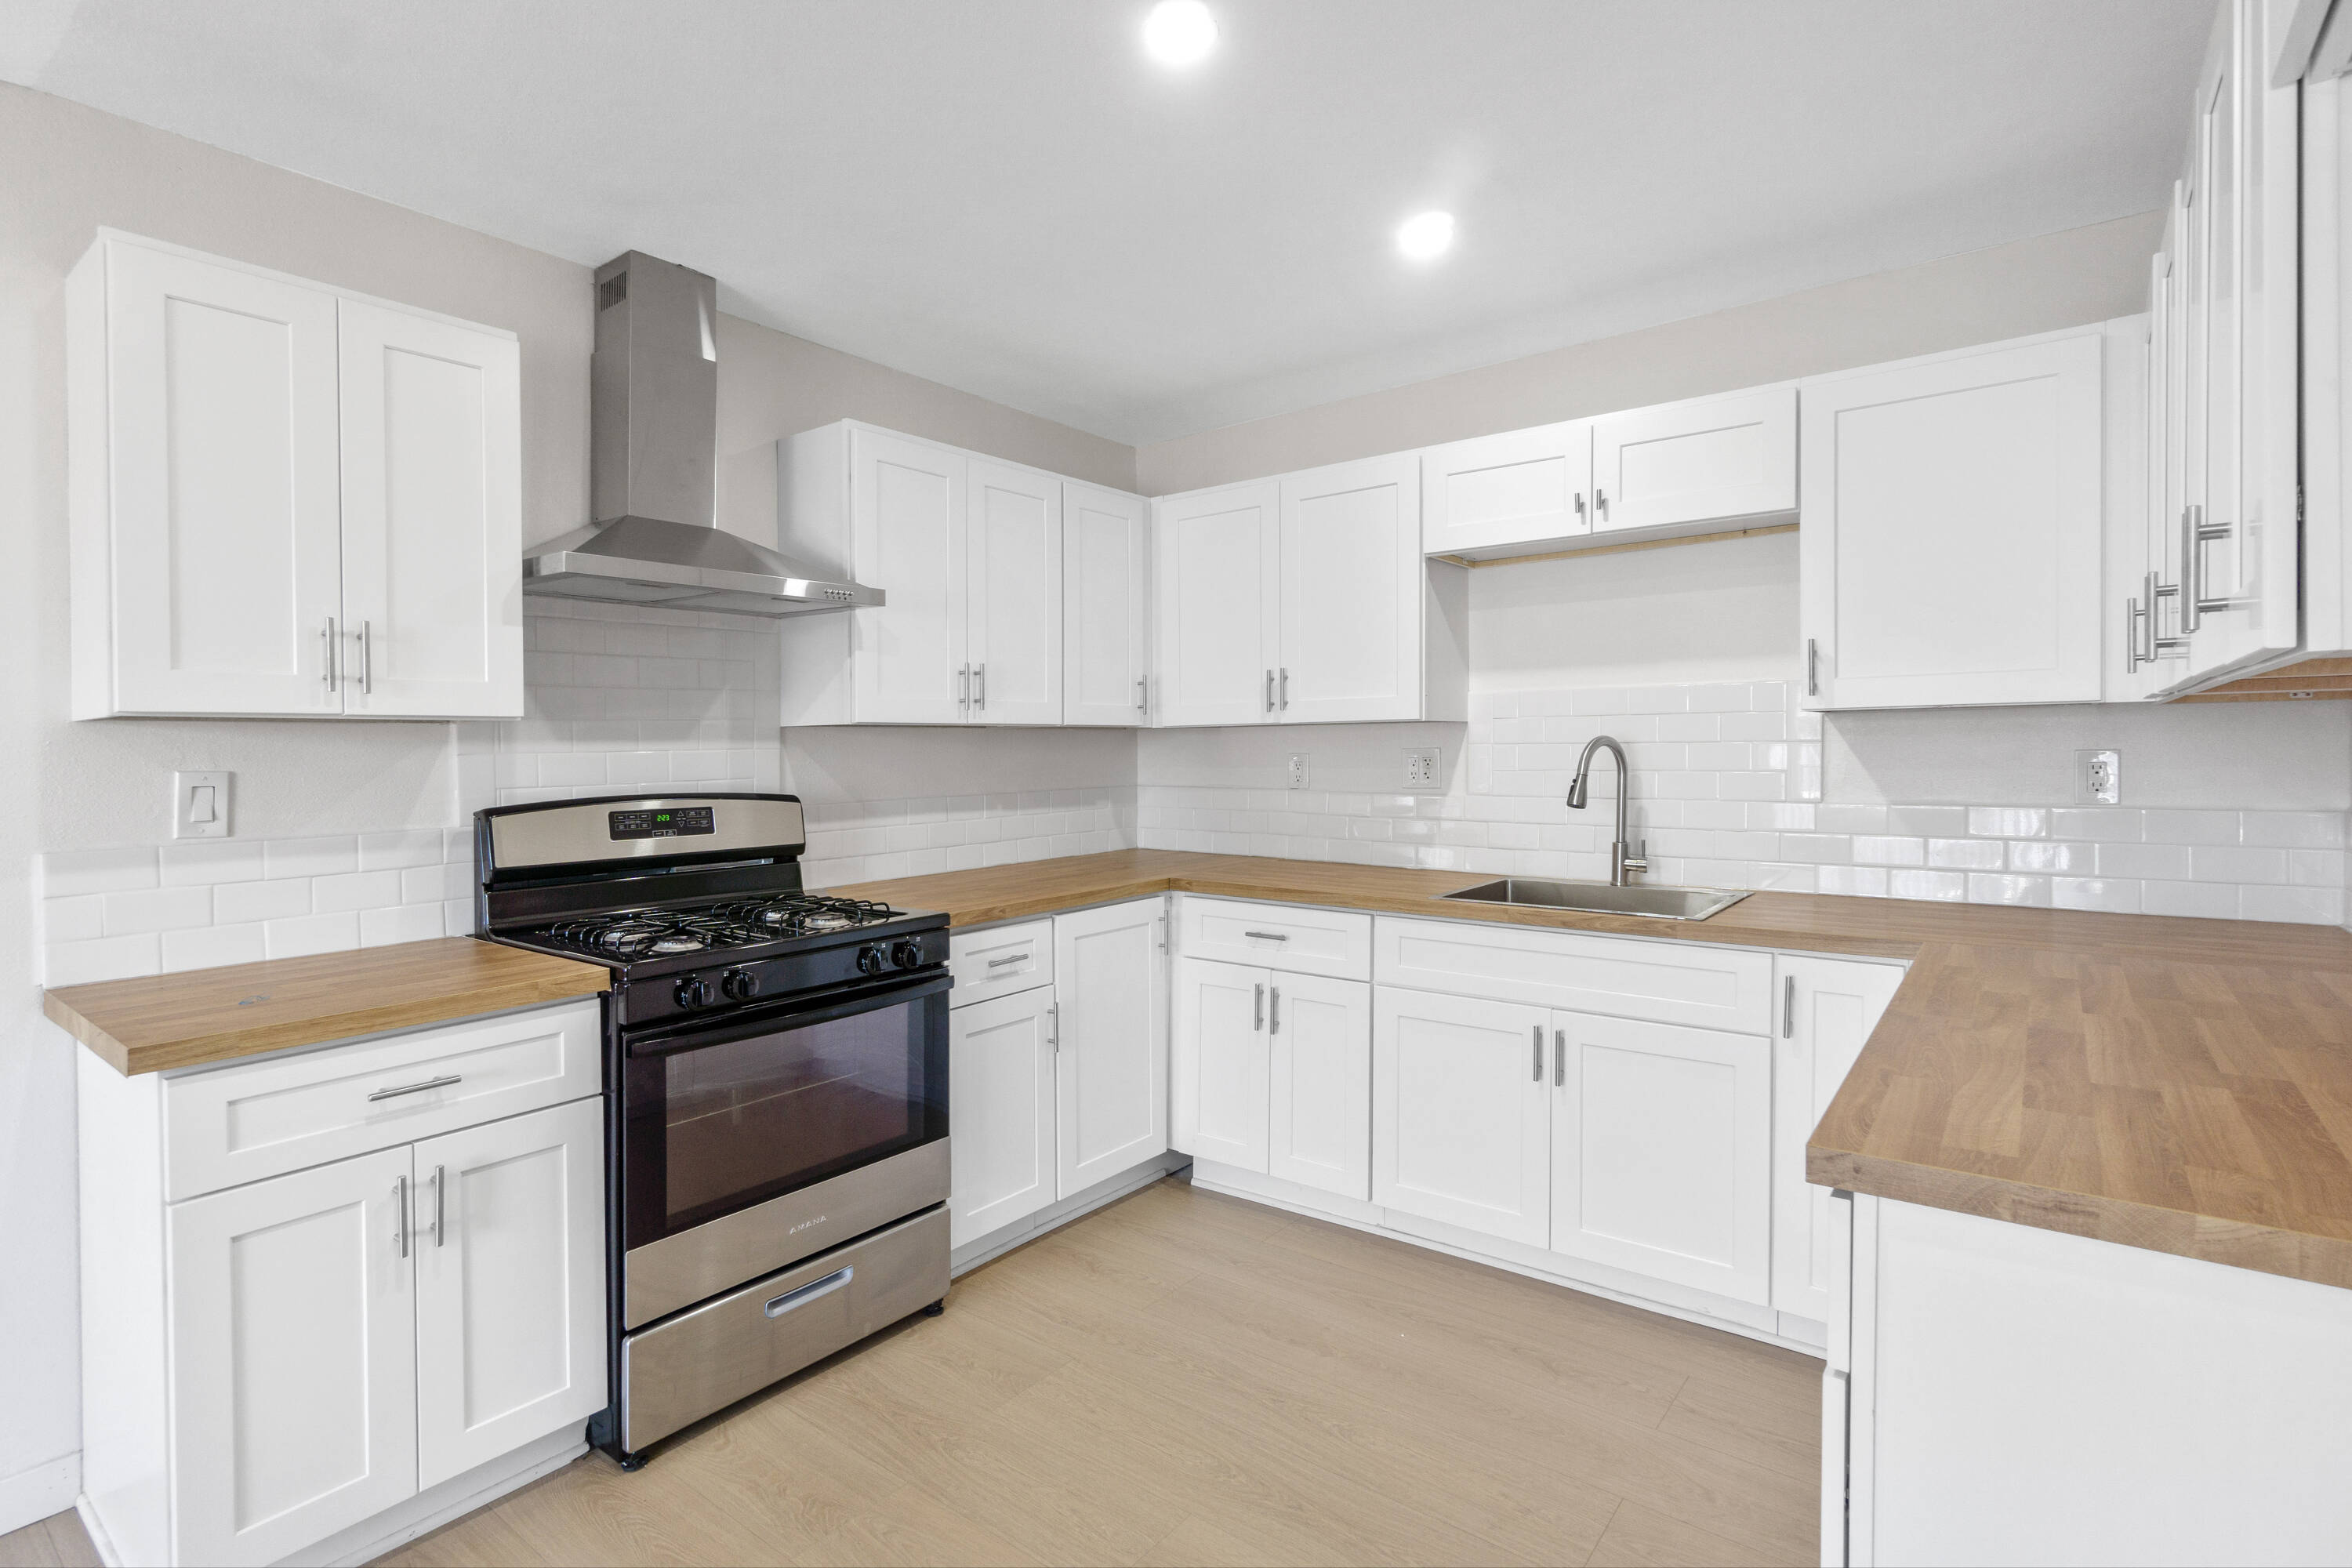
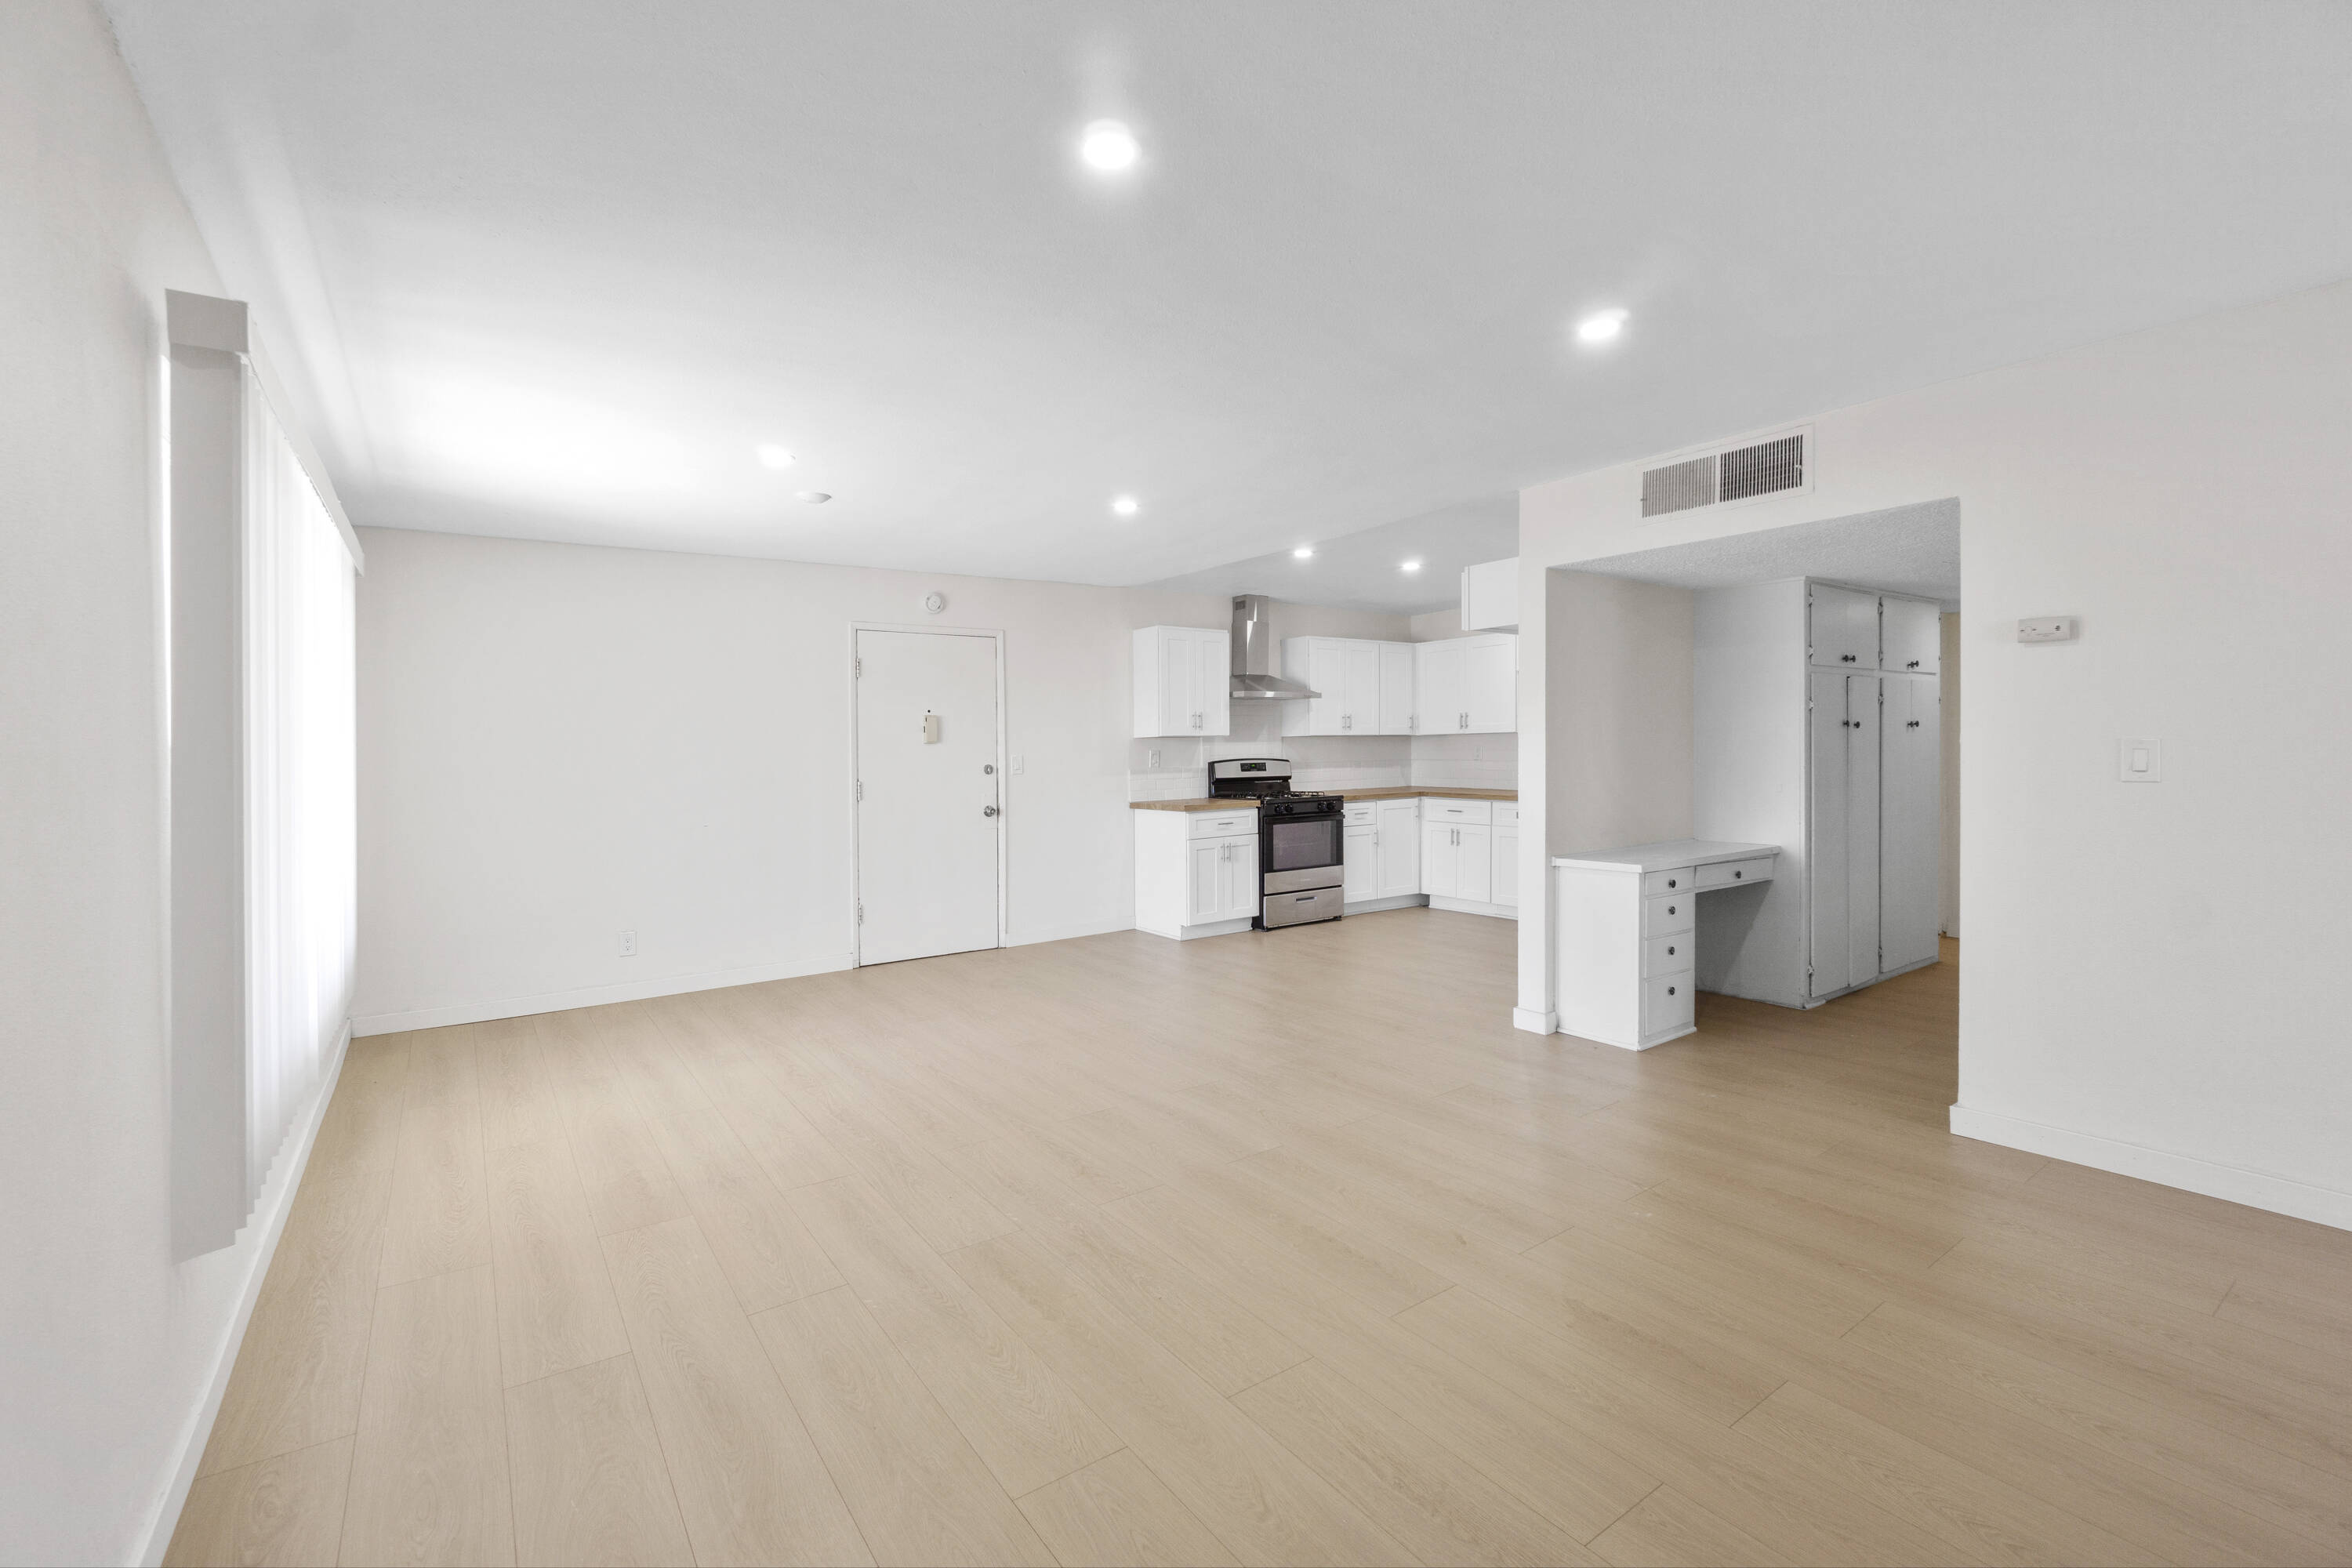
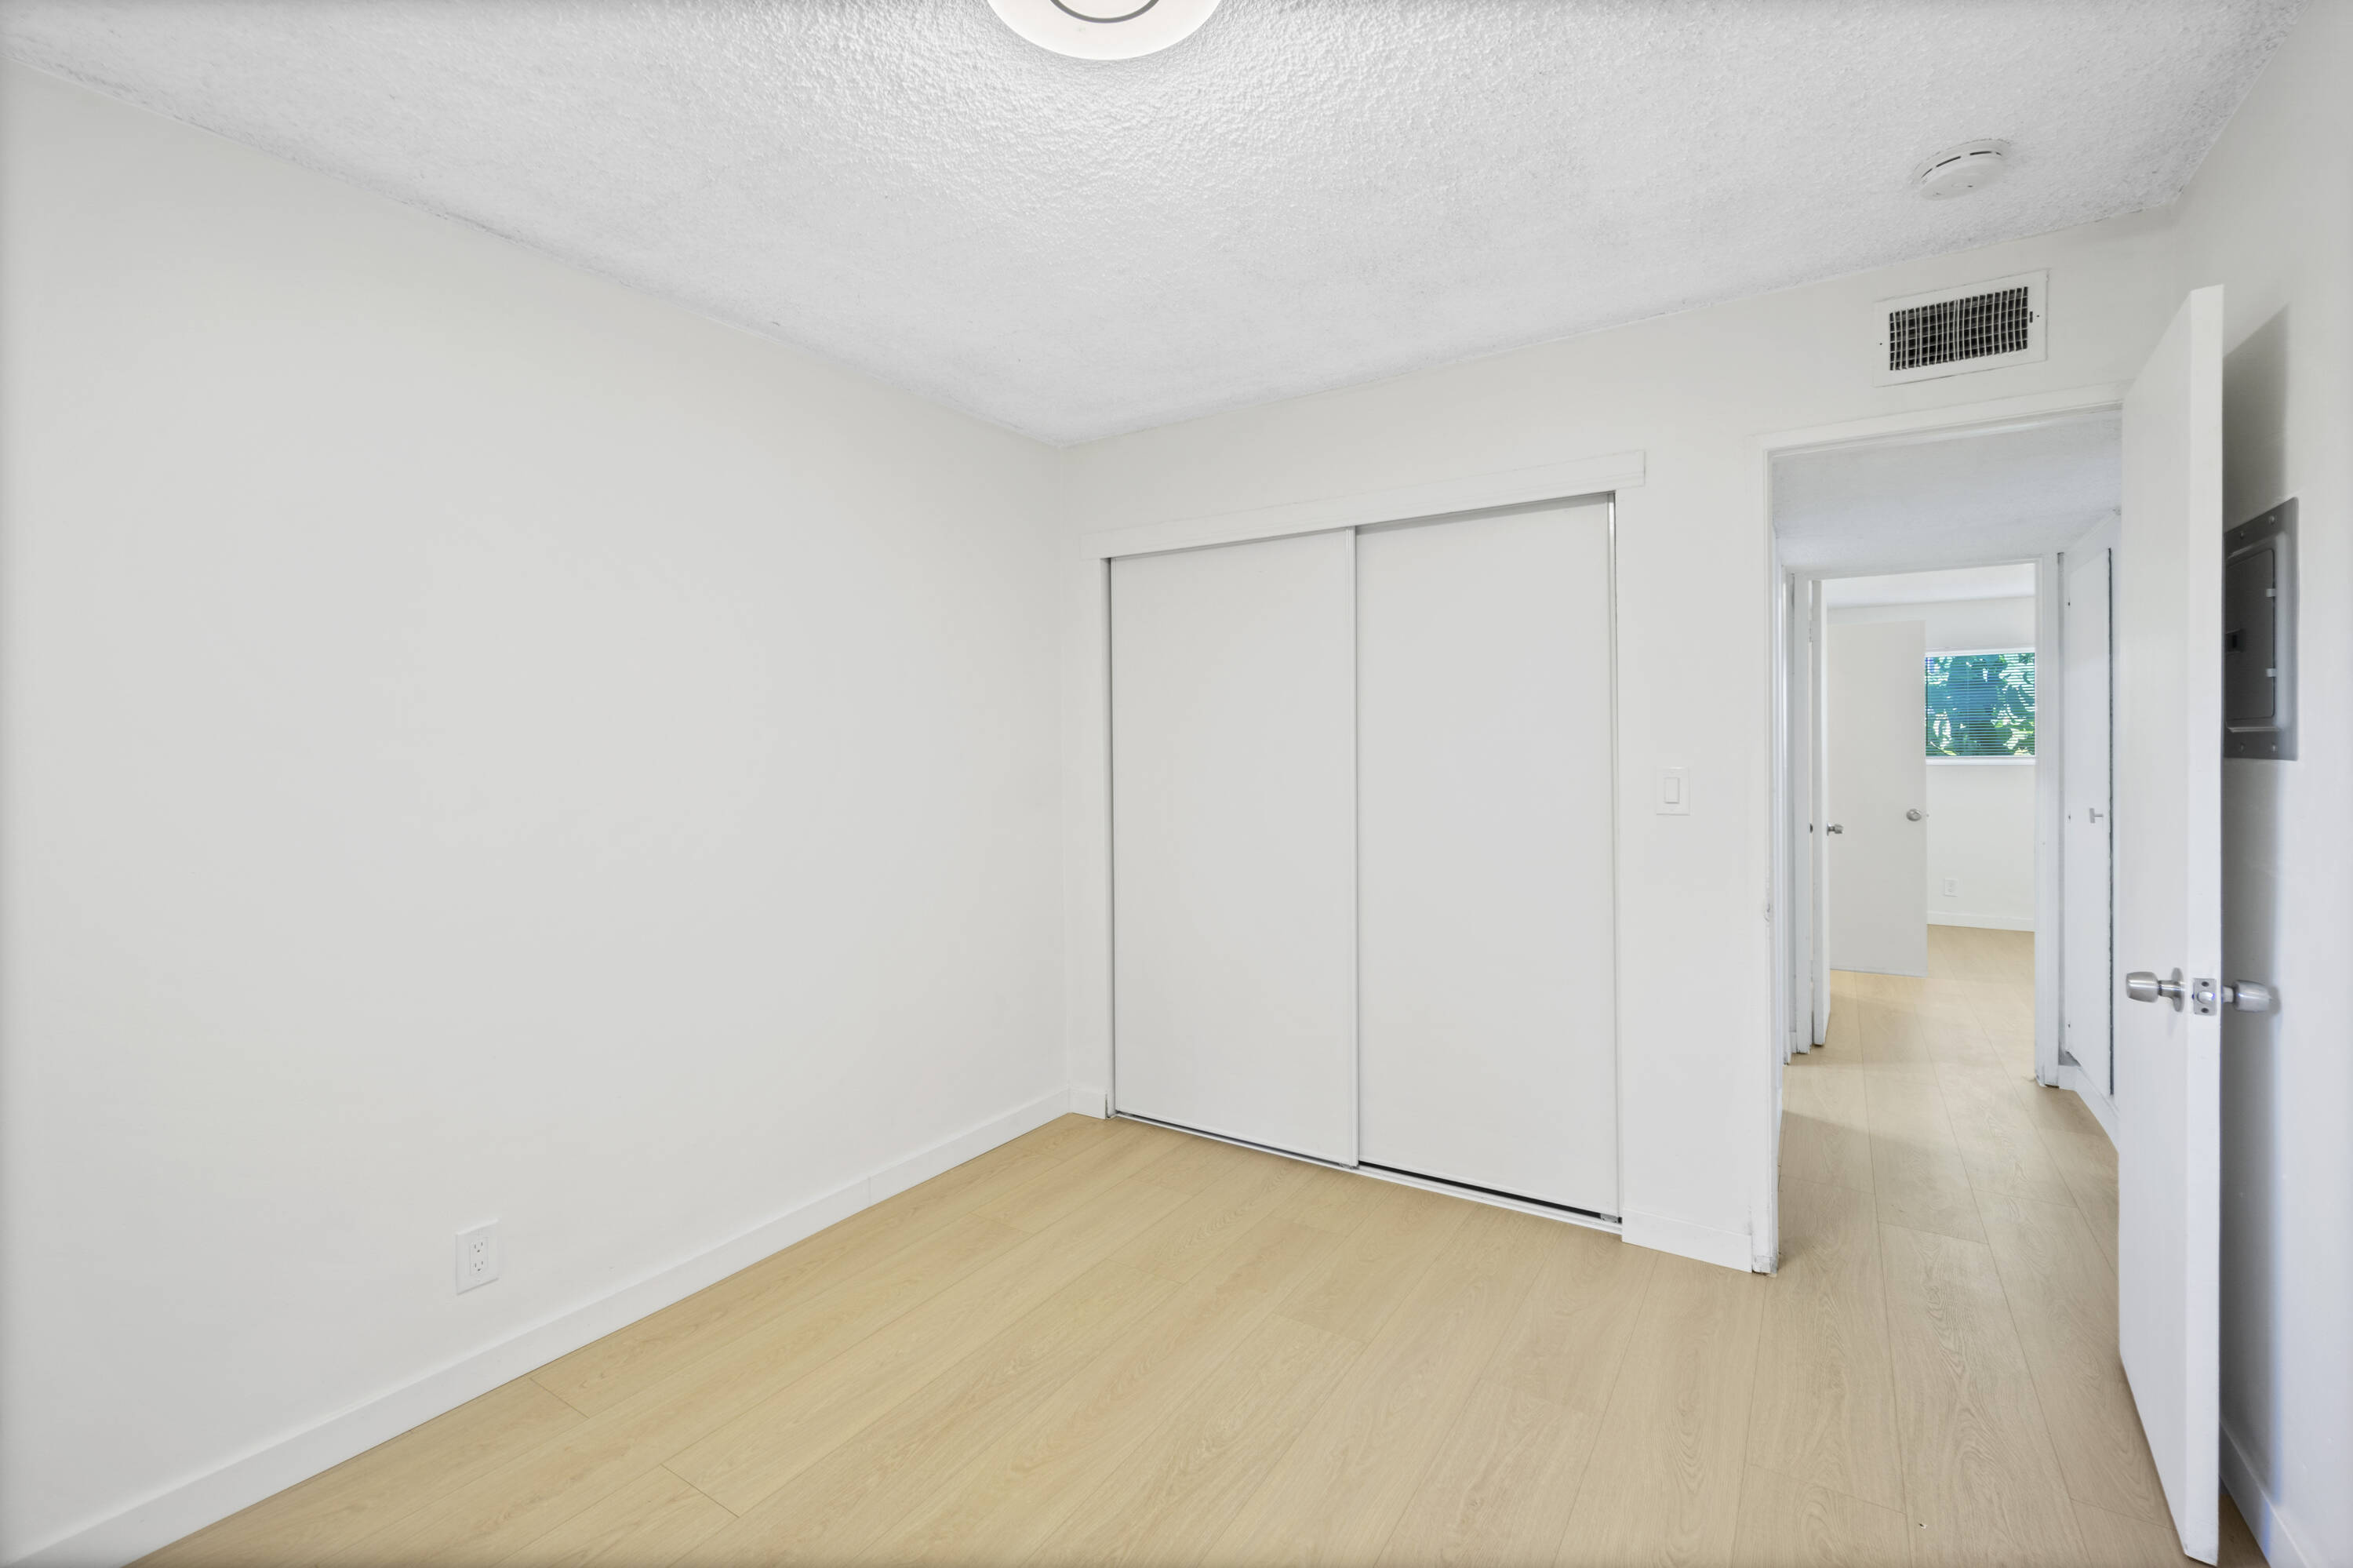
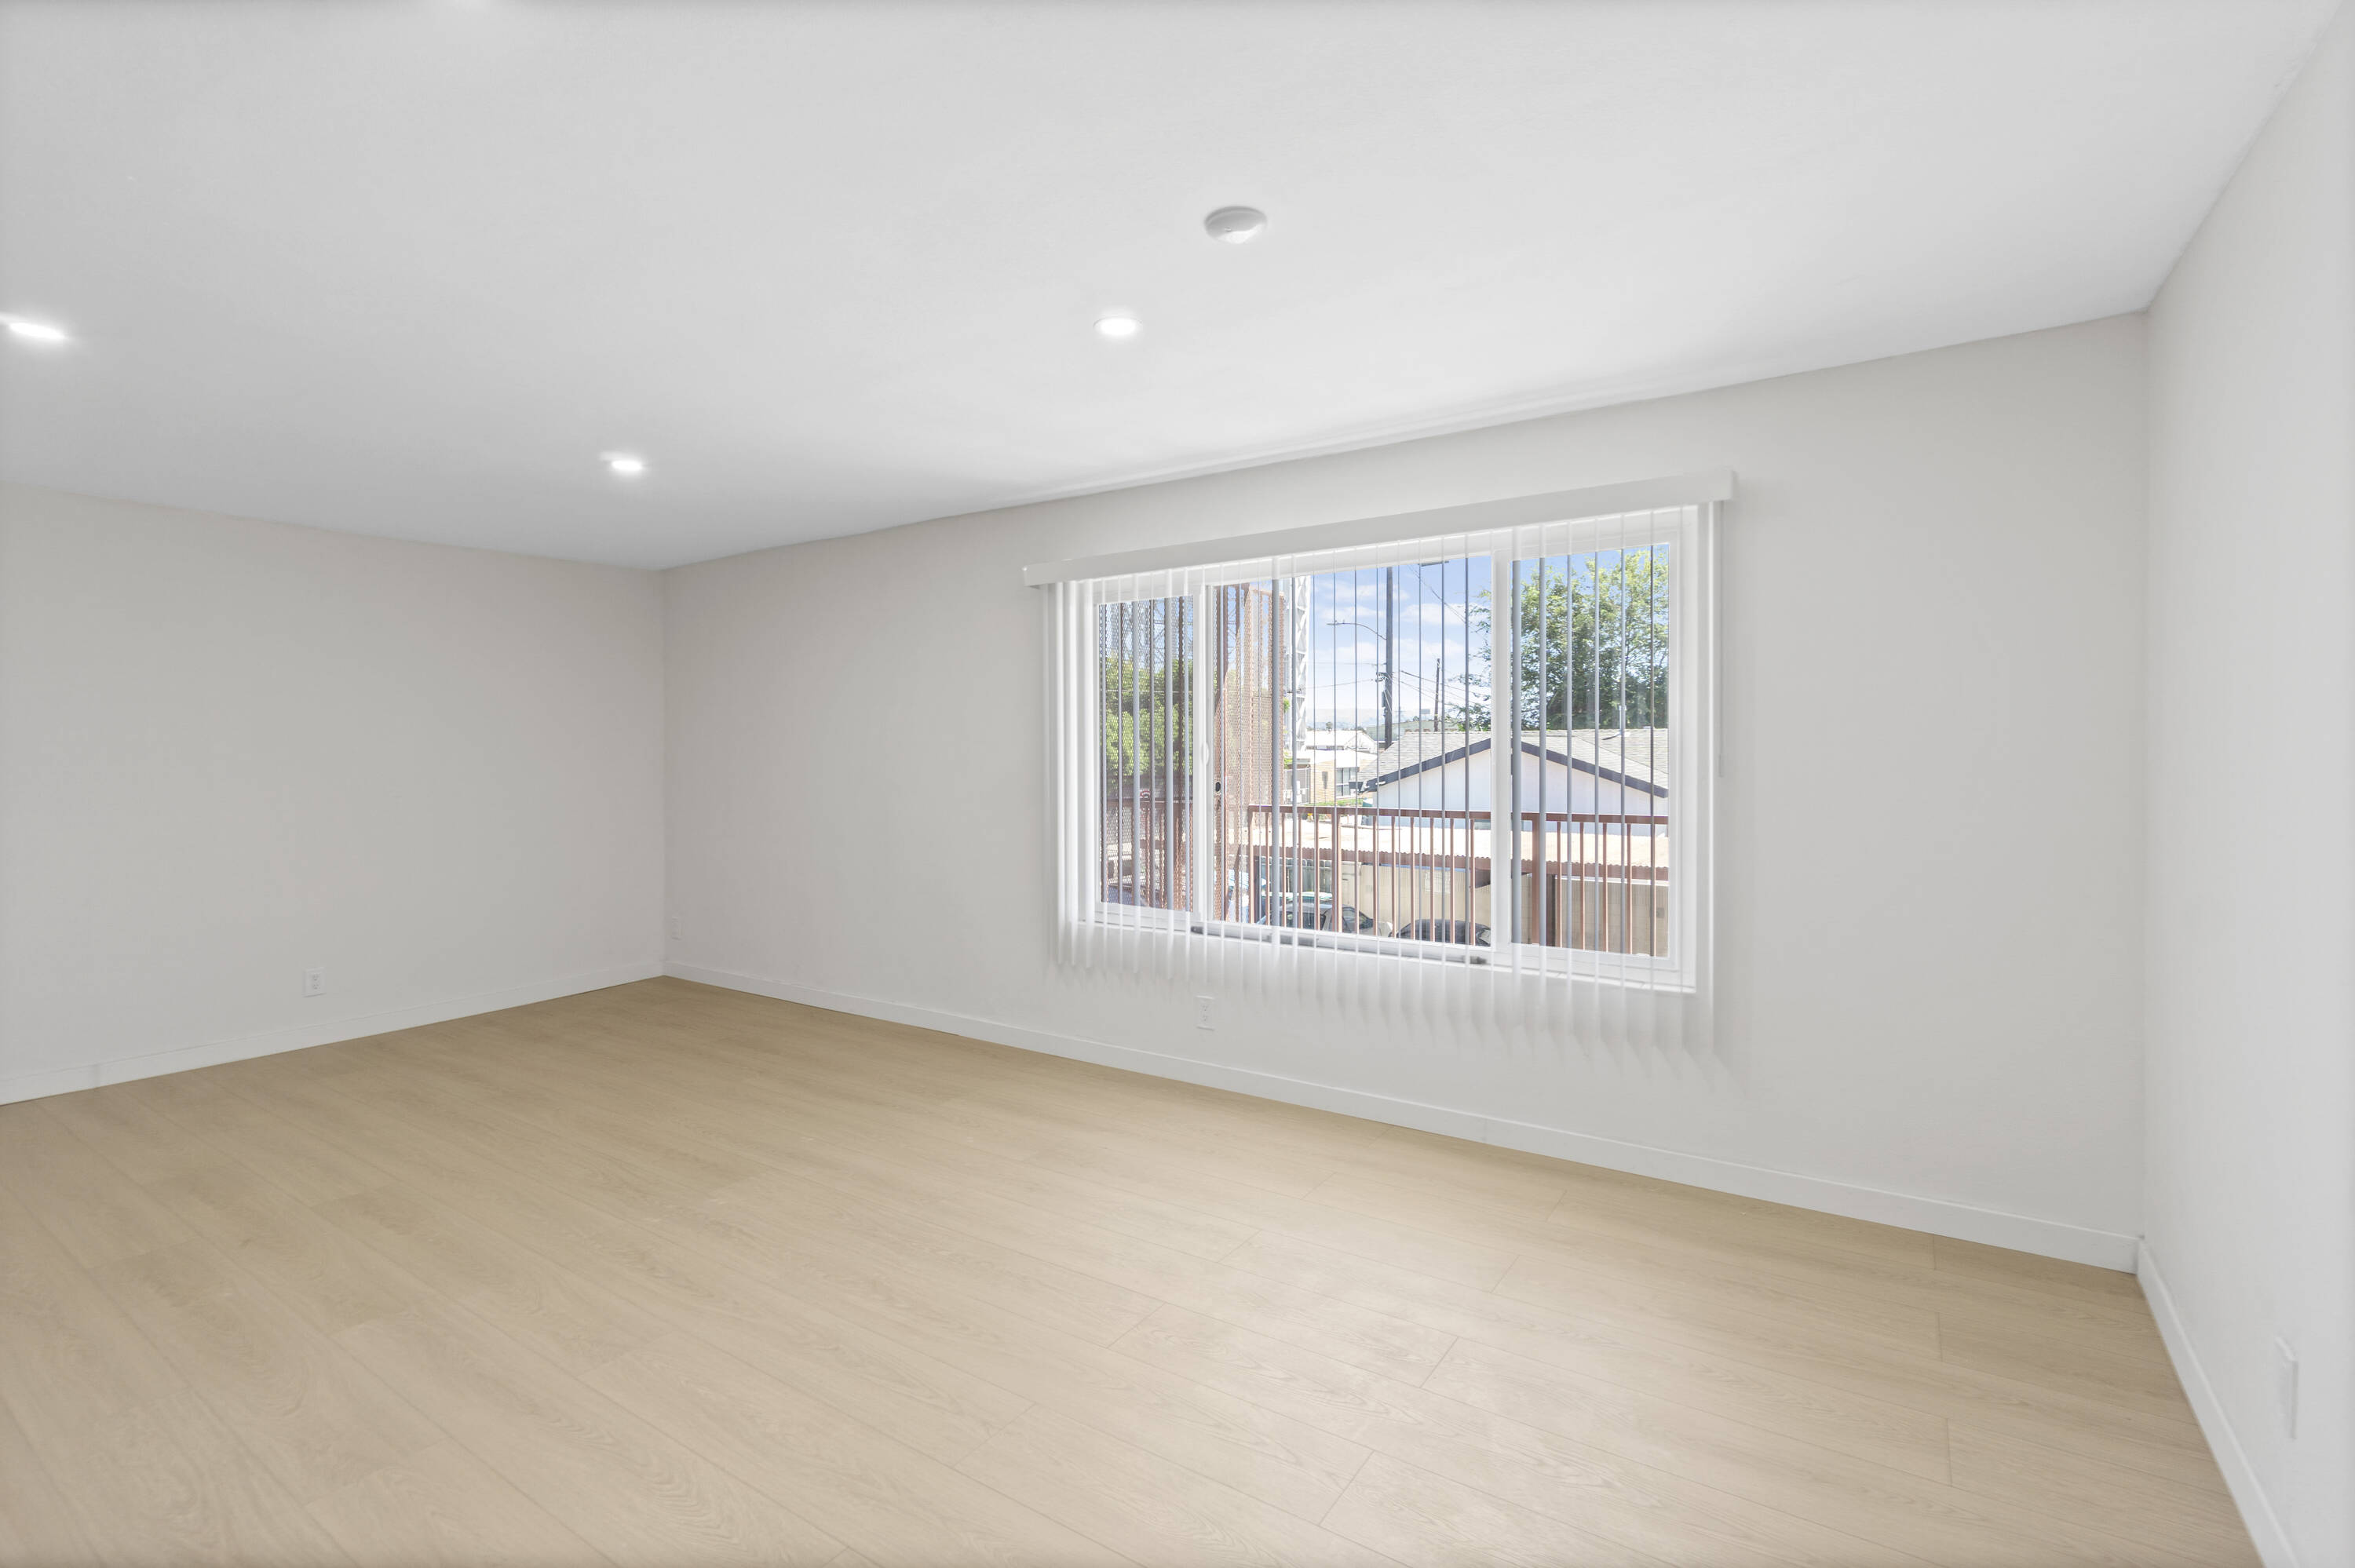
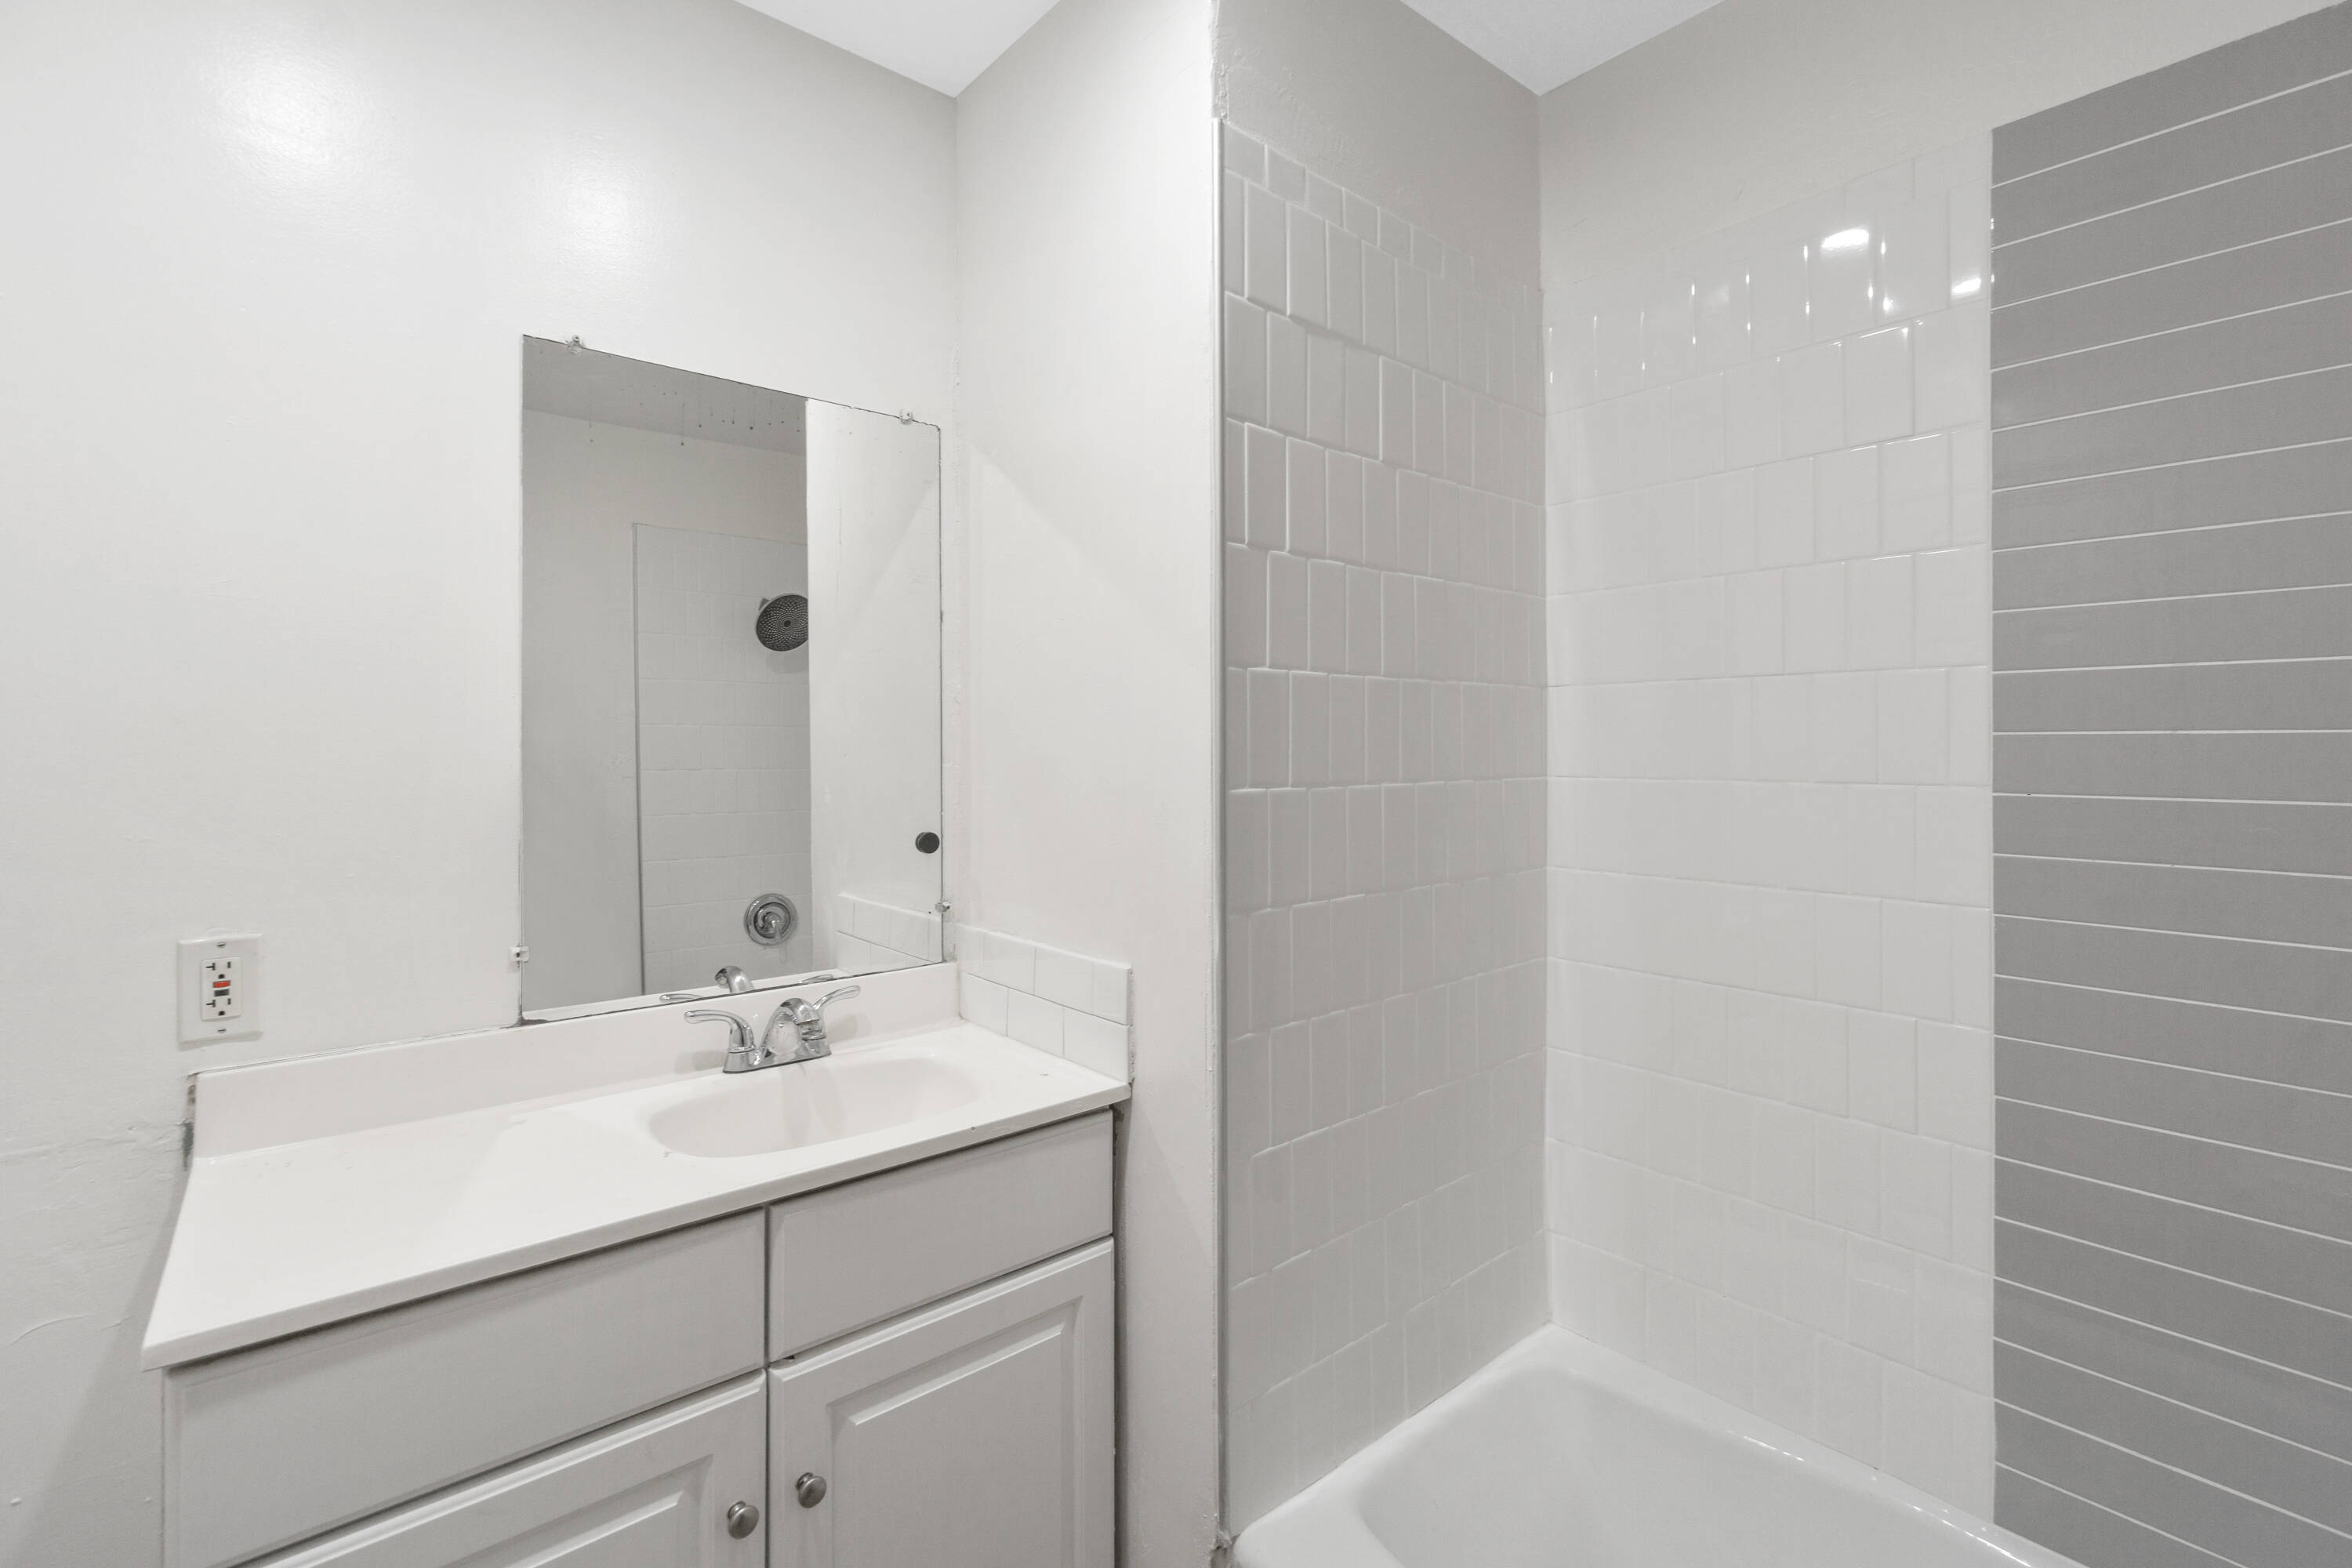
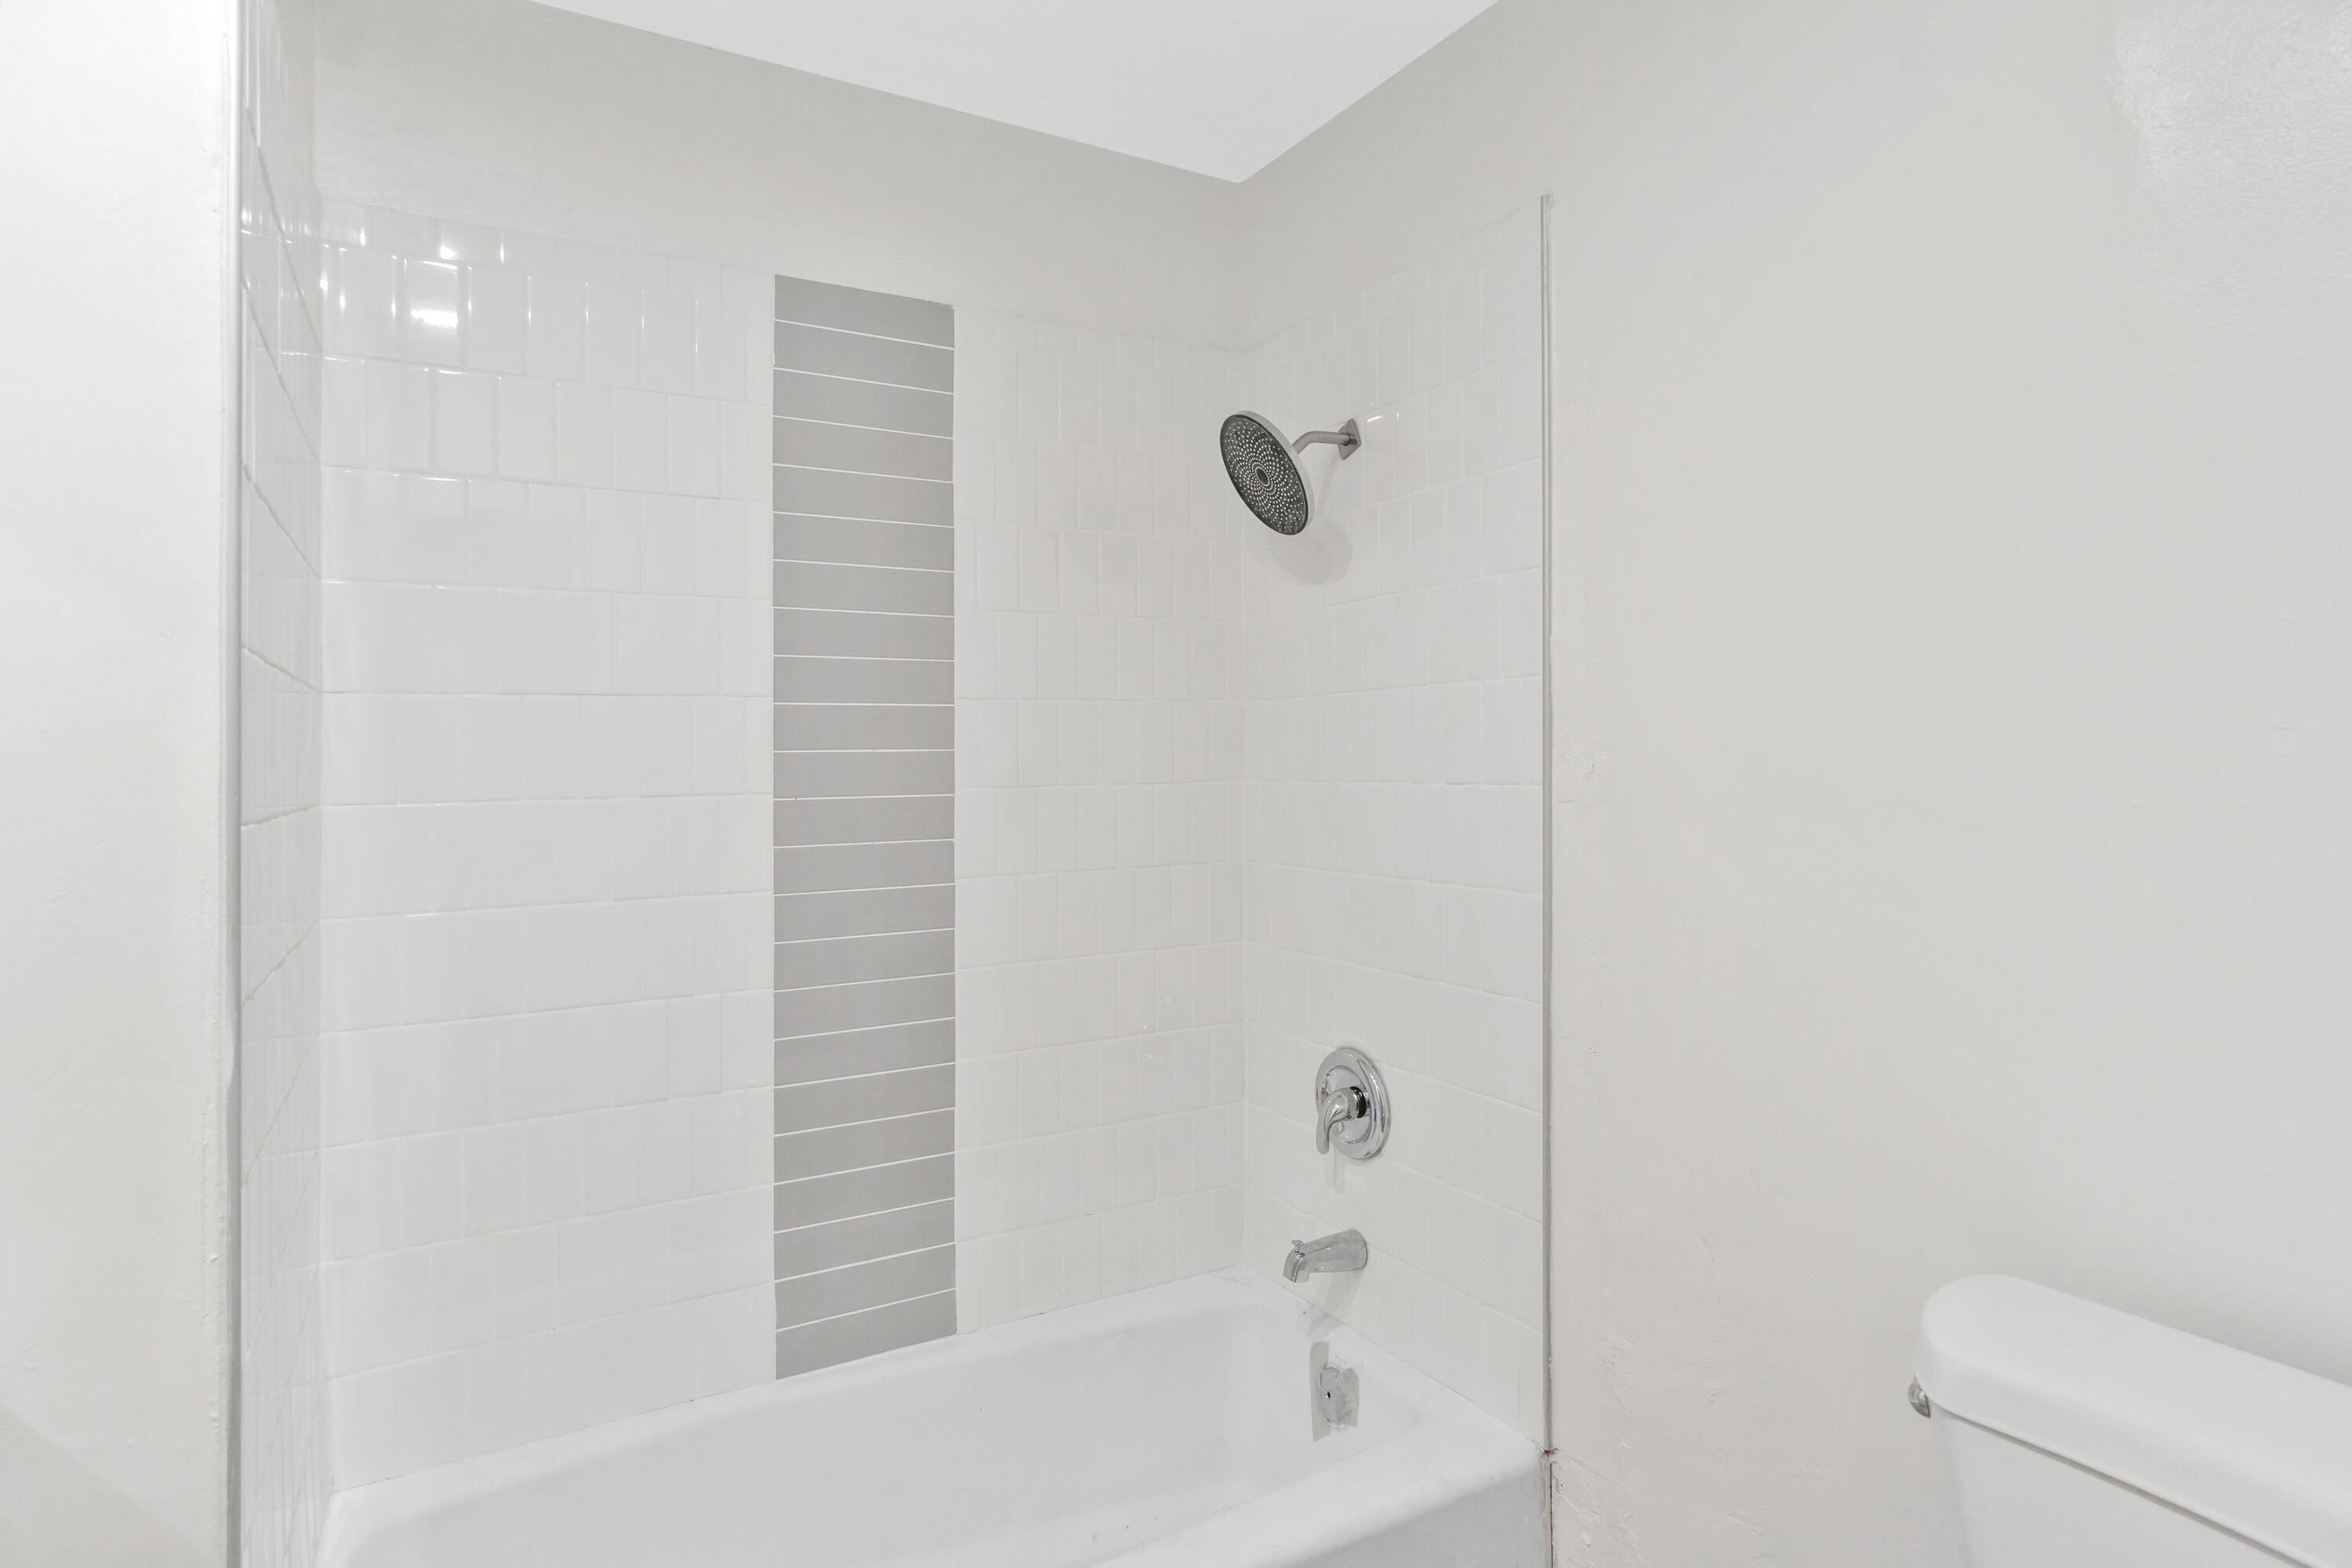
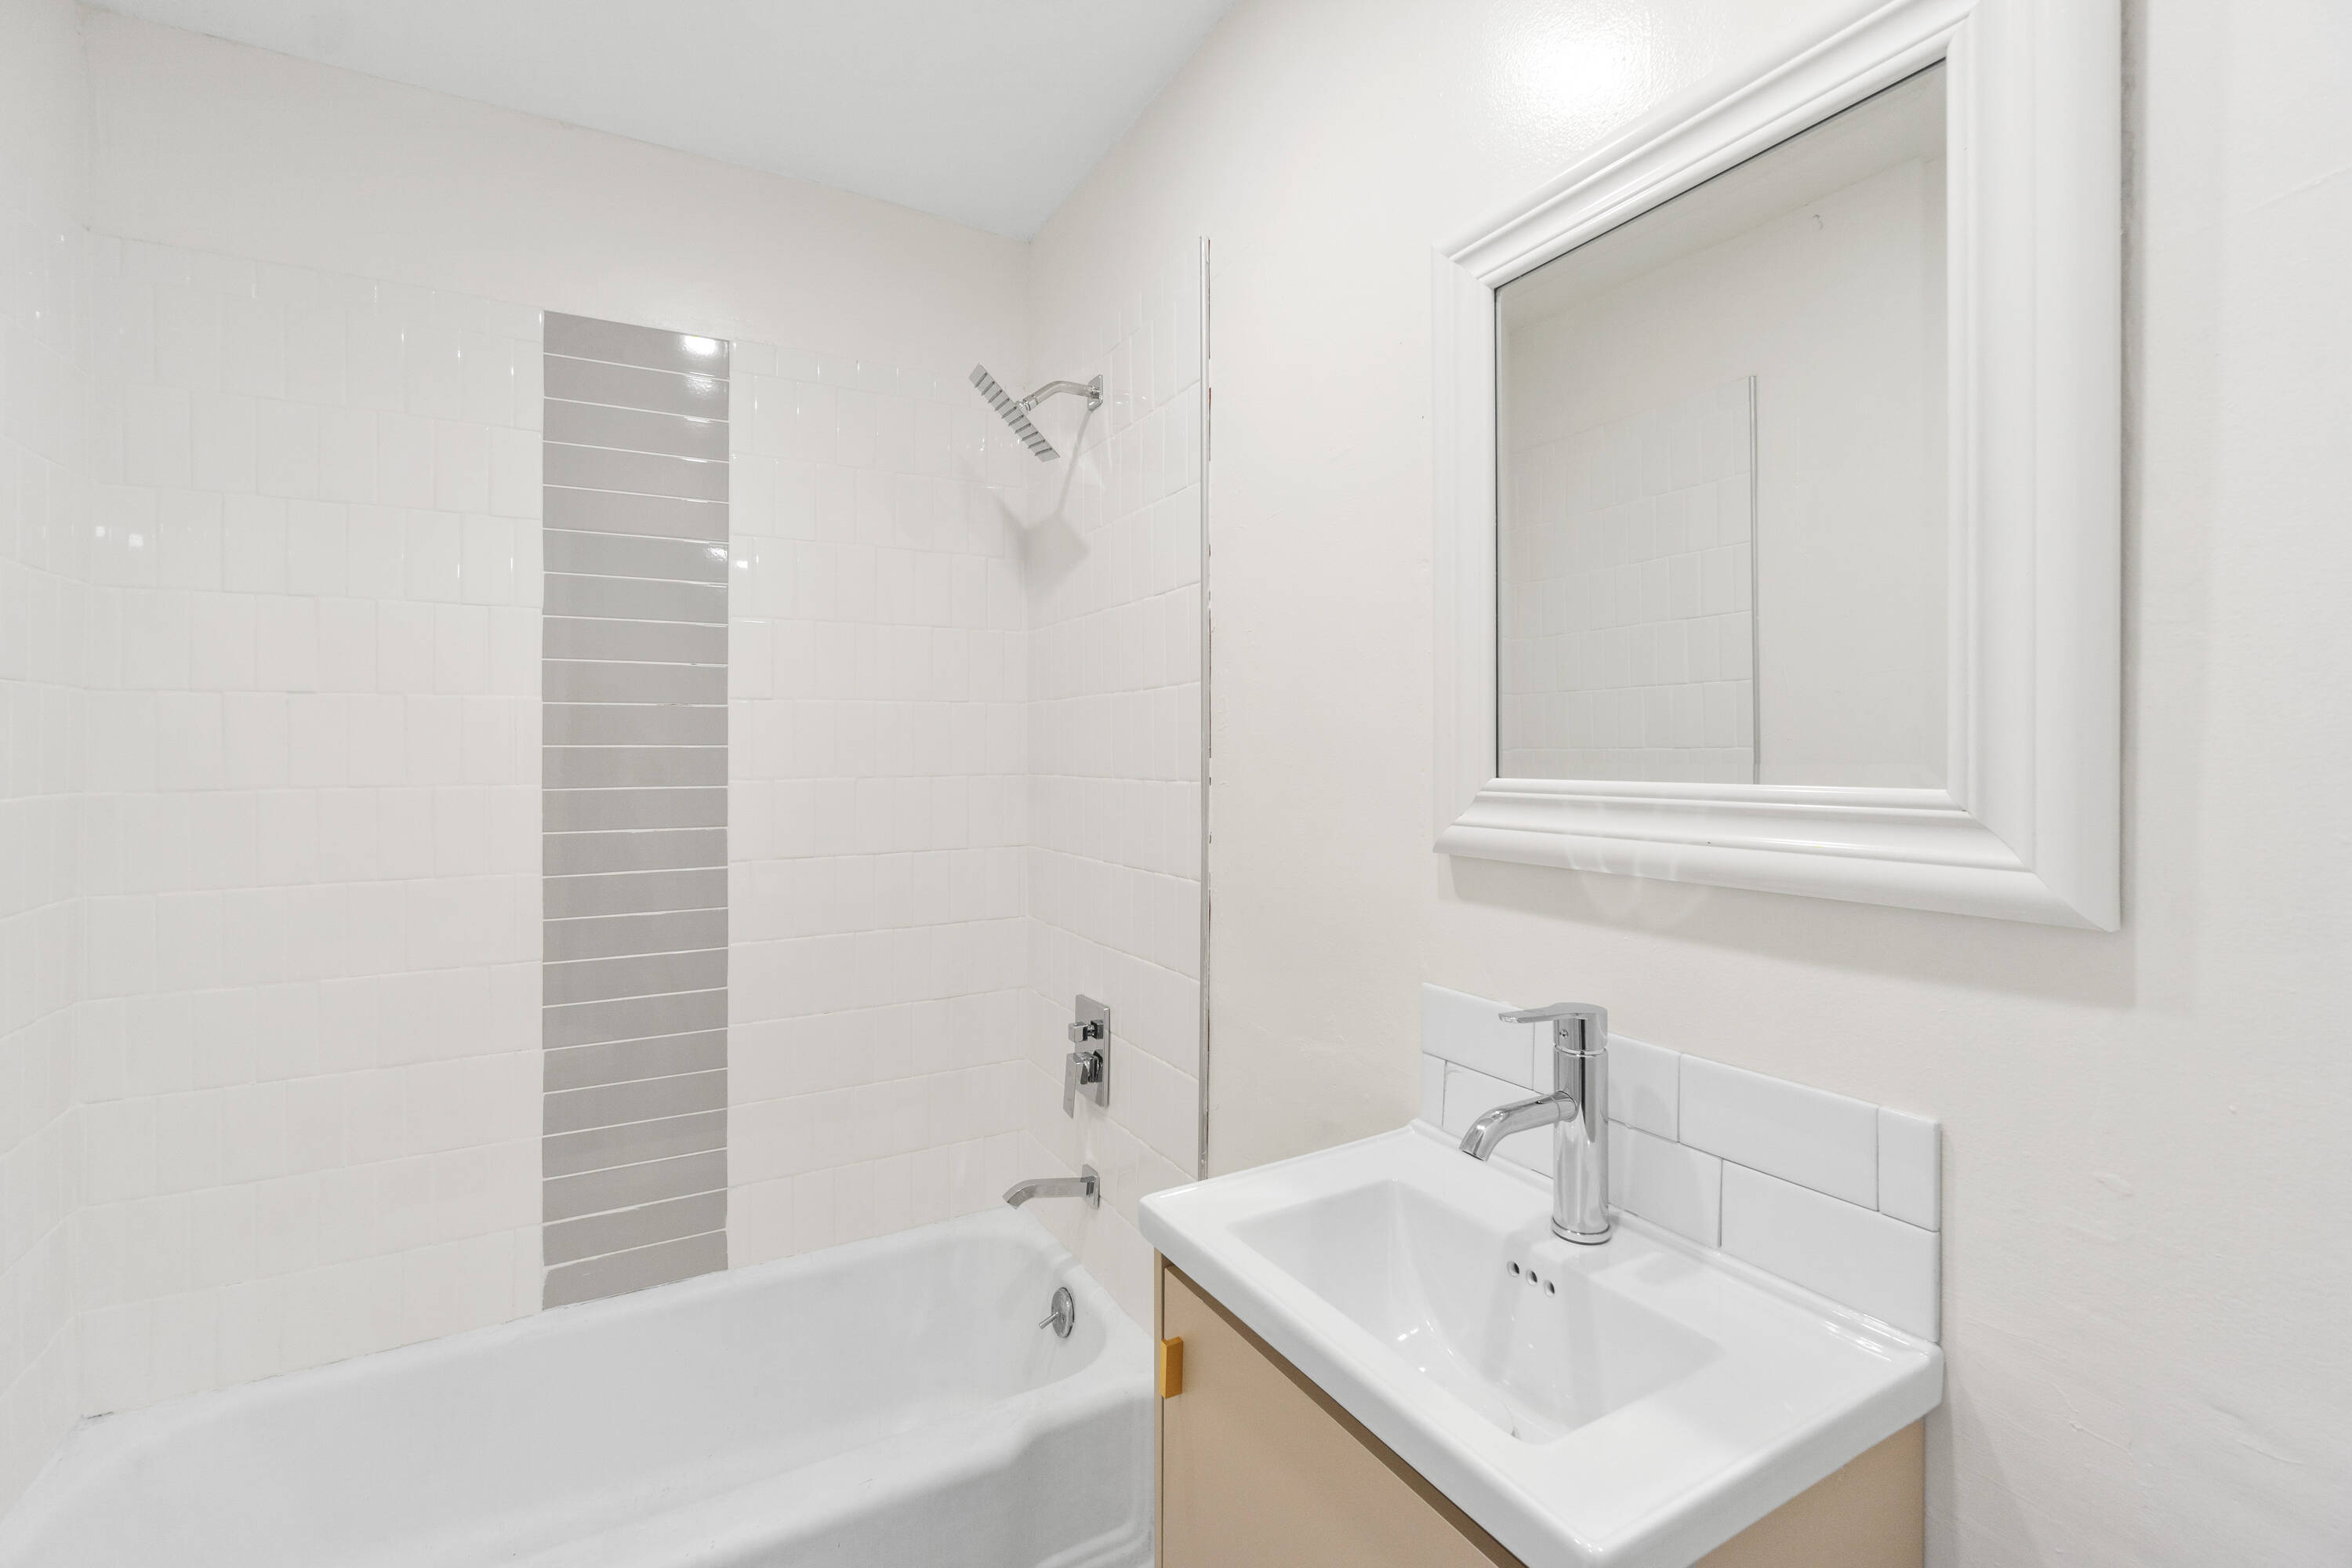
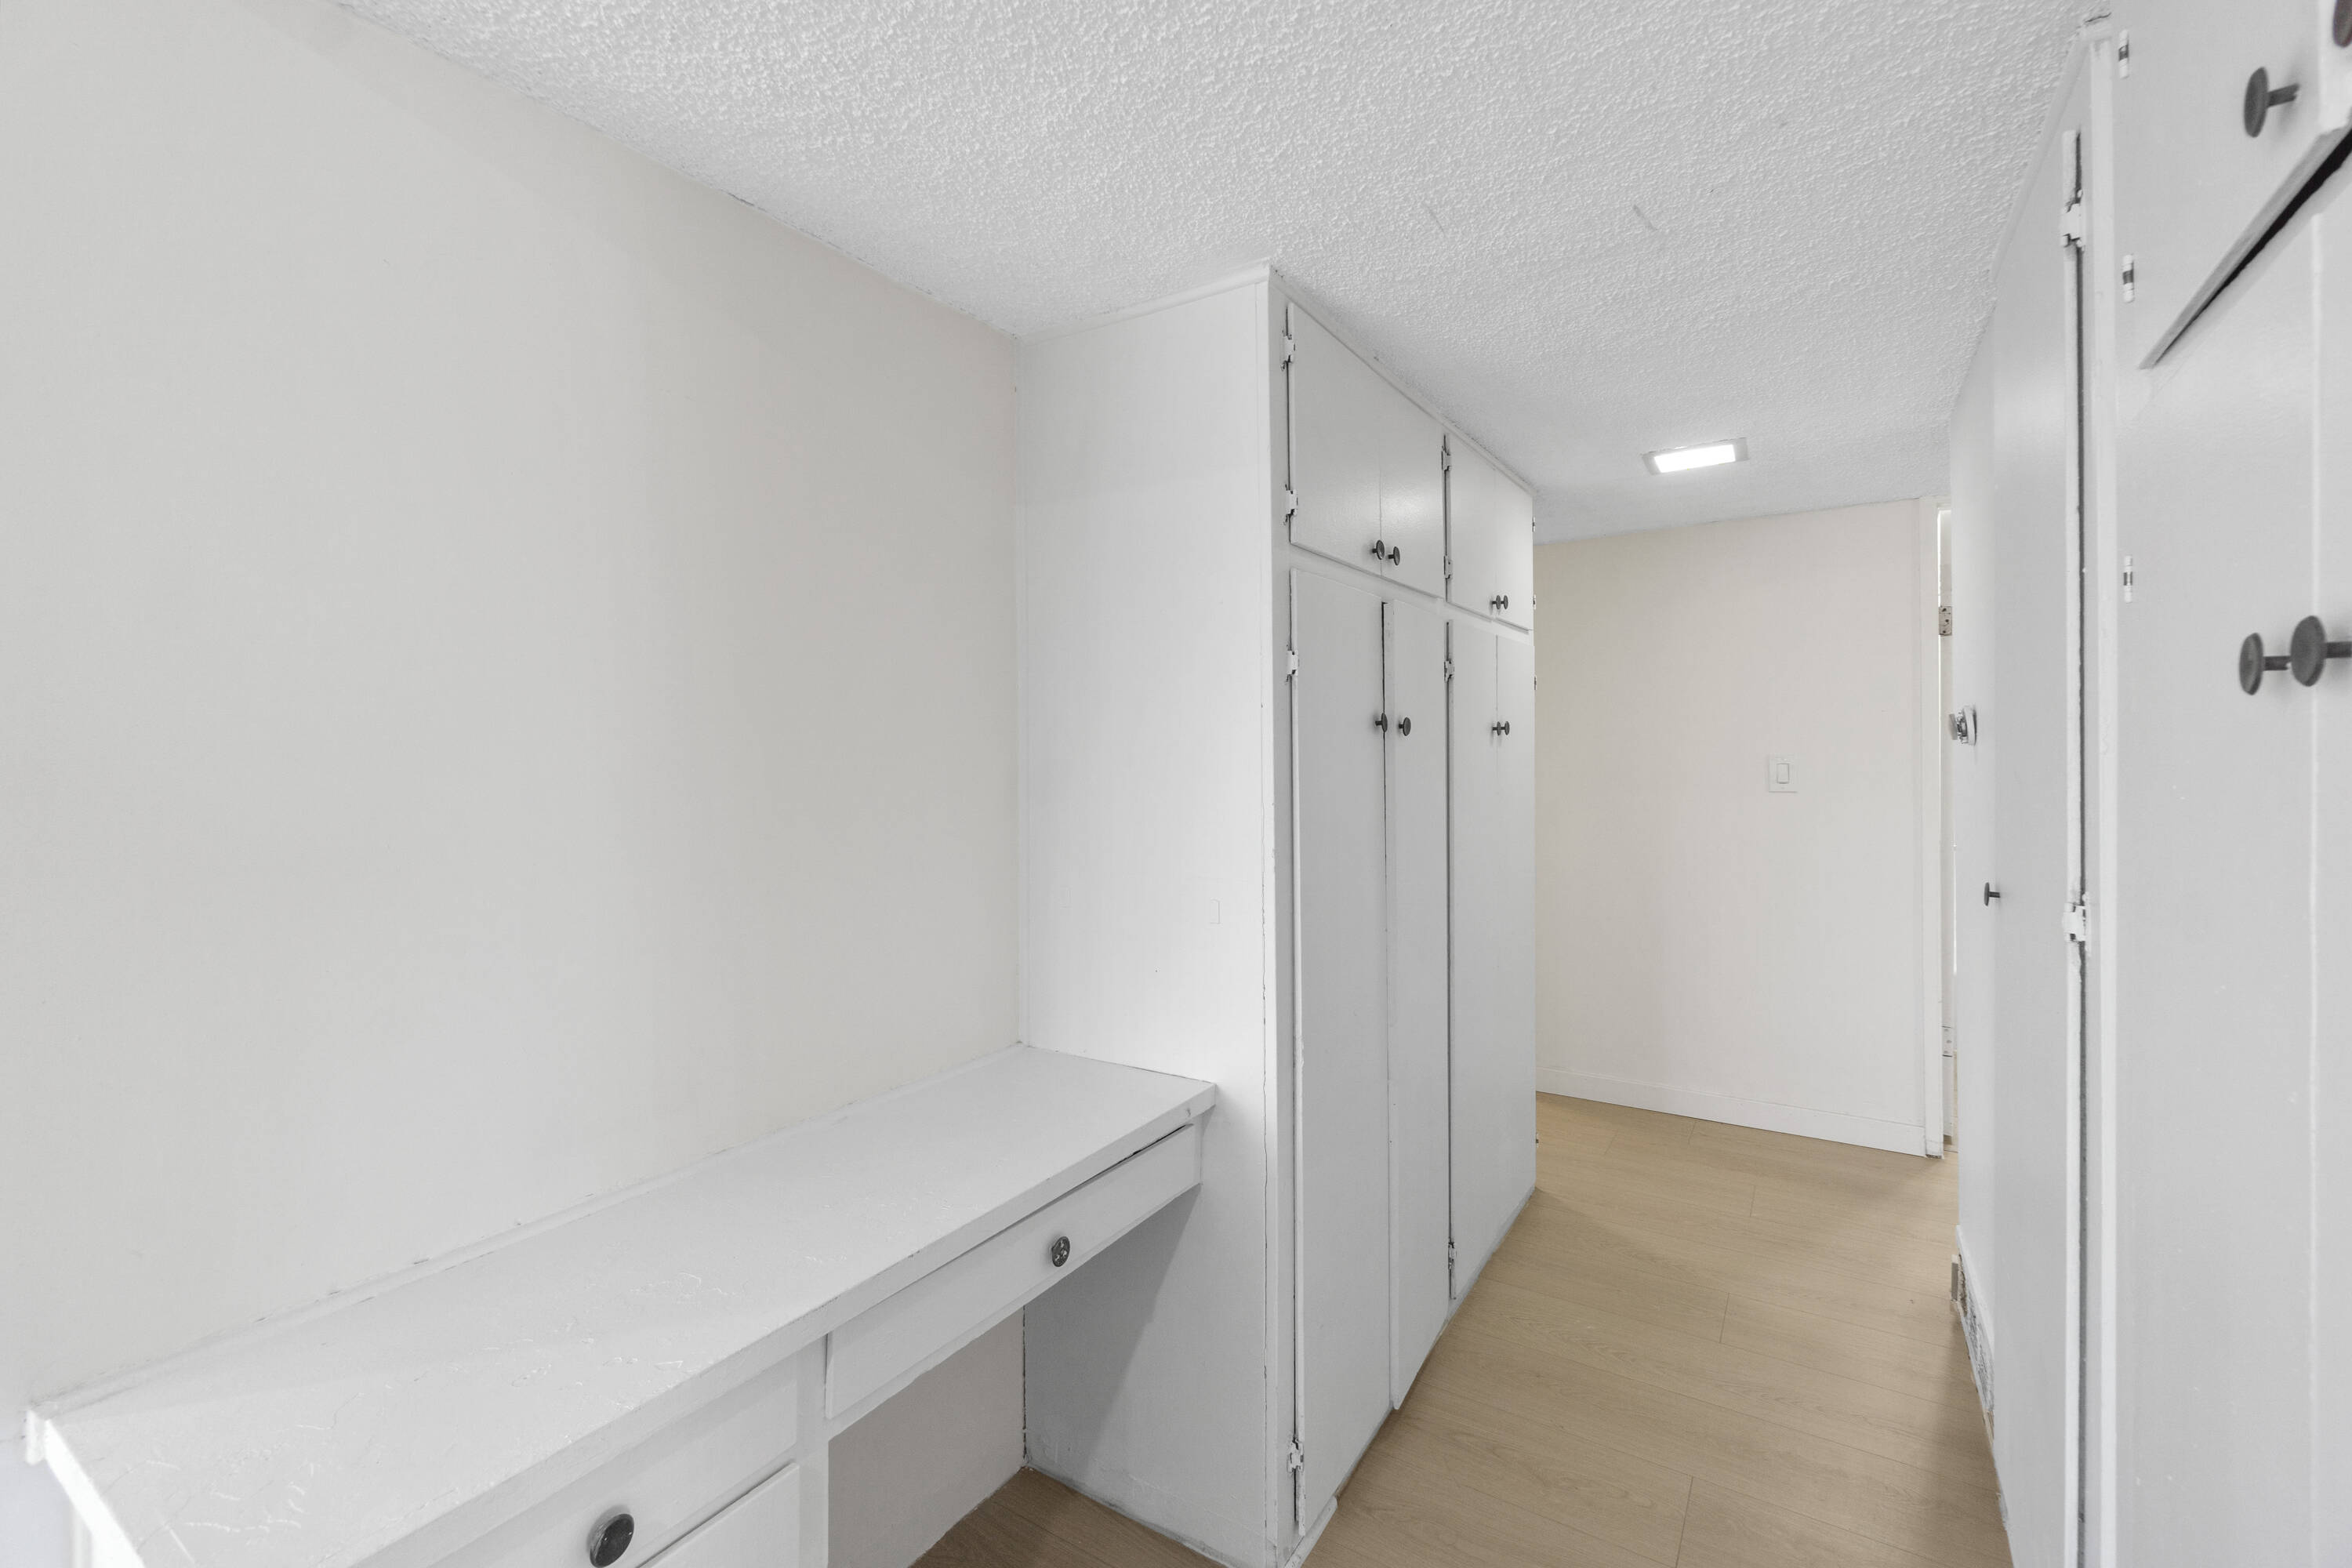
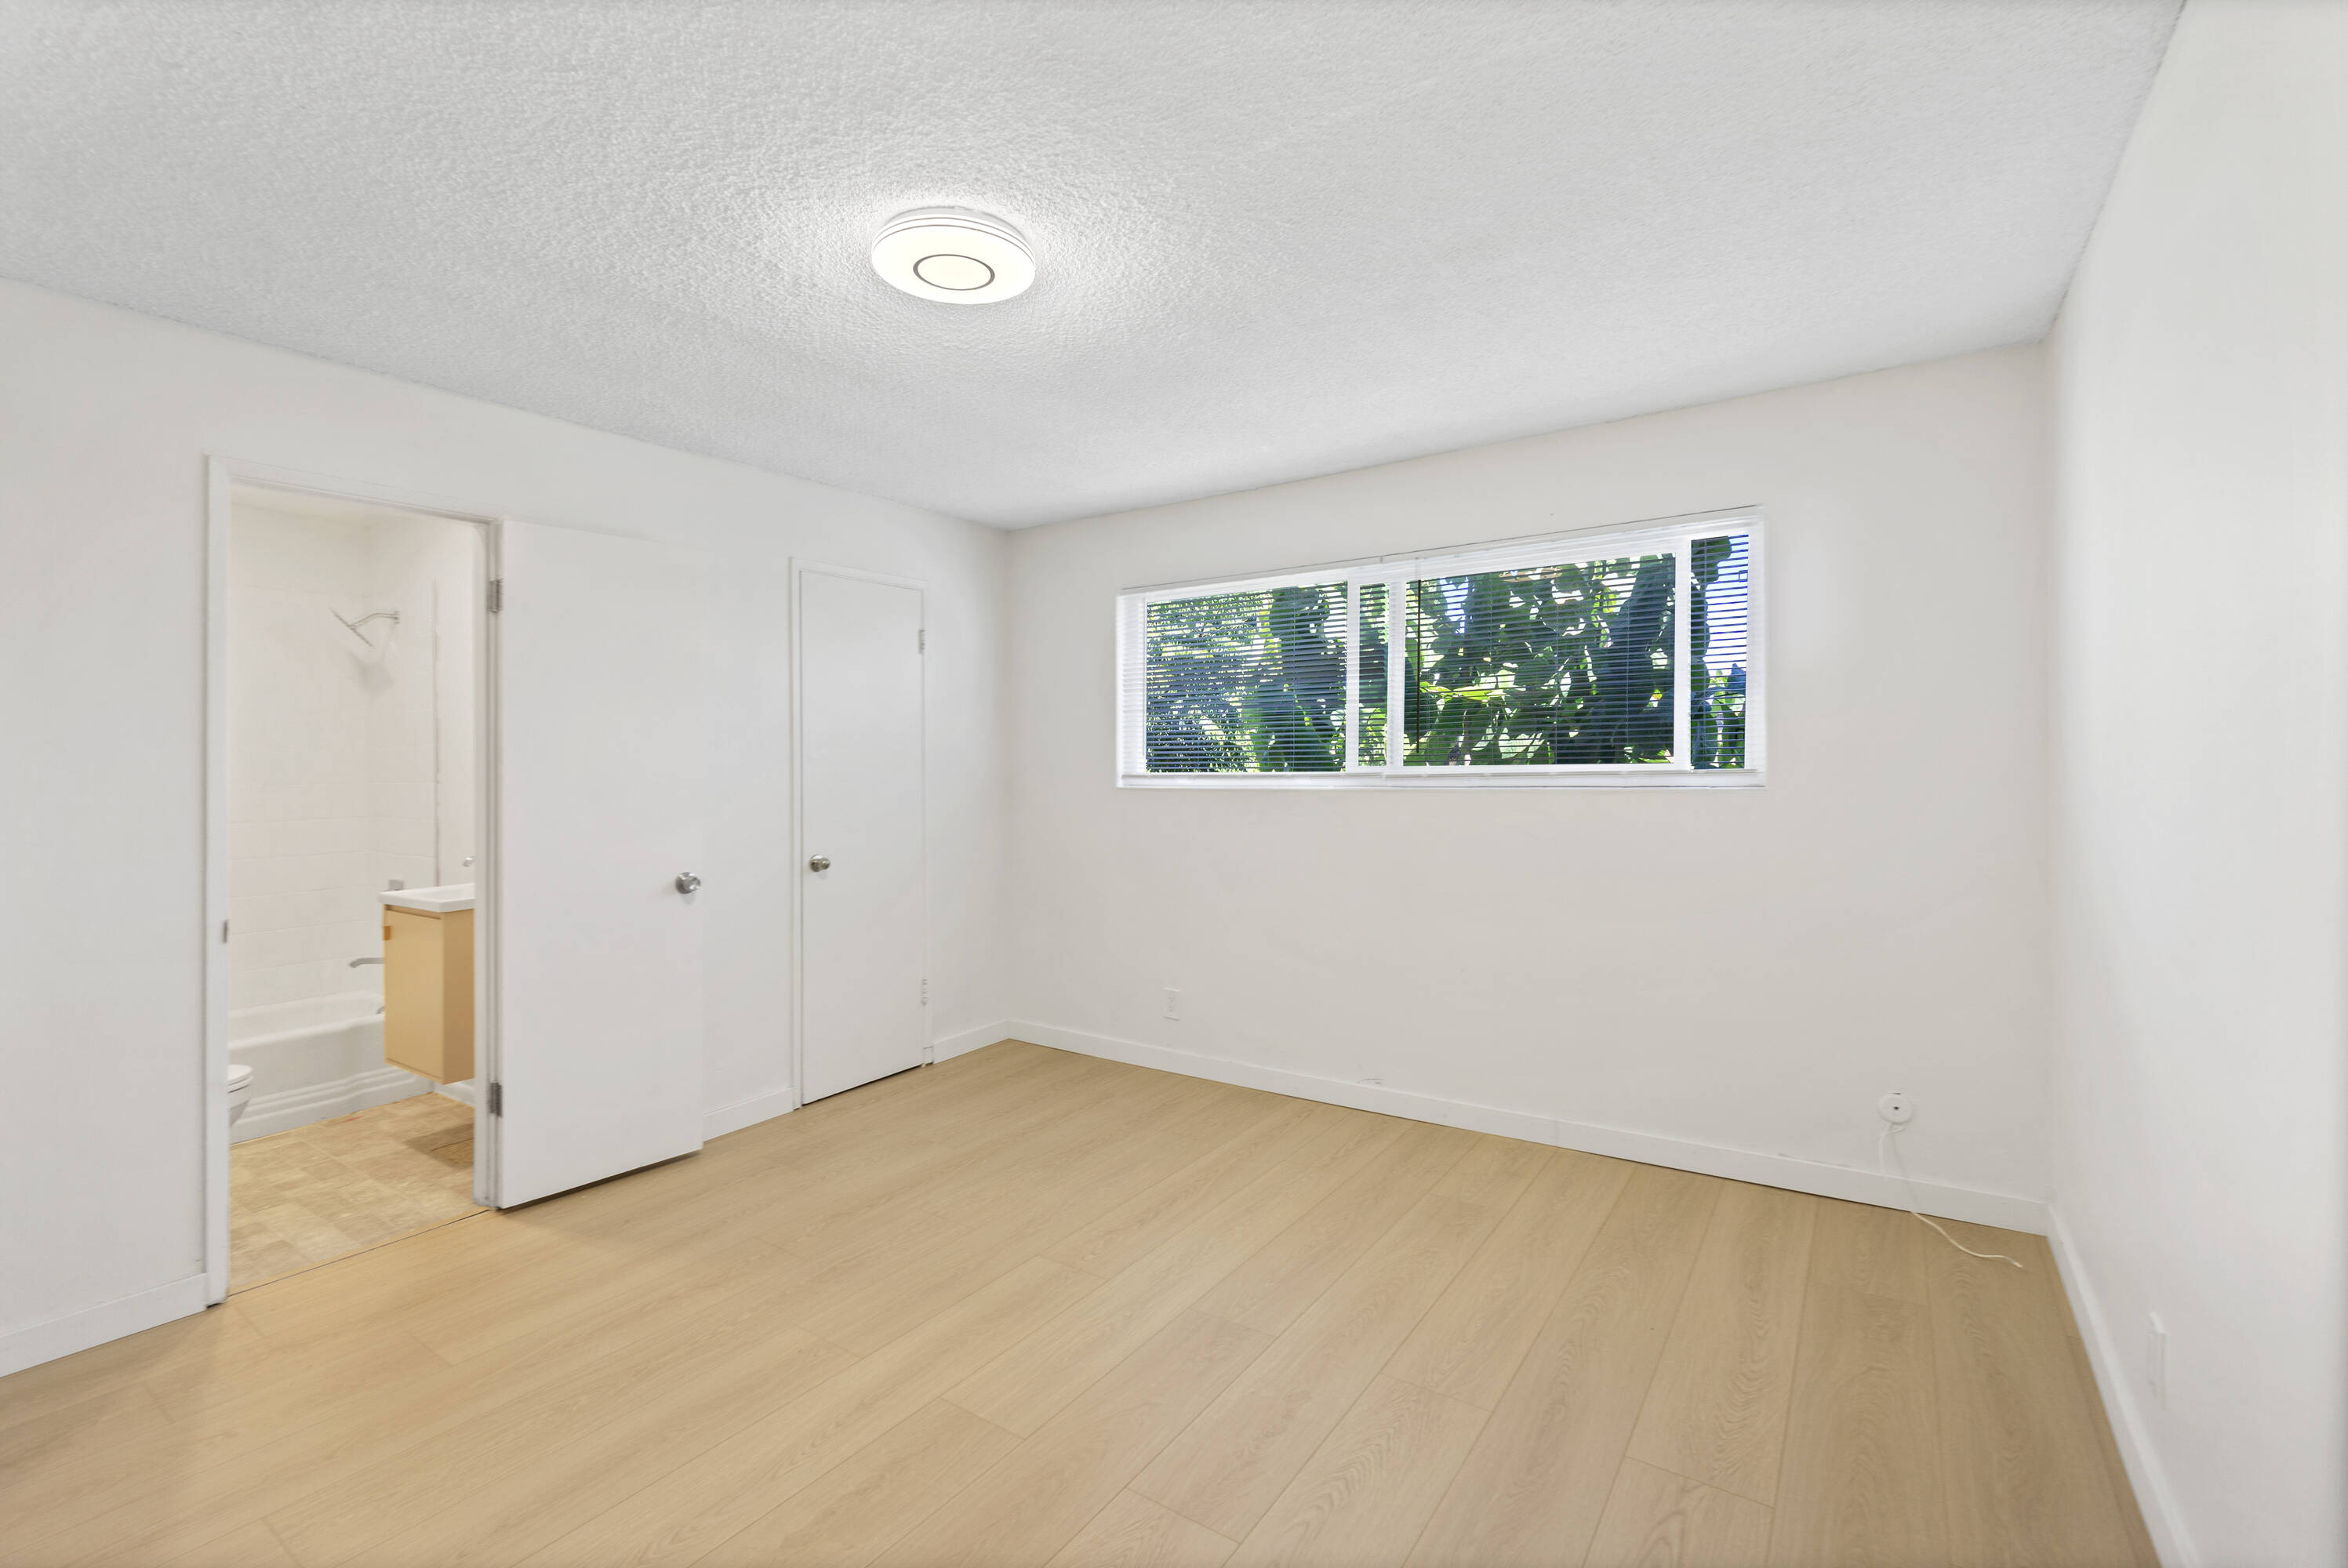
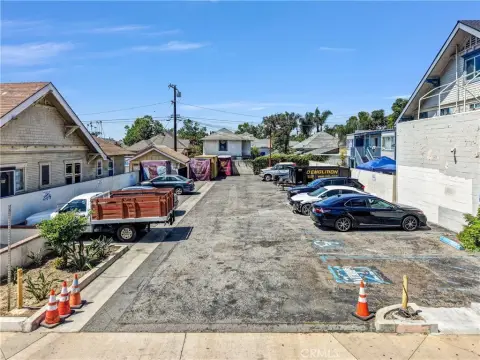
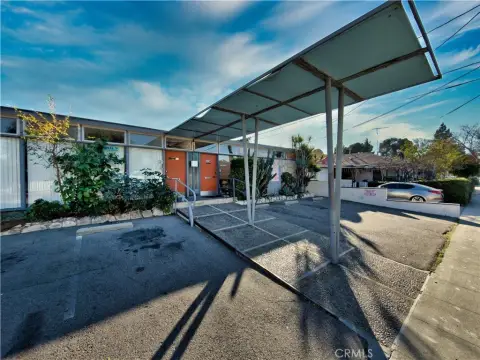
The Washington Avenue Apartments, constructed in 1964, is a 30-unit apartment community situated in the French Court neighborhood of Santa Ana. The property contains one-, two-, and three-bedroom units, totaling 26,707 square feet on just over one acre of land. The community features a gated entry with a large courtyard, on-site parking including carports, a barbecue area, patios and balconies, and an on-site laundry facility. Recent renovations and upgrades include granite countertops, vinyl plank flooring, new tubs and showers, new appliances, new windows and sliders, new railings, a deck replacement and resurfacing, new A/C units, and replaced water heaters. The property is located in a desirable rental market of Santa Ana, California.
Property Profile
Insight Report
Location Intelligence
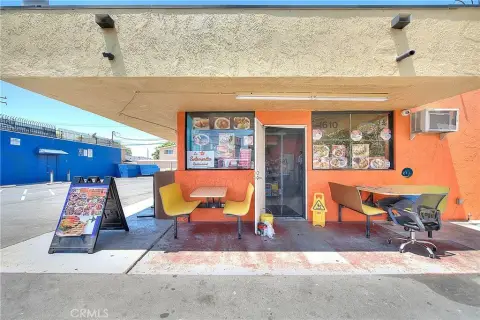
Current Use by Public Records
Marquez Handyman
Hardware & Home Improvement
Location Insight
- Map
- Local Demand
- City
- Santa Ana
- County
- Orange
- State
- California
- Longitude
- -117.862987
- Latitude
- 33.756247
Nearby Similar for Sale


FAQs
What type of property is this?
Apartment building - 30-unit apartment community in desirable Santa Ana neighborhood.
Where is this apartment building located?
The property is located at 511 E Washington Ave Santa Ana, CA.
What is the asking price?
The asking price for this property is $9,300,000.
What are key features of this property?
This property features: Located in the highly desirable French Court neighborhood of Santa Ana, a strong rental market in Southern California.; Attractive unit mix of one-, two-, and three‑bedroom apartments.; Recent renovations and upgrades to interiors and exteriors, including granite countertops, new flooring, appliances, windows, and A/C units.