Infill Development
For Sale
Contact for pricing
917 2nd St SW, Rochester, MN 55902
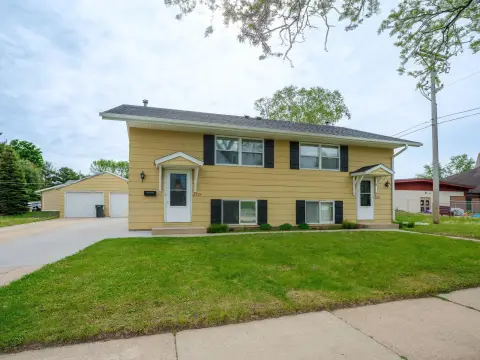
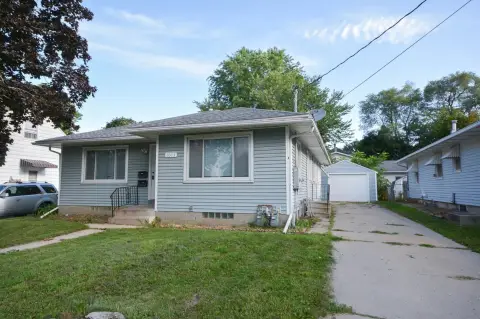
Infill site in downtown Rochester near Mayo Clinic campuses and within the DMC–St. Mary’s District.
Property Size6,460 SF
Price / SF$201.24
Days on Market183
Property Features for 917 2nd St SW
General Information
Standard status
Active
Size
6,460 SF
Class
B
Property subtype
Multifamily
Zoning
MXT-COR
Building Details
Year Built
1916
Buildings
2
Units
8
Listing Agency:
Hamilton Real Estate Group
Listed By:
Ari Kolas · License #MN MN
(507) 271-5553
Source:
Crexi
Added: Apr 22
Changed: Oct 16
Last Checked: Oct 20 at 5:13PM
Displayed information is deemed reliable but is not guaranteed and should be independently verified. All listing content including descriptions, pricing, images are the copyrighted material of Hamilton Real Estate Group

Ask AI about this property
Review the available facts, identify missing information and prepare questions for the agent.
Investment Insights
Based on property information with market context.
This infill development site is positioned in the heart of Rochester and is anchored by the Mayo Clinic. Public remarks note Mayo Clinic has 44,000+ employees and that a $5B expansion is underway, supporting a range of development concepts including multifamily, senior housing, hospitality, or mixed-use.
The site is described as within the DMC – St. Mary’s District (a public-private growth initiative) and within walking distance to Mayo Clinic Hospital, Saint Mary’s Campus, and Mayo Clinic Downtown Campus. It is also located along the Link Bus Rapid Transit (BRT) line currently under construction, with direct access to all Mayo campuses.
Address: 917 2nd St SW, Rochester, MN 55902.
The site is described as within the DMC – St. Mary’s District (a public-private growth initiative) and within walking distance to Mayo Clinic Hospital, Saint Mary’s Campus, and Mayo Clinic Downtown Campus. It is also located along the Link Bus Rapid Transit (BRT) line currently under construction, with direct access to all Mayo campuses.
Address: 917 2nd St SW, Rochester, MN 55902.
Key Highlights
- Infill development site in downtown Rochester near Mayo Clinic campuses
- Walking distance to Mayo Clinic Hospital, Saint Mary’s Campus, and Mayo Clinic Downtown Campus
- Located within the DMC–St. Mary’s District (public‑private growth initiative)
Financial Insights
Estimated NOI and Cap Rate
NOI / Yr
$61,076
Cap Rate
4.70%
Suggested Prices Based on Cap Rates
Cap Rate 5%
$1,221,520
$1.2M
Cap Rate 7%
$872,514
$872.5K
Cap Rate 9%
$678,622
$678.6K
Market Conditions
NOI Build-Up for 6,460 SF
Gross rent
$116.3K $18.00/SF
− Vacancy
−$5.2K −$0.81/SF
EGI
$111.0K $17.19/SF
− OpEx
−$50.0K −$7.74/SF
NOI
$61.1K $9.45/SF
Area
Rochester, MN
Vacancy
4.50%
Lease Rate
$18.00 /SF/Yr
Expense Ratio
45.00%
Simulate Cap Rate and NOI
Suggested Prices Based on Cap Rates
Cap Rate 5%
$1,221,520
Cap Rate 7%
$872,514
Cap Rate 9%
$678,622
Alternative Uses
Best Use
Apartment 5plus
$872.5K
$763.5K – $1.02M
NOI $61,076 @ 7.0% cap · market cap 4.70%
Second Best
—
—
no second resolved use
Theoretical Best
Office A
$2.49M
$2.18M – $2.90M
NOI $174,166 @ 7.0% cap · market cap 13.40%
Zoning and permitted uses should be independently verified with authorities.
How Realmo checks its estimates
Property Analytics
Who owns this building?
See the owner, sales and loan history
Open Analytics
Current Use
Location Intelligence
Trade Area within ½ mile
1,299
Businesses Nearby
Explore this area
Business Placement
Demographics for 55902, MN
25,878
Population
11,954
Households
2.2
Avg Household Size
40
Median Age
66%
College-Educated
98%
High-School Grad
41.1 sq mi
ZIP Area
630
Density / Sq Mi
$111,879
Median Household Income
$68,869
Median Earnings
$1,580
Median Rent
$430,100
Median Home Value
Check the figures for this property
Cap Rate, Value Estimation, Potential NOI and more
View Realmo Analytics
Market
Vacancy Rate% for Multifamily in Midwest region




Frequently Asked Questions
What type of property is this?
Multifamily property - Infill site in downtown Rochester near Mayo Clinic campuses and within the DMC–St. Mary’s District.
Where is this multifamily property located?
The property is located at 917 2nd St SW Rochester, MN.
What is the asking price?
The asking price for this property is $1,300,000.
What are key features of this property?
This property features: Infill development site in downtown Rochester near Mayo Clinic campuses; Walking distance to Mayo Clinic Hospital, Saint Mary’s Campus, and Mayo Clinic Downtown Campus; Located within the DMC–St. Mary’s District (public‑private growth initiative)


