Freestanding Multi-Tenant
For Sale
$4,900,000
815 NE 13th Street, Fort Lauderdale, FL 33304
Three-suite freestanding building includes an operating coffee shop and barber salon plus a former restaurant with drive-thru and patio.
Property Size8,495 SF
Lot Size0.62 Acres
Price / SF$576.81
Days on Market78
Property Features for 815 NE 13th Street
General Information
Standard status
Active
Size
8,495 SF
Lot size
0.62 Acres
Zoning
CB
Taxes and HOA fees
Annual Taxes
$51,837
Amenities
drive-thru
commercial kitchen
bar area
outdoor patio
onsite parking
flexible layouts
Building Details
Year Built
1961
Tenancy
Multi
Listing Agency:
Coldwell Banker Realty
Listed By:
Timothy J Singer · License #504788
(954) 463-1373
Source:
Laerrealty
Added: Jul 22
Changed: Oct 3
Last Checked: Oct 5 at 4:02PM
Displayed information is deemed reliable but is not guaranteed and should be independently verified. All listing content including descriptions, pricing, images are the copyrighted material of Coldwell Banker Realty
Investment Insights
Based on property information with market context.
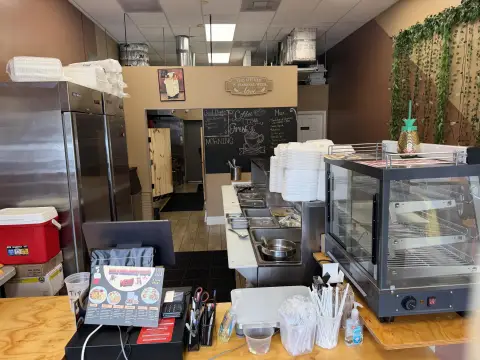
A freestanding, multi-tenant commercial property featuring three distinct commercial suites within an approximately 18,495 SF building. Two suites are currently operating under long-term leases: a boutique barber salon and a coffee shop. The former Milk Money restaurant suite includes a fully built-out commercial kitchen, a substantial bar, outdoor patio space, and drive-thru capability.
The restaurant space is currently available and may be leased as a single approximately 5,700 SF premises or divided into two separate suites: a front space with built-in bar and customer seating areas (approximately 2,648 SF), and a rear space with the commercial kitchen and restaurant infrastructure plus drive-thru capability (approximately 3,052 SF). The property includes ample onsite parking, strong visibility and street presence, and flexible commercial layouts with existing ingress and egress.
Located at 815 NE 13th Street in Fort Lauderdale, the property is minutes from Downtown Fort Lauderdale and nearby destinations including Las Olas Boulevard, Flagler Village, Victoria Park, Wilton Manors, Fort Lauderdale Beach, Federal Highway (US-1), and I-95. Owner financing may be available to qualified buyers, and lease opportunities are also available. Showings are strictly by appointment only; please do not disturb tenants or customers. All information is deemed reliable but not guaranteed; buyers should independently verify all matters deemed material.
The restaurant space is currently available and may be leased as a single approximately 5,700 SF premises or divided into two separate suites: a front space with built-in bar and customer seating areas (approximately 2,648 SF), and a rear space with the commercial kitchen and restaurant infrastructure plus drive-thru capability (approximately 3,052 SF). The property includes ample onsite parking, strong visibility and street presence, and flexible commercial layouts with existing ingress and egress.
Located at 815 NE 13th Street in Fort Lauderdale, the property is minutes from Downtown Fort Lauderdale and nearby destinations including Las Olas Boulevard, Flagler Village, Victoria Park, Wilton Manors, Fort Lauderdale Beach, Federal Highway (US-1), and I-95. Owner financing may be available to qualified buyers, and lease opportunities are also available. Showings are strictly by appointment only; please do not disturb tenants or customers. All information is deemed reliable but not guaranteed; buyers should independently verify all matters deemed material.
Key Highlights
- 3 commercial suites in an 8,495 SF freestanding building on a 27,094 SF lot
- Former Milk Money restaurant space (approx. 5,700 SF) includes fully built‑out commercial kitchen, substantial bar, and outdoor patio
- Restaurant space offers rare drive‑thru capability; front space approx. 2,648 SF and rear space approx. 3,052 SF can be leased separately
Financial Insights
Estimated NOI and Cap Rate
NOI / Yr
$171,015
Cap Rate
3.49%
Suggested Prices Based on Cap Rates
Cap Rate 5%
$3,420,300
$3.4M
Cap Rate 7%
$2,443,071
$2.4M
Cap Rate 9%
$1,900,167
$1.9M
Market Conditions
NOI Build-Up for 8,495 SF
Gross rent
$244.7K $28.80/SF
− Vacancy
−$16.6K −$1.96/SF
EGI
$228.0K $26.84/SF
− OpEx
−$57.0K −$6.71/SF
NOI
$171.0K $20.13/SF
Area
Fort Lauderdale, FL
Vacancy
6.80%
Lease Rate
$28.80 /SF/Yr
Expense Ratio
25.00%
Simulate Cap Rate and NOI
Suggested Prices Based on Cap Rates
Cap Rate 5%
$3,420,300
Cap Rate 7%
$2,443,071
Cap Rate 9%
$1,900,167
Alternative Uses
Best Use
Specialty Retail
$2.44M
$2.14M – $2.85M
NOI $171,015 @ 7.0% cap · market cap 3.49%
Second Best
—
—
no second resolved use
Theoretical Best
Office A
$5.71M
$5.00M – $6.66M
NOI $399,605 @ 7.0% cap · market cap 8.16%
Zoning and permitted uses should be independently verified with authorities.
Property Analytics
Unlock full access to Insights
Subscribe to Realmo Intelligence
Open Analytics
Current Use
Lease Details
Multi-tenant
Tenancy
Location Intelligence
Trade Area within ½ mile
1,766
Businesses Nearby
90k
Monthly Visits Nearby
Explore this area
Business Placement
Foot Traffic Nearby
Home Improvements & Furnishings 64%
Shops & Services 34%
Apparel 3%
The Home Depot
Home Improvements & Furnishings
57,435 visits/mo
0.5 miles
7-Eleven
Shops & Services
12,635 visits/mo
0.4 miles
Sunoco
Shops & Services
7,658 visits/mo
0.4 miles
Exxon
Shops & Services
4,540 visits/mo
0.3 miles
Pet Supermarket
Shops & Services
4,341 visits/mo
0.4 miles
Demographics for 33304, FL
19,978
Population
12,367
Households
1.6
Avg Household Size
46
Median Age
51%
College-Educated
93%
High-School Grad
3.1 sq mi
ZIP Area
6,445
Density / Sq Mi
$84,951
Median Household Income
$55,527
Median Earnings
$1,727
Median Rent
$556,400
Median Home Value
Check the figures for this property
Cap Rate, Value Estimation, Potential NOI and more
View Realmo Analytics
Market
Vacancy Rate% for Retail in Fort Lauderdale, FL

Questions? Ask Rey
Realmo’s AI knows this listing — price, zoning, demand, history. Ask anything.




Frequently Asked Questions
What type of property is this?
Drive through restaurant - Three-suite freestanding building includes an operating coffee shop and barber salon plus a former restaurant with drive-thru and patio.
Where is this drive through restaurant located?
The property is located at 815 NE 13th Street Fort Lauderdale, FL.
What is the asking price?
The asking price for this property is $4,900,000.
What are key features of this property?
This property features: 3 commercial suites in an 8,495 SF freestanding building on a 27,094 SF lot; Former Milk Money restaurant space (approx. 5,700 SF) includes fully built‑out commercial kitchen, substantial bar, and outdoor patio; Restaurant space offers rare drive‑thru capability; front space approx. 2,648 SF and rear space approx. 3,052 SF can be leased separately



