Second-Generation Restaurant
For Sale
$1,550,000
2822 E Commercial Boulevard, Fort Lauderdale, FL 33308
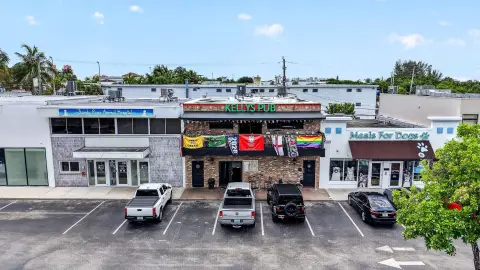
Existing second-generation restaurant buildout with strong E Commercial Boulevard exposure and approximately 42,500 vehicles daily.
Property Size2,508 SF
Days on Market110
Property Features for 2822 E Commercial Boulevard
General Information
Standard status
Active
Size
2,508 SF
Property subtype
Commercial
Occupancy
50%
Additional Details
Traffic Count
42,500 vehicles/day
Building Details
Building Size
2,508 SF
Units
2
Listed By:
Aidan Hernandez · License #SL3643765 (FL)
(754) 285-1542
Source:
Matthews
Added: Jun 22
Changed: Sep 12
Last Checked: Oct 7 at 8:28AM
Displayed information is deemed reliable but is not guaranteed and should be independently verified. All listing content including descriptions, pricing, images are the copyrighted material of Aidan Hernandez
Investment Insights
Based on property information with market context.
This property is an existing second-generation restaurant space presented as a retail storefront opportunity for food-and-beverage operators. The buildout provides immediate in-place occupancy potential, with suitability for a range of concepts such as a cafe, coffee shop, sandwich shop, or juice bar. As a conventional restaurant/retail asset, it is designed to support walk-in and counter-service formats rather than general office use.
Located in East Fort Lauderdale along E Commercial Boulevard, the property is positioned in a coastal trade area with access to nearby resort and recreation destinations, including Lauderdale By-the-Sea, Fort Lauderdale Beach, and the Intracoastal Waterway. The offering also highlights strong street exposure, supported by approximately 42,500 vehicles per day along E Commercial Boulevard, along with convenient access to surrounding residential communities, hotels, restaurants, and retail destinations.
For tenants and owner-users, the key advantage is readiness for a variety of food and beverage concepts without starting from ground-up improvements. For buyers, the property combines a restaurant buildout with high-visibility frontage on a heavily traveled corridor, and it is described as benefiting from average household incomes exceeding $167,047 within a one-mile radius.
Located in East Fort Lauderdale along E Commercial Boulevard, the property is positioned in a coastal trade area with access to nearby resort and recreation destinations, including Lauderdale By-the-Sea, Fort Lauderdale Beach, and the Intracoastal Waterway. The offering also highlights strong street exposure, supported by approximately 42,500 vehicles per day along E Commercial Boulevard, along with convenient access to surrounding residential communities, hotels, restaurants, and retail destinations.
For tenants and owner-users, the key advantage is readiness for a variety of food and beverage concepts without starting from ground-up improvements. For buyers, the property combines a restaurant buildout with high-visibility frontage on a heavily traveled corridor, and it is described as benefiting from average household incomes exceeding $167,047 within a one-mile radius.
Key Highlights
- Second‑generation restaurant buildout for immediate occupancy and food/beverage concepts such as cafe, coffee shop, sandwich shop, or juice bar.
- Located on E Commercial Boulevard in East Fort Lauderdale with strong street frontage and signage exposure.
- Approximately 42,500 vehicles per day pass along E Commercial Boulevard.
Financial Insights
Estimated NOI and Cap Rate
NOI / Yr
$50,489
Cap Rate
3.26%
Suggested Prices Based on Cap Rates
Cap Rate 5%
$1,009,780
$1.0M
Cap Rate 7%
$721,271
$721.3K
Cap Rate 9%
$560,989
$561.0K
Market Conditions
NOI Build-Up for 2,508 SF
Gross rent
$72.2K $28.80/SF
− Vacancy
−$4.9K −$1.96/SF
EGI
$67.3K $26.84/SF
− OpEx
−$16.8K −$6.71/SF
NOI
$50.5K $20.13/SF
Area
Fort Lauderdale, FL
Vacancy
6.80%
Lease Rate
$28.80 /SF/Yr
Expense Ratio
25.00%
Simulate Cap Rate and NOI
Suggested Prices Based on Cap Rates
Cap Rate 5%
$1,009,780
Cap Rate 7%
$721,271
Cap Rate 9%
$560,989
Alternative Uses
Best Use
Specialty Retail
$721.3K
$631.1K – $841.5K
NOI $50,489 @ 7.0% cap · market cap 3.26%
Second Best
—
—
no second resolved use
Theoretical Best
Office A
$1.69M
$1.47M – $1.97M
NOI $117,976 @ 7.0% cap · market cap 7.61%
Zoning and permitted uses should be independently verified with authorities.
Property Analytics
Unlock full access to Insights
Subscribe to Realmo Intelligence
Open Analytics
Current Use
Lease Details
42,500 VPD
Traffic count
Location Intelligence
Trade Area within ½ mile
3,417
Businesses Nearby
119k
Monthly Visits Nearby
Under-served
Demand for This Use
Explore this area
Business Placement
Foot Traffic Nearby
Dining 67%
Shops & Services 31%
Hotels & Casinos 2%
Starbucks
Dining
19,210 visits/mo
0.4 miles
Mobil
Shops & Services
16,189 visits/mo
0.1 miles
Benihana
Dining
13,726 visits/mo
0.4 miles
Olive Garden
Dining
12,658 visits/mo
0.4 miles
Bank of America
Shops & Services
12,011 visits/mo
0.4 miles
Demographics for 33308, FL
29,519
Population
23,230
Households
1.3
Avg Household Size
57
Median Age
56%
College-Educated
96%
High-School Grad
4.6 sq mi
ZIP Area
6,417
Density / Sq Mi
$83,413
Median Household Income
$58,600
Median Earnings
$1,850
Median Rent
$536,900
Median Home Value
Check the figures for this property
Cap Rate, Value Estimation, Potential NOI and more
View Realmo Analytics
Market
Vacancy Rate% for Retail in Fort Lauderdale, FL

Questions? Ask Rey
Realmo’s AI knows this listing — price, zoning, demand, history. Ask anything.






Frequently Asked Questions
What type of property is this?
Conventional restaurant - Existing second-generation restaurant buildout with strong E Commercial Boulevard exposure and approximately 42,500 vehicles daily.
Where is this conventional restaurant located?
The property is located at 2822 E Commercial Boulevard Fort Lauderdale, FL.
What is the asking price?
The asking price for this property is $1,550,000.
What are key features of this property?
This property features: Second‑generation restaurant buildout for immediate occupancy and food/beverage concepts such as cafe, coffee shop, sandwich shop, or juice bar.; Located on E Commercial Boulevard in East Fort Lauderdale with strong street frontage and signage exposure.; Approximately 42,500 vehicles per day pass along E Commercial Boulevard.


