Self Storage and Flex
For Sale
Contact for pricing
Pending
7730-7762 W Boekel Rd, Rathdrum, ID 83858
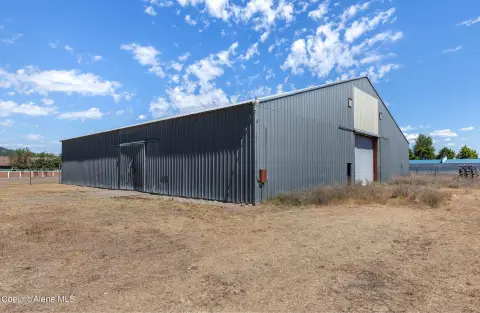
Gated, fenced storage is paired with an occupied flex building and industrial zoning.
Property Size33,110 SF
Days on Market50
Property Features for 7730-7762 W Boekel Rd
General Information
Standard status
Pending
Size
33,110 SF
Property subtype
INDUSTRIAL
Listing Agency:
Daines Capital
(509) 590-9114
Listed By:
Seth Peterson
(509) 209-4920
Source:
Moodyscre
Added: Sep 1
Changed: Oct 8
Last Checked: Oct 19 at 7:25AM
Displayed information is deemed reliable but is not guaranteed and should be independently verified. All listing content including descriptions, pricing, images are the copyrighted material of Daines Capital

Ask AI about this property
Review the available facts, identify missing information and prepare questions for the agent.
Investment Insights
Based on property information with market context.
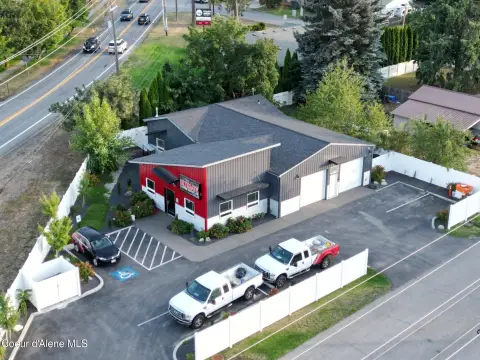
The property combines a 151-unit self-storage facility with a 4,400 SFT flex building across 2.4 acres. Storage units range from 5'x10' to 15'x25', and the facility is currently 91% occupied. The flex building includes four overhead doors and 21 parking stalls.
The flex space is fully leased to Dance Theatre NW and NW Fine Arts Academy through August 31, 2030, with annual rental increases. The self-storage operation is secured by gated and fenced access. The combined property contains approximately 33,110 square feet and carries a 5.5% cap rate. Industrial zoning supports the property's existing storage and flex configuration.
The flex space is fully leased to Dance Theatre NW and NW Fine Arts Academy through August 31, 2030, with annual rental increases. The self-storage operation is secured by gated and fenced access. The combined property contains approximately 33,110 square feet and carries a 5.5% cap rate. Industrial zoning supports the property's existing storage and flex configuration.
Key Highlights
- 151‑unit self‑storage facility currently 91% occupied
- 4,400 SFT flex building leased through August 31, 2030
- Flex building includes four overhead doors and 21 parking stalls
Financial Insights
Estimated NOI and Cap Rate
NOI / Yr
$197,746
Cap Rate
8.26%
Suggested Prices Based on Cap Rates
Cap Rate 5%
$3,954,920
$4.0M
Cap Rate 7%
$2,824,943
$2.8M
Cap Rate 9%
$2,197,178
$2.2M
Market Conditions
NOI Build-Up for 33,110 SF
Gross rent
$298.0K $9.00/SF
− Vacancy
−$15.5K −$0.47/SF
EGI
$282.5K $8.53/SF
− OpEx
−$84.7K −$2.56/SF
NOI
$197.7K $5.97/SF
Area
Kootenai County, ID
Vacancy
5.20%
Lease Rate
$9.00 /SF/Yr
Expense Ratio
30.00%
Simulate Cap Rate and NOI
Suggested Prices Based on Cap Rates
Cap Rate 5%
$3,954,920
Cap Rate 7%
$2,824,943
Cap Rate 9%
$2,197,178
Alternative Uses
Best Use
Self Storage
$4.13M
$3.61M – $4.82M
NOI $289,110 @ 7.0% cap · market cap 12.07%
Second Best
Warehouse
$3.43M
$3.00M – $4.00M
NOI $240,120 @ 7.0% cap · market cap 10.03%
Theoretical Best
Office A
$7.18M
$6.28M – $8.38M
NOI $502,769 @ 7.0% cap · market cap 20.99%
Zoning and permitted uses should be independently verified with authorities.
How Realmo checks its estimates
Property Analytics
Current Use
Location Intelligence
Trade Area within ½ mile
164
Businesses Nearby
Explore this area
Business Placement
Demographics for 83858, ID
17,113
Population
7,660
Households
2.2
Avg Household Size
41
Median Age
25%
College-Educated
92%
High-School Grad
112.1 sq mi
ZIP Area
153
Density / Sq Mi
$93,006
Median Household Income
$38,717
Median Earnings
$1,244
Median Rent
$452,700
Median Home Value
Market
Vacancy Rate% for Industrial in West region





Frequently Asked Questions
What type of property is this?
Self storage facility - Gated, fenced storage is paired with an occupied flex building and industrial zoning.
Where is this self storage facility located?
The property is located at 7730-7762 W Boekel Rd Rathdrum, ID.
What is the asking price?
The asking price for this property is $2,395,000.
What are key features of this property?
This property features: 151‑unit self‑storage facility currently 91% occupied; 4,400 SFT flex building leased through August 31, 2030; Flex building includes four overhead doors and 21 parking stalls


